
Company Overview:
Move Logistics Group Limited (NZX: MOV) is the New Zealand-based company, which is engaged in the logistics sector. It operates through five segments: International, Specialist, Freight, Contract Logistics, and Corporate. Auckland International Airport Limited (NZX: AIA) provides airport facilities, supporting infrastructure and aeronautical services in Auckland, New Zealand.
Kalkine’s Sector Report covers the Key Financial Metrics, Risks, Outlook, Technical Analysis along with the Valuation, Target Price, and Recommendation on the stock.
I. Sector Landscape and Outlook
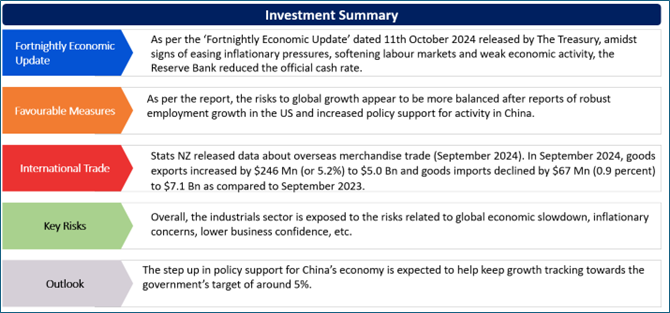
As per the ‘Fortnightly Economic Update’ dated 11th October 2024 released by The Treasury, amidst signs of easing inflationary pressures, softening labour markets and weak economic activity, the Reserve Bank reduced the official cash rate. The decision was followed by robust signs of easing inflationary pressure and was broadly in-line with market expectations. Notably, the business sentiment surveys highlight weak conditions across the September quarter, mainly in residential construction, while labour market conditions remain soft. Moving forward, easing rates continue to lift business optimism.
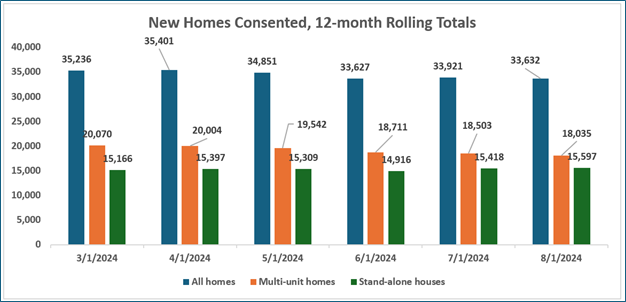
As per the report, the risks to global growth appear to be more balanced after reports of robust employment growth in the US and increased policy support for activity in China. However, oil prices have risen due to the heightened fears of disruptions to supply from the Middle East. While current conditions are weak, the easing in inflationary pressure and less restrictive monetary policy is supporting business confidence. The new residential dwelling consents were down 5.3% (seasonally adjusted) in August, hinting at residential construction remaining subdued.
Exhibit 1: New Homes Consented, 12-month Rolling Totals
Data Source: This work is based on/includes Stats NZ’s data which are licensed by Stats NZ for reuse under the Creative Commons Attribution 4.0 International Licence; Chart Created by Kalkine Group
International Trade: June 2024 Quarter
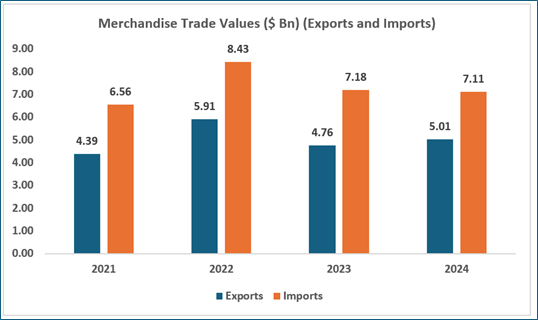
On 22nd October, Stats NZ released data about overseas merchandise trade (September 2024). In September 2024, goods exports increased by $246 Mn (or 5.2%) to $5.0 Bn and goods imports declined by $67 Mn (0.9 percent) to $7.1 Bn as compared to September 2023. The monthly trade balance was a deficit of $2.1 Bn. With respect to exports, fruit rose $233 mn (or 105%) to $454 Mn. Kiwifruit increased $212 Mn (117 percent) to $394 Mn, and apples increased $7.3 Mn (23 percent) to $39 Mn.
Talking about China, total exports were down $109 Mn, with the largest falls being witnessed in meat and edible offal, down $67 Mn, casein and caseinates (down $22 Mn) and fish, crustaceans, and molluscs (down $17 Mn). However, the largest rise was fruit, up by $52 Mn.
Exhibit 2: Merchandise Trade Values ($ Bn) (Exports and imports) (September months)
Data Source: This work is based on/includes Stats NZ’s data which are licensed by Stats NZ for reuse under the Creative Commons Attribution 4.0 International Licence; Chart Created by Kalkine Group
Building consents issued: August 2024
In August 2024, the seasonally adjusted number of new dwellings consented declined by 5.3%, after rising 26% in July 2024 and, in the year ended August 2024, the actual number of new dwellings consented was 33,632, reflecting a decline of 20% from the year ended August 2023. The annual value of non-residential building work consented stood at $9.1 Bn, down 7.9% from the year ended August 2023. In August 2024, there were 2,881 new dwellings consented, comprising 1,422 stand-alone houses, 1,137 townhouses, flats, and units and 275 retirement village units.
The seasonally adjusted number of new standalone houses consented witnessed a fall of 9.1%, after rising 28% in July 2024.
Key Risks and Challenges:
The latest NZIER Quarterly Survey of Business Opinion (QSBO) and ANZ Business Outlook (ANZBO) reinforced the fact that activity remains weak and businesses in this environment have been struggling to pass on higher costs by raising prices. The escalation of conflict in the Middle East raises questions with respect to the the outlook for growth and inflation. Notably, the biggest impacts might arise from disruption to supply.
Moreover, the broader Industrials sector might get impacted by macro-economic uncertainty, lower business confidence, slowdown in the broader economy, etc.
Exhibit 3. Key Risks in Industrials Sector:
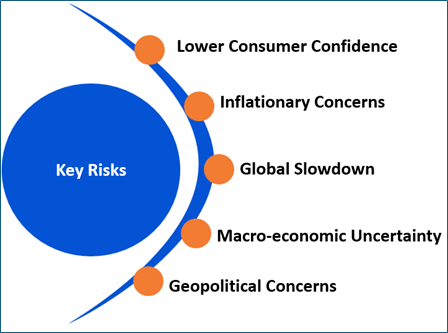
Source: Analysis by Kalkine Group
Outlook:
As per the ‘Fortnightly Economic Update’ dated 11th October 2024, the step up in policy support for China’s economy is expected to help keep growth tracking towards the government’s target of around 5%. It should also support confidence in the sustainability of recent price gains for New Zealand’s major commodity exports, which rose to the 2-year high in September. China’s equity markets saw a significant rise following the package. The surveys of business confidence reflected momentum in China’s economy remained subdued in September. However, the policy stimulus announced in late August should result in an increase in activity moving forward.
The resilience in the US economy was evident in September’s labour market reports, with non-farm payroll jobs increasing 254,000. This was much larger increase than the expectations. As per the release, the labour force survey employment demonstrated solid gains and the unemployment rate edged down one-tenth to 4.1%. Along with firmer wage growth, such outcomes supported in calming fears that the labour market was cooling too rapidly.
Apart from the sector-specific factors, an analysis on 2 NZX-listed companies is provided. This report covers their insights, outlook, performance and potential as expected to be delivered in the near to medium term.
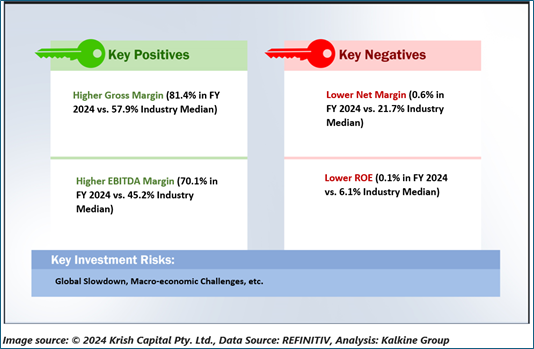
1) Auckland International Airport Limited (Recommendation: Buy, Potential Upside: Low Double-Digit) (M-Cap: NZD 12.1 billion, Annual Dividend Yield (TTM)1: 2.54%)
Business Description:
Auckland International Airport Limited (NZX: AIA) provides airport facilities, supporting infrastructure and aeronautical services in Auckland, New Zealand.
Outlook:
In September 2024, there was a total of 807k international passenger movements in the month, reflecting a 2% increase as compared to the same month in 2023. As AIA moves ahead with building projects, the organisation is focused towards reducing its direct carbon emissions and supporting other airport operators to do the same. As the company looks ahead to the FY 2025, the airport continues to see interest from new and existing international airlines in providing additional capacity into NZ.
Technical Overview:
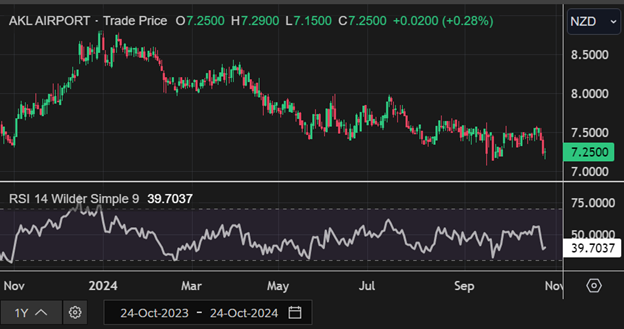
AIA Daily Technical Chart, Data Source: REFINITIV
Technical Commentary
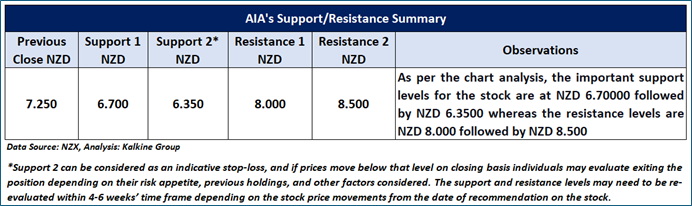
On the daily chart, AIA’s stock prices are forming a trading range characterized by lower highs and higher lows, indicating that the sideways period in the stock might continue to persist in the near future. Moreover, the momentum oscillator RSI (14-period) is fluctuating between the levels of 40 and 60, adding further evidence for the mentioned recommendation. Prices are trading between its previous peak and trough, which might function as resistance and support levels for the stock, respectively. An important support level for the stock is placed at NZD 6.70, while key resistance level is situated at NZD 8.
Fundamental Valuation
P/E Based Valuation
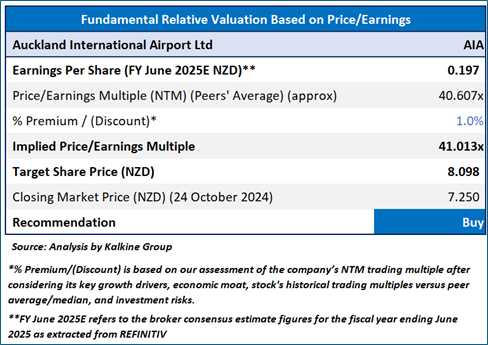
Stock Recommendation
Considering the aforementioned factors, a ‘Buy’ rating is given on the stock at the closing market price of NZD 7.25 per share, up by 0.28% as on 24 October 2024
2) Move Logistics Group Limited (Recommendation: Speculative Buy, Potential Upside: Low Double-Digit) (M-Cap: NZD 23.7 Mn)
Business Description:
Move Logistics Group Limited (NZX: MOV) is a New Zealand-based company, which is engaged in domestic freight and logistics business.
Outlook:
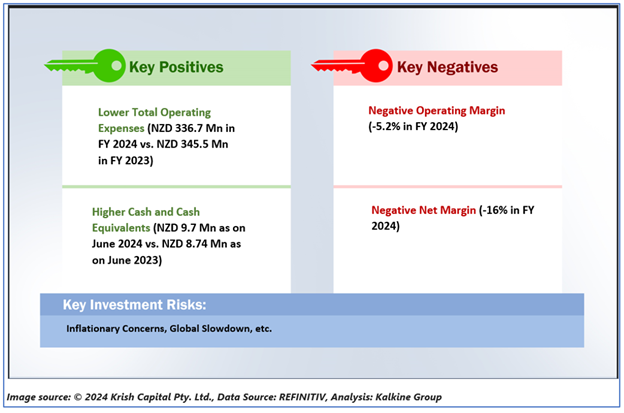
MOV signed an agreement for the sale of its vessel, the Atlas Wind for US$1.1 Mn. The change programme, which started in July 2024, is performing to plan with early wins including expanded customer sales activity as well as good progress in the Freight turnaround. MOV is targeting positive adjusted net operating cashflow and a significant improvement in normalised EBT in FY 2025, and a return to normalised EBT profit in FY 2026.
Technical Overview:
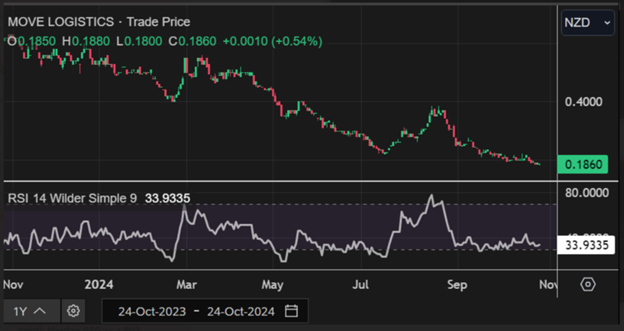
MOV Daily Technical Chart, Data Source: REFINITIV
Technical Commentary
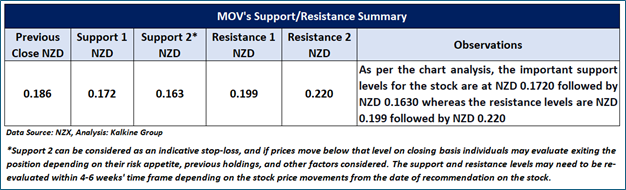
Though undergoing a downtrend, MOV’s stock prices are forming multiple bottom divergences in relation to the relative strength indicator, anticipating for a potential rally. Moreover, the momentum oscillator RSI (14-period) is trading near its oversold region, providing more support to the previous observation. Prices are trading below both trend following indicators 21-period and 50-period SMA, which might serve as dynamic resistance level for the stock; in contrast, the stock’s nearest round level might act as a sentimental support. A significant support level for the stock is positioned at NZD 0.172, while critical resistance level is located at NZD 0.199.
Stock Recommendation
Considering the aforementioned factors, a ‘Speculative Buy’ rating is given on the stock at the closing market price of NZD 0.186 per share, up by 0.54% as on 24 October 2024.
Markets are trading in a highly volatile zone currently due to certain macro-economic issues and geopolitical tensions prevailing. Therefore, it is prudent to follow a cautious approach while investing.
Note 1: Past performance is neither an indicator nor a guarantee of future performance.
Note 2: The reference date for all price data, currency, technical indicators, support, and resistance levels is October 24, 2024. The reference data in this report has been partly sourced from REFINITIV.
Note 3: Investment decisions should be made depending on an individual's appetite for upside potential, risks, holding duration, and any previous holdings. An 'Exit' from the stock can be considered if the Target Price mentioned as per the Valuation and or the technical levels provided has been achieved and is subject to the factors discussed above.
Note 4: Annual Dividend Yield is on a Trailing Twelve Month (TTM1) basis and are subject to change based on factors such as company performance, stock price changes, etc.
Technical Indicators Defined: -
Support: A level at which the stock prices tend to find support if they are falling, and a downtrend may take a pause backed by demand or buying interest. Support 1 refers to the nearby support level for the stock and if the price breaches the level, then Support 2 may act as the crucial support level for the stock.
Resistance: A level at which the stock prices tend to find resistance when they are rising, and an uptrend may take a pause due to profit booking or selling interest. Resistance 1 refers to the nearby resistance level for the stock and if the price surpasses the level, then Resistance 2 may act as the crucial resistance level for the stock.
Stop-loss: It is a level to protect further losses in case of unfavourable movement in the stock prices.
Disclaimer This report has been issued by Kalkine New Zealand Limited (FSP691351) (NZBN:9429047678101) (“Kalkine”). Kalkine is a Financial Advice Provider (“FAP”) and is authorised by a Class 1 Financial Advice Provider Licence issued by Financial Markets Authority (“FMA”) to provide financial advice. Kalkine provides only general financial advice through its research reports following a person becoming a member. The reports contain buy/sell/hold and other recommendations in relation to equity securities, managed funds and other managed investment schemes and other financial advice products. The recommendations and opinions in this report and on Kalkine website do not take into account any of your investment objectives, financial situation or needs. Before you make a decision about whether to acquire a financial product, you should obtain the Product Disclosure Statement from the product issuer. You should consider the appropriateness of advice taking into account your own objectives, financial situation and needs and seek independent financial advice before making any financial decisions. If you act on the advice in the research reports, you may have to pay fees, expenses or other amounts (but not to Kalkine). Further information about the complaints and dispute resolution process, as well as information about Kalkine’s duties are available on Kalkine’s website. Please read our Financial Advice Provider (FAP) disclosure statement and Complaints Handling Guide, which are available on the website.
Past performance is not a reliable indicator of future performance.
 Please wait processing your request...