
Overview:
Marlin Global Limited (NZX: MLN) is a listed investment company that invests in growing companies based outside of New Zealand and Australia. Heartland Group Holdings Limited (NZX: HGH) is a New Zealand-based financial services company.
Kalkine’s Sector Report covers the Key Financial Metrics, Risks, Outlook, Technical Analysis along with the Valuation, Target Price, and Recommendation on the stock.
Sector Landscape and Outlook
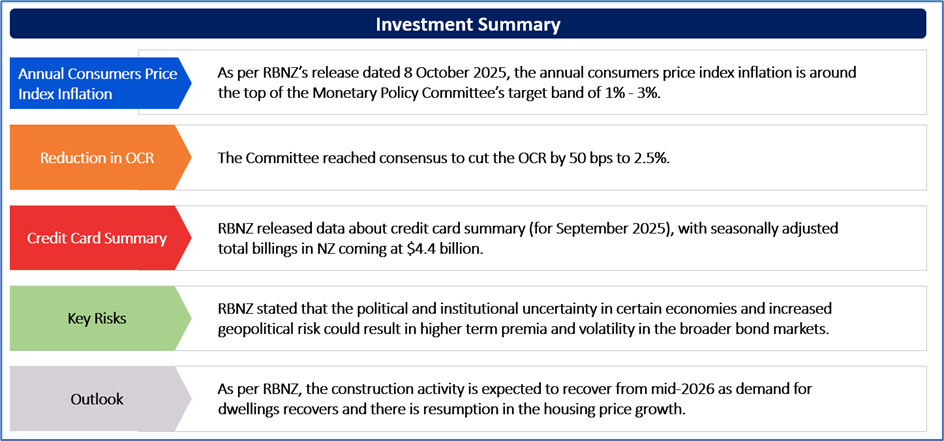
As per RBNZ’s release dated 8 October 2025, the annual consumers price index inflation is around the top of the Monetary Policy Committee’s target band of 1% - 3%. That being said, with the spare capacity in the economy, the inflation is anticipated to return to around the 2% target mid-point H1 FY 2026. Notably, the Committee reached consensus to cut the OCR by 50 bps to 2.5%. As per the release, the Committee is open to further reductions in the OCR as and when needed for inflation to settle sustainably near the 2% target mid-point over the medium term.
The economic growth in NZ’s trading partners has been proving to be resilient, mainly due to the strong investment in AI-related activity but is anticipated to slow in 2026.
Exhibit 1: OCR (%)
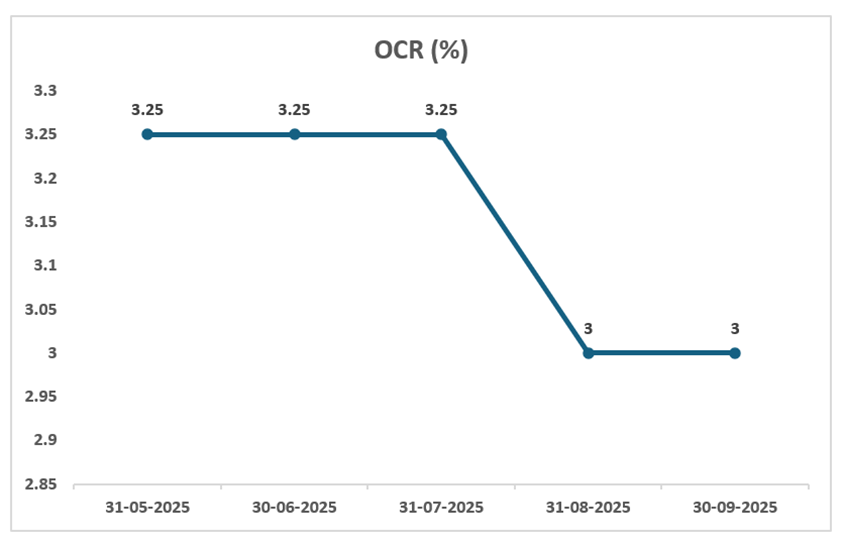
Data Source: This work is based on/includes rbnz data which are licensed by rbnz.govt.nz for reuse under the Creative Commons Attribution 4.0 International Licence; Chart Created by Kalkine Group
Note: The above chart depicts Official Cash Rate (OCR), which is updated at end of month
Credit Card Summary (September 2025)
RBNZ released data about credit card summary (for September 2025), with seasonally adjusted total billings in NZ coming at $4.4 billion. Annually, this reflects a rise of 0.2% from September 2024. The seasonally adjusted domestic billings on NZ issued cards amounted to $3.8 Bn in September-25, down by 2.4% from August 2025, and a rise of 1.2% from September 2024. The overseas billings on NZ issued cards stood at $775.8 Mn in September-25, reflecting a rise of 10.9% from August 2025. Annually, there was a rise of 7.1% from September 2024.
Exhibit 2: Total Billings in New Zealand
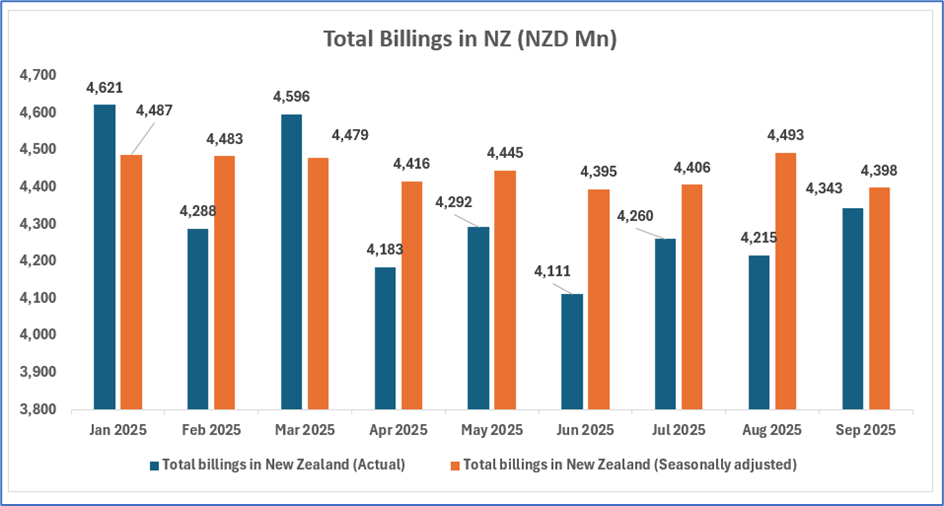
Data Source: This work is based on/includes rbnz data which are licensed by rbnz.govt.nz for reuse under the Creative Commons Attribution 4.0 International Licence; Chart Created by Kalkine Group
Current Trends in Housing Market
As per the FEU dated 23 October 2025, the housing market is subdued, with lower levels of net migration, easing of rental price growth, and higher stocks of houses for sale containing the activity. The seasonally adjusted house sales volumes declined 4.5% in the month of September after 3.1% decline in the month of August. Furthermore, migration reflects the soft labour market conditions. The fall in net migration demonstrates a record high net outflow of NZ citizens.
Key Risks and Challenges:
As per RBNZ’s release dated 8th October 2025, Committee discussed upside risks to the domestic inflation. Notably, the businesses have been facing cost pressures from administered prices, like the local council rates, and some energy charges. It was also mentioned that there remains uncertainty related to how long elevated equity prices as well as elevated investment activity in the AI technology sector would be sustained. Additionally, the political and institutional uncertainty in certain economies and increased geopolitical risk could result in higher term premia and volatility in the broader bond markets.
Exhibit 3. Key Risks in Financial Sector:
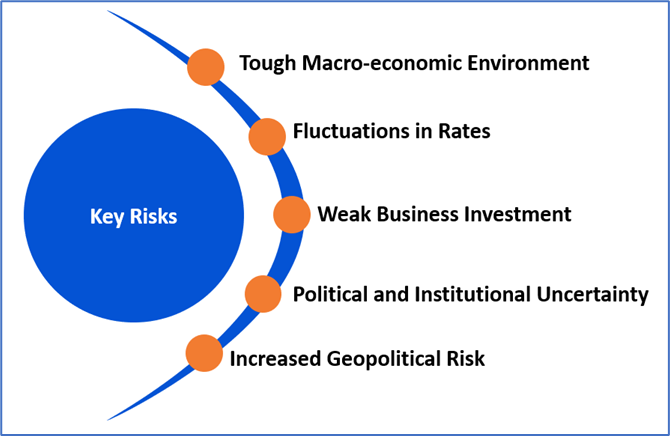
Source: Analysis by Kalkine Group
Outlook:
As per RBNZ, slow growth in disposable incomes as well as house prices have been impacting the economic activity. However, the lower interest rates continue to support recovery in consumption. Notably, the construction activity is expected to recover from mid-2026 as demand for dwellings recovers and there is resumption in the housing price growth. As per the Committee, this can reduce the spare capacity in the broader economy and support higher business investment. This is despite the export prices moderating from higher levels, and government spending declining as the share of broader economy.
Furthermore, RBNZ stated that annual CPI inflation is anticipated to converge to the mid-point of the target range in H1 of next year.
Apart from the sector-specific factors, an analysis on 2 NZX-listed companies is provided. This report covers their insights, outlook, performance and potential as expected to be delivered in the near to medium term.
1) Marlin Global Limited (Recommendation: Hold, Potential Upside: Low Double-Digit) (M-Cap: NZD 216.4 million, Annual Dividend Yield (TTM)1: 8.91%)
Business Description:
Marlin Global Limited (NZX: MLN) is a listed investment company which invests in growing companies based outside of NZ and Australia.
Outlook:
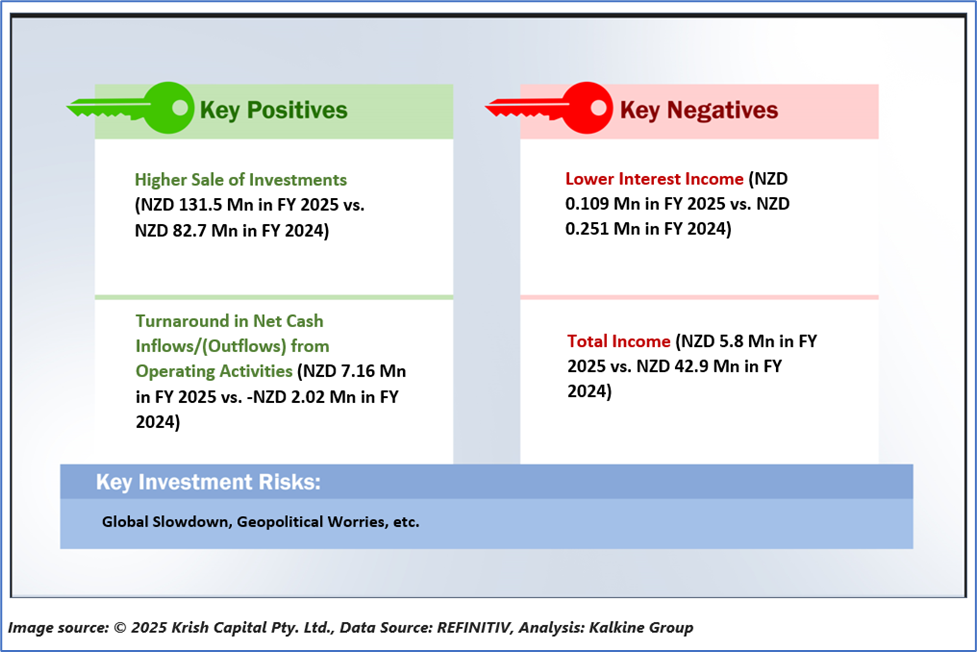
MLN is optimistic about the growth prospects of its portfolio companies, and in their prospective returns in the upcoming years. Notably, MLN ended the September quarter with gross performance up by 1.9%, while and the adjusted NAV return stood at +1.2%. Talking about the broader market environment, the global share markets witnessed a strong quarter (+7%), thanks to the easing trade tensions, strong corporate earnings, optimism related to AI, and anticipations of the monetary policy easing.
Technical Overview:
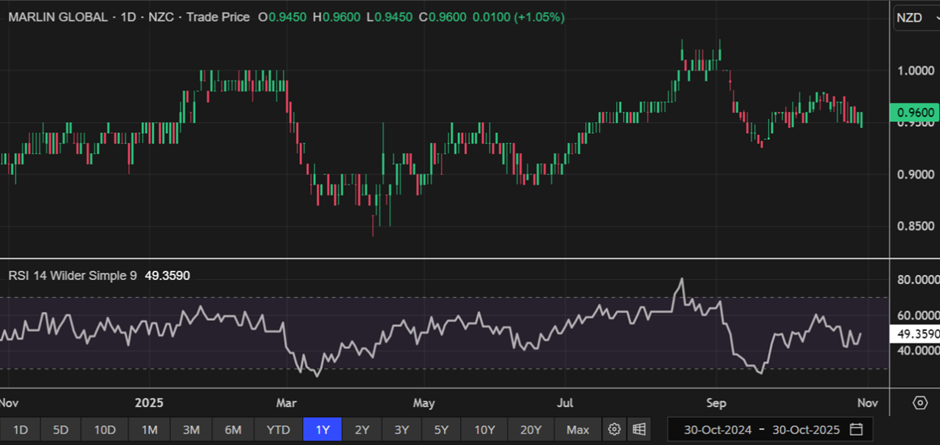
MLN Daily Technical Chart, Data Source: REFINITIV
Technical Commentary
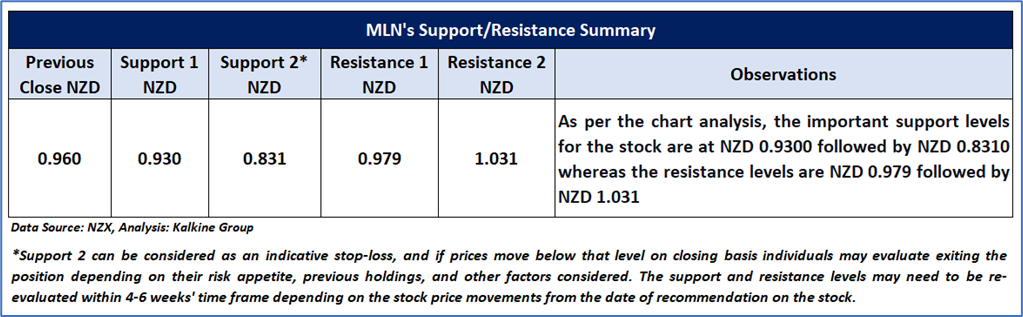
On the daily chart, MLN’s stock price is forming a trading range characterized by identical highs and lows, suggesting that the current sideways period in the stock might continue to persist in the near future. Additionally, the momentum oscillator RSI (14-period) is hovering around its midpoint, adding more evidence to the mentioned recommendation. Price is trading between its previous peak and trough, which might serve as resistance and support levels for the stock, respectively. A significant support level is located at NZD 0.930, while a key resistance level is positioned at NZD 0.979.
Stock Recommendation
Considering the facts above, a ‘Hold’ recommendation on the stock has been provided at the closing market price of NZD 0.96 per share, up by 1.05% as on 30th October 2025.
2) Heartland Group Holdings Limited (Recommendation: Buy, Potential Upside: Low Double-Digit) (M-Cap: NZD 1 Bn, Annual Dividend Yield (TTM)1: ~5.15%)
Business Description:
Heartland Group Holdings Limited (NZX: HGH) is a New Zealand-based financial services company.
Outlook:
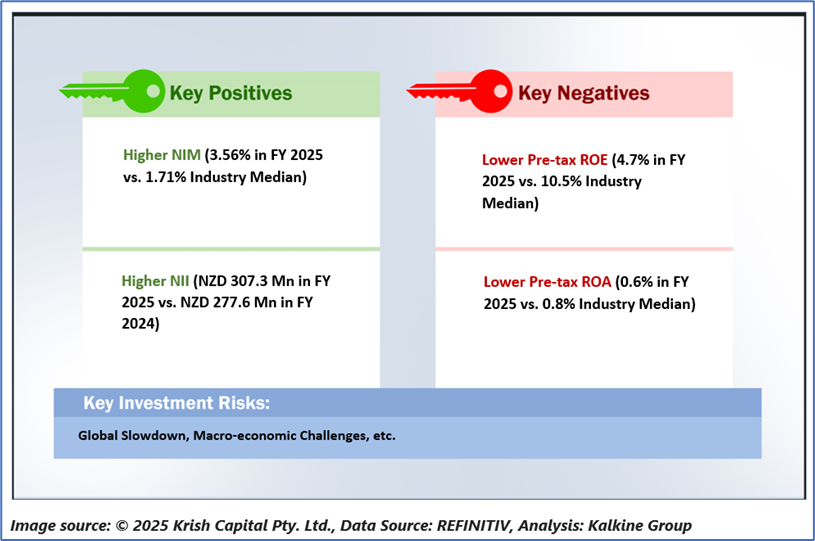
HGH’s focus for FY 2026 revolves around delivering an underlying ROE of at least 7% as well as an improved underlying NPAT of minimum $85 Mn. In FY 2026, it would be maintaining the refined strategic emphasis towards the core product sets, invest towards technology uplift in order to unlock future growth, etc.
Technical Overview:
Technical Commentary
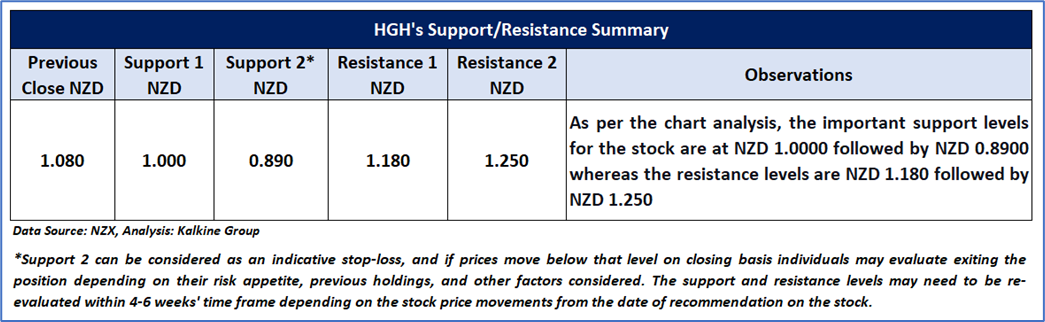
While undergoing a rally characterized by higher highs and higher lows, HGH’s stock price is approaching a significant resistance established by its prior peak, anticipating a potential correction. Moreover, the 14-period RSI is reversing from its overbought territory, which further supports this outlook. The stock is trading between its recent high and low, which may act as resistance and support levels, respectively. A key support level is located at NZD 1.000, while a critical resistance level is positioned at NZD 1.180.
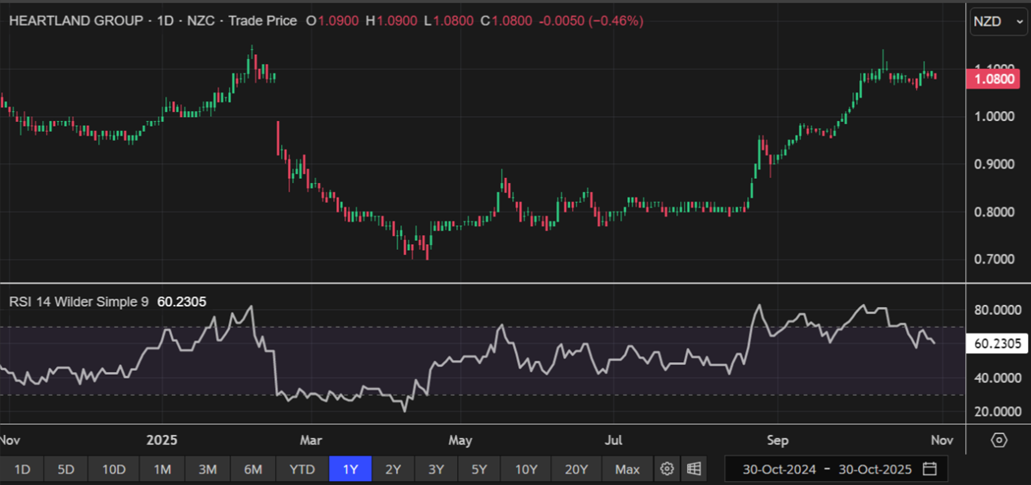
HGH Daily Technical Chart, Data Source: REFINITIV
Fundamental Valuation
P/BV Based Relative Valuation

Stock Recommendation
Considering the facts above, a ‘Buy’ recommendation on the stock has been provided at the closing market price of NZD 1.08 per share, down by 0.46% as on 30 October 2025
Note 1: Past performance is not a reliable indicator of future performance.
Note 2: The reference date for all price data, currency, technical indicators, support, and resistance levels is October 30, 2025. The reference data in this report has been partly sourced from REFINITIV.
Note 3: Investment decisions should be made depending on an individual's appetite for upside potential, risks, holding duration, and any previous holdings. An 'Exit' from the stock can be considered if the Target Price mentioned as per the Valuation and or the technical levels provided has been achieved and is subject to the factors discussed above.
Note 4: Annual Dividend Yield is on a Trailing Twelve Month (TTM1) basis and are subject to change based on factors such as company performance, stock price changes, etc.
Note 5: Kalkine reports are prepared based on the stock prices captured either from REFINITIV or Trading View. Typically, REFINITIV or Trading View may reflect stock prices with a delay which could be a lag of 25-30 minutes. There can be no assurance that future results or events will be consistent with the information provided in the report. The information is subject to change without any prior notice.
Technical Indicators Defined: -
Support: A level at which the stock prices tend to find support if they are falling, and a downtrend may take a pause backed by demand or buying interest. Support 1 refers to the nearby support level for the stock and if the price breaches the level, then Support 2 may act as the crucial support level for the stock.
Resistance: A level at which the stock prices tend to find resistance when they are rising, and an uptrend may take a pause due to profit booking or selling interest. Resistance 1 refers to the nearby resistance level for the stock and if the price surpasses the level, then Resistance 2 may act as the crucial resistance level for the stock.
Stop-loss: It is a level to protect further losses in case of unfavourable movement in the stock prices.
This report (“Report”) has been issued by Kalkine New Zealand Limited (FSP691351) (NZBN:9429047678101) (“Kalkine”). Kalkine is a Financial Advice Provider (“FAP”) and is authorised by a Class 1 Financial Advice Provider Licence issued by Financial Markets Authority (“FMA”) to provide financial advice. Kalkine provides only general financial advice through its research reports following a person becoming a member. The reports contain buy/sell/hold and other recommendations in relation to equity securities, managed funds and other managed investment schemes and other financial advice products. The recommendations and opinions in this Report and on Kalkine website do not take into account any of your investment objectives, financial situation or needs. Before you make a decision about whether to acquire a financial product, you should obtain the Product Disclosure Statement from the product issuer. You should consider the appropriateness of advice taking into account your own objectives, financial situation and needs and seek independent financial advice before making any financial decisions. If you act on the advice in the research reports, you may have to pay fees, expenses or other amounts (but not to Kalkine).
The information in this Report and on the Kalkine website has been prepared from a wide variety of sources, which Kalkine, to the best of its knowledge and belief, considers accurate. Kalkine has made every effort to ensure the reliability of the information contained in its reports (including this Report), newsletters and websites. All information represents our views at the date of publication and may change without notice.
Kalkine does not issue, sell or deal in any financial products. The information in this Report does not constitute an offer to sell securities or other financial products or a solicitation of an offer to buy securities or other financial products. Our reports contain general recommendations to invest in securities and other financial products. Kalkine is not responsible for, and does not guarantee, the performance of, or returns on, any investments mentioned in this Report.
This Report may contain information on past performance of particular investments. Past performance is not a reliable indicator of future performance. Returns stated do not take into account transaction costs and taxes.
Further information about the complaints and dispute resolution process, as well as information about Kalkine’s duties are available on Kalkine’s website. Please read our Financial Advice Provider (FAP) disclosure statement and Complaints Handling Guide, which are available on the website.
Copyright 2025 Krish Capital Pty. Ltd. (ABN 61629651510). All Rights Reserved. No part of this Report, or its content, may be reproduced in any form without our prior consent.
Past performance is not a reliable indicator of future performance.
 Please wait processing your request...