
1. Sector Landscape and Outlook
As per the Ministry for Primary Industries (MPI), Food and fibre sector exports have given better than expected performance in the year to 30 June 2022. Notably, the export revenue reached $53.1 Bn, despite challenges due to global uncertainty as well as supply chain disruptions. The export revenue for the food and fibre sector is expected to hit a record $55.0 Bn in the year to 30 June 2023, reflecting a 4% growth from the previous year. Notably, modest growth is forecast for most sectors. Dairy export revenue would be acting as the key driver behind the increase, while all the sectors are benefiting from the depreciation of NZD against USD.
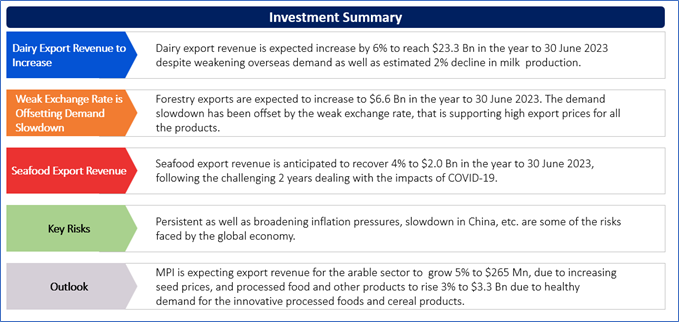
With regards to horticulture, horticulture export revenue is expected to increase 5% to $7.1 Bn in the year to 30 June 2023. This is expected to be supported by high yields from the 2022 grape harvest, anticipated recovery in apple exports as well as export price rises for wine, avocados and onions. Notably, seafood export revenue is expected to recover 4% to $2.0 billion in the year to 30 June 2023. This is after the challenging 2 years dealing with COVID-19 effects.
Dairy Extended its Lead in Export Values in October 2022
As per Stats.NZ, goods exports witnessed a rise of $1.0 billion (or 18%) to $6.7 billion in the month of November 2022 as compared to November 2021. Notably, milk powder, butter, and cheese encountered a rise of $375 million (or 19%) to $2.3 billion. Out of this, butter increased $173 Mn (or 67%) to $432 Mn, cheese and curd increased $115 Mn (or 64%) to $295 Mn and milk powder increased $30 million (or 2.3%) to $1.3 Bn. The exports witnessed a rise for most of the major trading partners in the month of November 2022.
Decent Outlook for Horticulture
Horticulture export revenue is expected to rise 5% to $7.1 Bn in the year to 30 June 2023. The growth is supported by high yields from the 2022 grape harvest, anticipated improvement in apple exports as well as export price rises for wine, avocados and onions. Wine export volumes are increasing throughout all the markets, including 4 largest (US, UK, Australia and EU). The market demand seems to be resilient for now even though there are concerns about high inflation as well as worsening macroeconomic outlook.
Exhibit 1: Trend in Wine Export Value (Year to 30 June, NZ$ million)
Data Source: This work is based on/includes the Ministry for Primary Industries data which are licensed under Crown for reuse under the Creative Commons Attribution 4.0 International Licence; Chart Created by Kalkine Group
Large 2022 Vintage Supported Record Growth in Wine Export
As per MPI, high yields for the 2022 vintage were very timely taking into consideration ongoing robust consumer demand as well as last year’s low production volume. The export revenue is projected to grow 27% to $2.5 Bn in the year to 30 June 2023 because of the large 2022 vintage, robust overseas demand as well as lower NZD.
As per the report, wine export volumes are increasing throughout all the markets, including 4 largest (US, UK, Australia and EU). Market demand seems to be resilient for now, despite increased inflation as well as worsening of the macroeconomic outlook.
Recovery in Seafood Exports
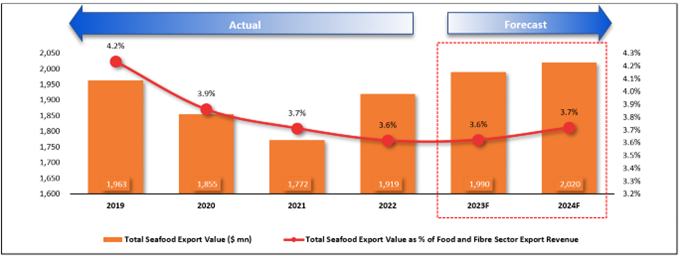
Seafood exports are witnessing robust recovery as prices are stabilising after the challenging couple of years dealing with the impacts of COVID-19. Notably, export revenue from the processed foods as well as other products is also anticipated to increase due to growth in the innovative processed foods and cereal products. NZ seafood export revenue witnessed a rise of 8% (or $147 Mn) during the year to 30 June 2022 to $1.9 Bn, almost back to the pre COVID-19 peak. For 2022/23, the seafood export revenue is expected to rise 4% to $2.0 Bn due to recovering prices as well as easing of freight issues.
Exhibit 2: Trend in Seafood Export Value 2019–24Forecast (F) (Year to 30 June, NZ$ million)
Data Source: This work is based on/includes the Ministry for Primary Industries data which are licensed under Crown for reuse under the Creative Commons Attribution 4.0 International Licence; Chart Created by Kalkine Group
Index Performance:
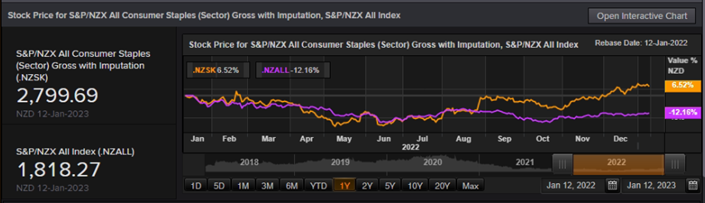
The S&P/NZX All Consumer Staples Index generated a 1-year return of ~6.52% versus ~-12.16% by the S&P/NZX All Index. Therefore, S&P/NZX All Consumer Staples Index overperformed S&P/NZX All Index by ~18.68% in 1 year.
Exhibit 3: S&P/NZX All Consumer Staples Index vs S&P/NZX All Index
Source: REFINITIV
Key Risks and Challenges:
The seafood industry is exposed to air freight disruptions, labour challenges as well as high fuel costs. The global economy has been facing challenges driven by the effects of 3 factors, i.e., persistent as well as broadening inflation pressures and government responses to combat it, slowdown in China and Russia-Ukraine conflict. Notably, slowdown in China is expected to weigh heavily on the global economic activity and affect NZ food and fibre sector exports. China’s output is projected to increase more slowly than the output of the rest of the east Asian region in 2022. This is happening for the first time since 1990.
Exhibit 4. Key Risks in Consumer Staples Sector:
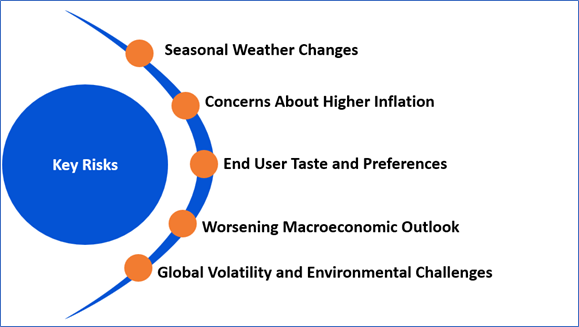
Source: Analysis by Kalkine Group
Outlook:
As per MPI, dairy export revenue is expected to increase by 6% to reach $23.3 Bn in the year to 30 June 2023, despite weakening overseas demand as well as an estimated 2% fall in milk production. Notably, the rise in exports is supported by the weak NZD, the previous season’s inventories being sold in the current year as well as lower supply from key dairy exporting regions. Despite the relatively high forecast farmgate milk price of $8.95 per kilogram of milksolids, the farm profits are expected to be subdued because of increased input costs.
After some of the challenging years due to COVID-19, the sector is now recovering as export prices are beginning to stabilise.
Apart from the sector-specific factors, an analysis on 2 NZX-listed companies is provided. This report covers their insights, outlook, performance and potential as expected to be delivered in the near to medium term.
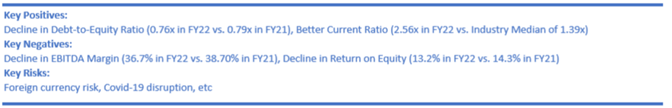
1 ) Delegat Group Limited (Recommendation: Buy, Potential Upside: Low Double-Digit) (M-Cap: NZD991.07 million, Annual Dividend Yield (TTM) 1: 2.83%)
Business Description:
Delegat Group Limited (NZX: DGL) is a New Zealand-based wine company. The company's wine brands include Oyster Bay, Barossa Valley Estate and Delegat.
Outlook:
The Company plans to grow sales by 9% to 3,672,000 cases in FY23, and it anticipates the operating net profit after tax to remain between NZD 60 Mn -NZD 64 Mn. The company plans to become Super Premium wine company. It invested NZD 39.4 mn in growth assets in FY22. The group is planning to deploy an additional NZD51.9 Mn in 2023 in order to provide earnings growth in the years ahead.
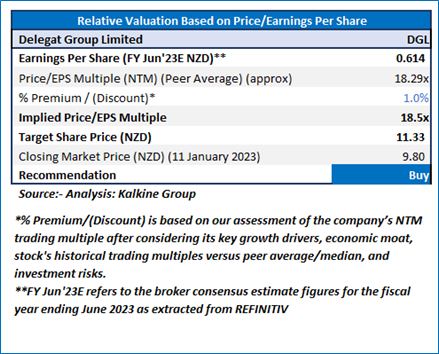
Valuation Methodology: Price/Earnings per share Based Relative Valuation (Illustrative)
Technical Overview:
Daily Price Chart
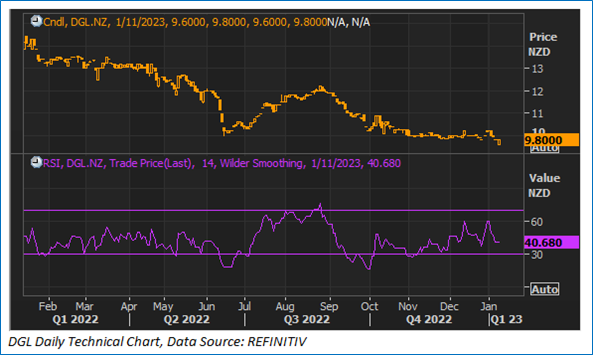
Source: REFINITIV, Note: Purple color line reflects Relative Strength Index (14-Period)
Stock Recommendation
The company continues to invest in its assets, brands and aspire to become leading global Super Premium wine company. Considering the aforementioned factors as well as upside indicated by valuation, a ‘Buy’ recommendation has been assigned on the stock at the closing market price of NZD 9.80 per share as of 11 January 2023.
2 ) Marlborough Wine Estates Group Limited (Recommendation: Speculative Buy, Potential Upside: Low Double-Digit) (M-Cap: NZD46.32 million)
Business Description:
Marlborough Wine Estates Group Limited (NZX: MWE) produces some of New Zealand’s finest Awatere Valley (Marlborough) Sauvignon Blancs. It possesses various vineyards in the Marlborough region to produce premium wines.
Outlook:
MWE's growth strategy for FY 2023 includes continued premiumisation of its branded wines, as well as broadening of its market share and international distributor network, and inorganic growth opportunities. Driven by its healthy financial structure with a low debt position, coupled with its people, partners and business foundation, the company remains hopeful to grow in a challenging business environment
Technical Overview:
Daily Price Chart
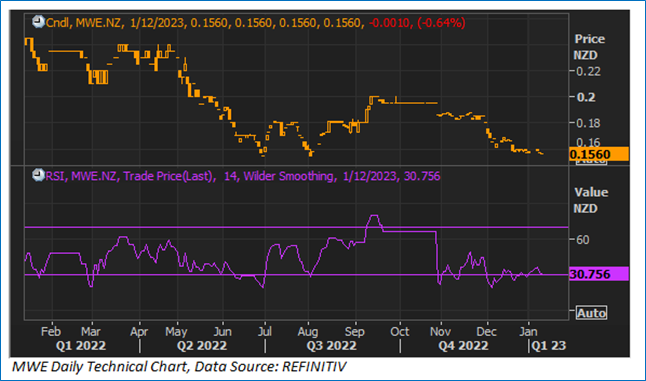
Source: REFINITIV, Note: Purple color line reflects Relative Strength Index (14-Period)
Technical Commentary:
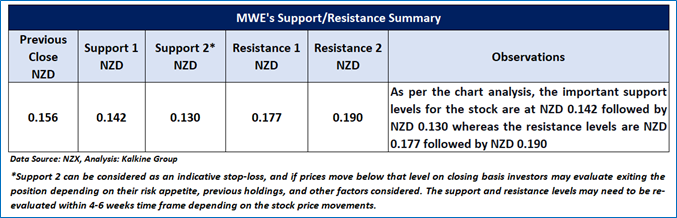
MWE stock prices approached near their historic lows and trading near significant support, suggesting a possibility of recovery. Moreover, a positive divergence on the daily RSI-14 period (~30.76), indicates a rebound going forward. MWE stock prices may face resistance near NZD 0.177 & NZD 0.190 levels, whereas it might struggle to test the NZD 0.142 & NZD 0.130 support levels.
Stock Recommendation
Considering the facts above, a ‘Speculative Buy’ recommendation on the stock has been provided at the closing price of NZD 0.156 per share, down by 0.64% as on 12 January 2023.
Markets are trading in a highly volatile zone currently due to certain macro-economic issues and geopolitical tensions prevailing. Therefore, it is prudent to follow a cautious approach while investing.
Note 1: Past performance is neither an indicator nor a guarantee of future performance.
Note 2: The reference date for all price data, currency, technical indicators, support, and resistance levels is January 12, 2023. The reference data in this report has been partly sourced from REFINITIV.
Note 3: Investment decisions should be made depending on an individual's appetite for upside potential, risks, holding duration, and any previous holdings. An 'Exit' from the stock can be considered if the Target Price mentioned as per the Valuation and or the technical levels provided has been achieved and is subject to the factors discussed above.
Note 4: Annual Dividend Yield is on a Trailing Twelve Month (TTM1) basis and are subject to change based on factors such as company performance, stock price changes, etc.
Technical Indicators Defined: -
Support: A level at which the stock prices tend to find support if they are falling, and a downtrend may take a pause backed by demand or buying interest. Support 1 refers to the nearby support level for the stock and if the price breaches the level, then Support 2 may act as the crucial support level for the stock.
Resistance: A level at which the stock prices tend to find resistance when they are rising, and an uptrend may take a pause due to profit booking or selling interest. Resistance 1 refers to the nearby resistance level for the stock and if the price surpasses the level, then Resistance 2 may act as the crucial resistance level for the stock.
Stop-loss: It is a level to protect further losses in case of unfavourable movement in the stock prices.
Disclaimer
Kalkine New Zealand Limited is a Financial Advice Provider (“FAP”) and is authorised by a Transitional FAP license issued by Financial Markets Authority (“FMA”) to provide financial advice. Kalkine provides only general financial advice through its research reports following a person becoming a member. The reports contain buy/sell/hold and other recommendations in relation to equity financial products. The recommendations and opinions [on this website] / [in this report] do not take into account any of your investment objectives, financial situation or needs. Before you make a decision about whether to acquire a financial product, you should obtain the Product Disclosure Statement from the product issuer. You should consider the appropriateness of advice taking into account your own objectives, financial situation and needs and seek independent financial advice before making any financial decisions. If you act on the advice in the research reports, you may have to pay fees, expenses or other amounts (but not to Kalkine). Further information about the complaints and dispute resolution process, as well as information about Kalkine’s duties are available on Kalkine’s website. Please read our Financial Advice Provider (FAP) disclosure statement and Complaints Handling Guide, which are available on the website.
Past performance is not a reliable indicator of future performance.
 Please wait processing your request...