
Company Overview:
Restaurant Brands New Zealand Ltd (NZX: RBD) is a corporate franchisee specialising in managing multi-site branded food retail chains. Hallenstein Glasson Holdings Limited (NZX: HLG) is a NZ-based retailer of men's and women's clothing in New Zealand and Australia.
Kalkine’s Sector Report covers the Key Financial Metrics, Risks, Outlook, Technical Analysis along with the Valuation, Target Price, and Recommendation on the stock.
1. Sector Landscape and Outlook
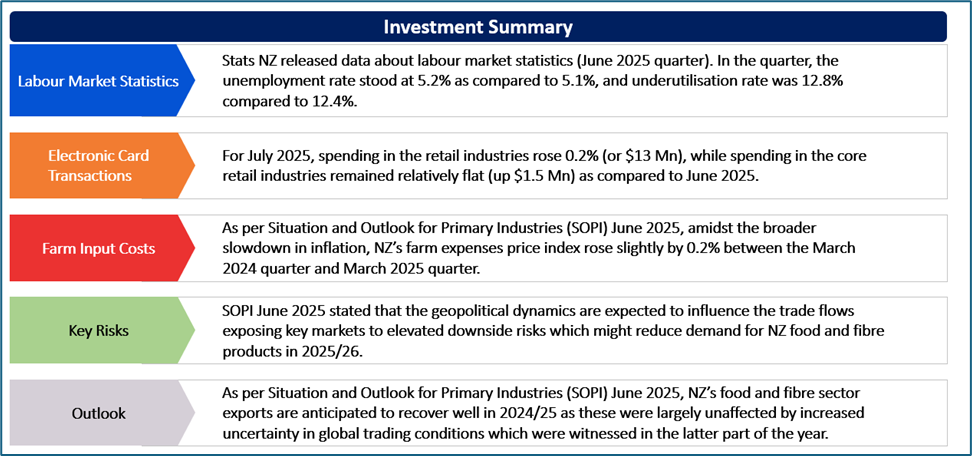
Stats NZ released data about labour market statistics (June 2025 quarter). In the quarter, the unemployment rate stood at 5.2% as compared to 5.1%, and underutilisation rate was 12.8% compared to 12.4%. Notably, employment rate was 66.8% as compared to 67.1%. Notably, the underutilisation is a broad measure of untapped labour market capacity, which includes unemployed and underemployed people, together with potential labour force.
In the quarter ended June 2025, the number of underutilised people stood at 403,000 as compared to 390,000 in the previous quarter. In the year ended June 2025, all the salary and wage rates (including overtime) rose 2.4% and average ordinary time hourly earnings increased to $43.39 from $41.52.
Exhibit 1: Food Prices (Annual % Change)
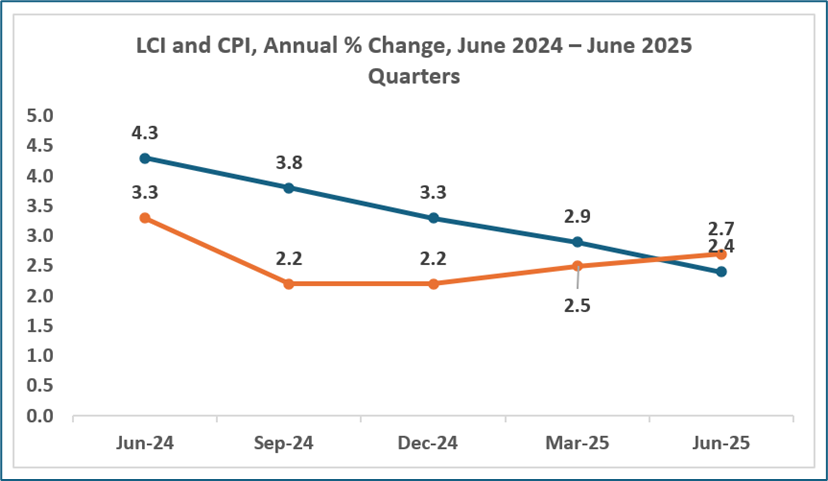
Data Source: This work is based on/includes Stats NZ’s data which are licensed by Stats NZ for reuse under the Creative Commons Attribution 4.0 International Licence; Chart Created by Kalkine Group
*LCI- Labour Cost Index
*CPI - Consumers Price Index
Electronic Card Transactions: July 2025
Stats NZ released data about electronic card transactions (July 2025). For July 2025, spending in the retail industries rose 0.2% (or $13 Mn), while spending in the core retail industries remained relatively flat (up $1.5 Mn) as compared to June 2025. By the retail spending category, the consumables were up $14 Mn (or 0.5%), motor vehicles (excluding fuel) was up by $10 Mn (or 5.2%), hospitality increased by $7.2 Mn (or 0.5%), and fuel was down by $0.6 Mn (or 0.1%).
The non-retail (excluding services) category rose by $35 Mn (or 1.6%) from June 2025. Notably, this category consists of medical and other health care, travel and tour arrangement, postal and courier delivery as well as other non-retail industries. The services category increased $1.3 Mn (or 0.3%). This category includes repair and maintenance, personal care, funeral, and other personal services.
Exhibit 2: Retail Card Spending ($ Bn), Mar 2025 – June 2025
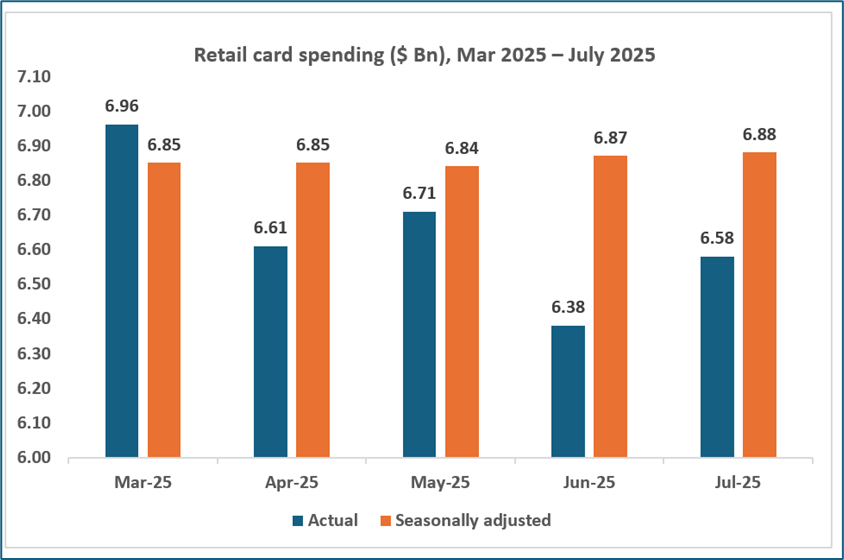
Data Source: This work is based on/includes Stats NZ’s data which are licensed by Stats NZ for reuse under the Creative Commons Attribution 4.0 International Licence; Chart Created by Kalkine Group
Trends In Farm Input Costs
As per Situation and Outlook for Primary Industries (SOPI) June 2025, amidst the broader slowdown in inflation, NZ’s farm expenses price index rose slightly by 0.2% between the March 2024 quarter and March 2025 quarter. Notably, the farm expenses were elevated and most input categories showed increased costs. The rates and fees witnessed the largest rise at 10.0%, followed by the insurance premiums (9.1%), and livestock purchases (7.8%).
Key Risks and Challenges:
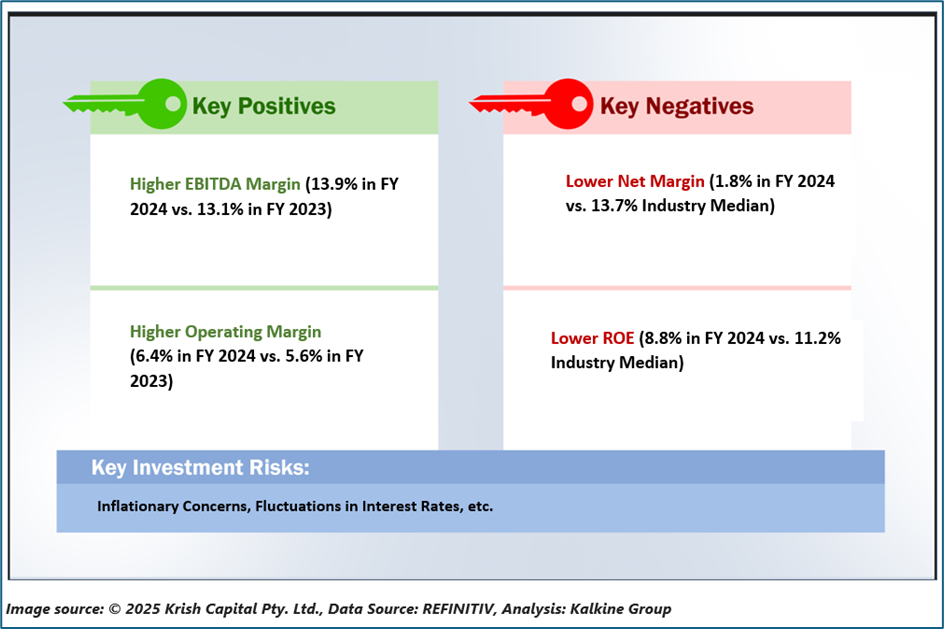
SOPI June 2025 stated that the geopolitical dynamics are expected to influence the trade flows exposing key markets to elevated downside risks which might reduce demand for NZ food and fibre products in 2025/26. The report highlighted that, since early April 2025, the global financial and bond markets witnessed numerous fluctuations, due to the trade tensions and uncertainty. The volatility can weigh over the NZ exports via fluctuations in exchange rates, interest rates, and global demand.
Exhibit 3. Key Risks in Consumer Discretionary Sector:
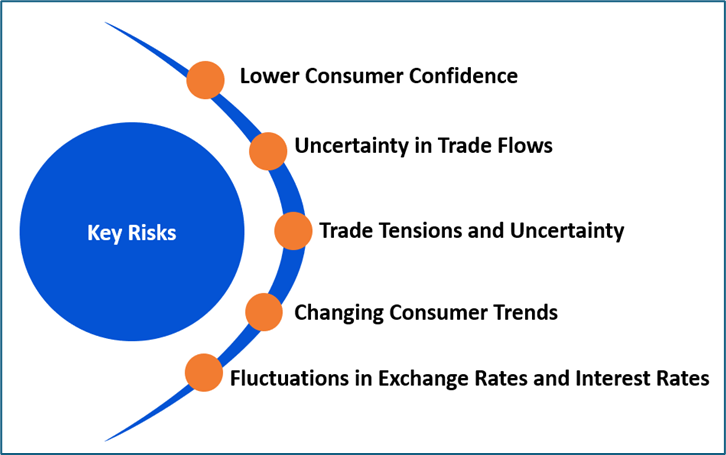
Source: Analysis by Kalkine Group
Outlook:
As per Situation and Outlook for Primary Industries (SOPI) June 2025, NZ’s food and fibre sector exports are anticipated to recover well in 2024/25 as these were largely unaffected by increased uncertainty in global trading conditions which were witnessed in the latter part of the year. Since the downside risks have been clouding the broader global economic outlook, NZ’s overall economic growth is anticipated to remain subdued. That being said, NZ’s food and fibre exports remain well-positioned to achieve further growth amidst uncertainty as demand for food happens to be constant. Furthermore, the market diversification as well as strengthening of trade relationships are expected to play a key role in growing New Zealand’s trade outcomes
As per SOPI, the business sentiment has generally improved, but firms remain cautious and are holding off investments until they are more confident regarding the more stable trading landscape. Overall, the NZ’s food and fibre sector remains in a relatively good position to absorb the direct impact of US tariffs. Furthermore, the dairy, red meat, and kiwifruit are expected to fuel expansion of food and fibre sector export growth.
Apart from the sector-specific factors, an analysis on 2 NZX-listed companies is provided. This report covers their insights, outlook, performance and potential as expected to be delivered in the near to medium term.
1) Restaurant Brands New Zealand Limited (Recommendation: Buy, Potential Upside: Low Double-Digit) (M-Cap: NZD 7 Mn, Annual Dividend Yield: 8.39%)
Business Description:
Restaurant Brands New Zealand Ltd (NZX: RBD) is a corporate franchisee which specialises in managing multi-site branded food retail chains.
Outlook:
RBD continued to modernise the business, such as accelerating the digital capabilities, enhancing customer as well as team experiences, and positioning its brands for long-term resilience and relevance. With respect to Australia, the company is monitoring economic conditions closely. Cost-of-living relief is expected later in the year, but there are expectations for recovery to remain gradual.
Technical Overview:
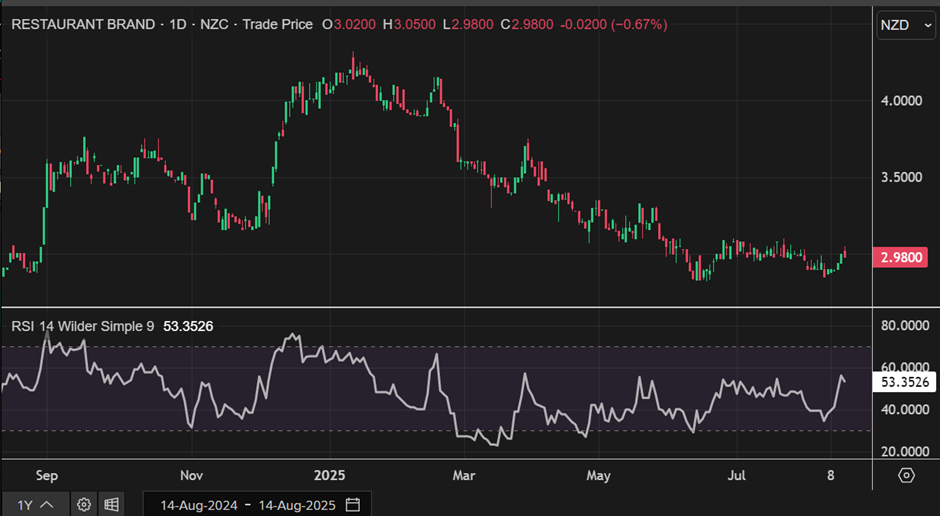
RBD Daily Technical Chart, Data Source: REFINITIV
Technical Commentary
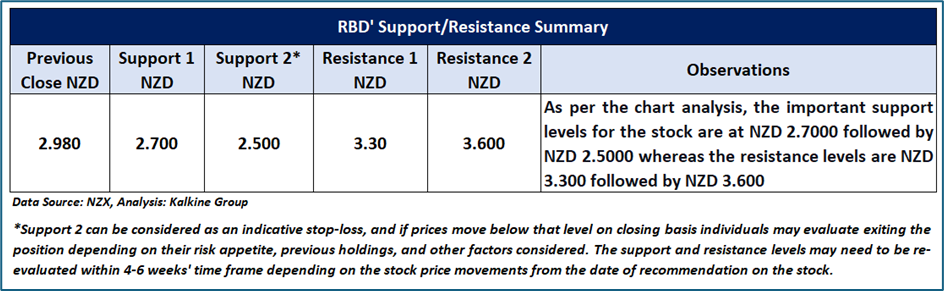
On the daily chart, RBD’s stock prices are forming a trading range characterized by identical highs and lows, suggesting that the current sideways period in the stock might continue to persist in the near future. Moreover, the momentum oscillator RSI (14-period) is trading near its midpoint, adding further evidence to the previous observation. Prices are trading between its previous peak and trough, which might function as resistance and support levels for the stock, respectively. A significant support level for the stock is positioned at NZD 2.7, while critical resistance level is located at NZD 3.3.
Fundamental Valuation
P/E Based Relative Valuation
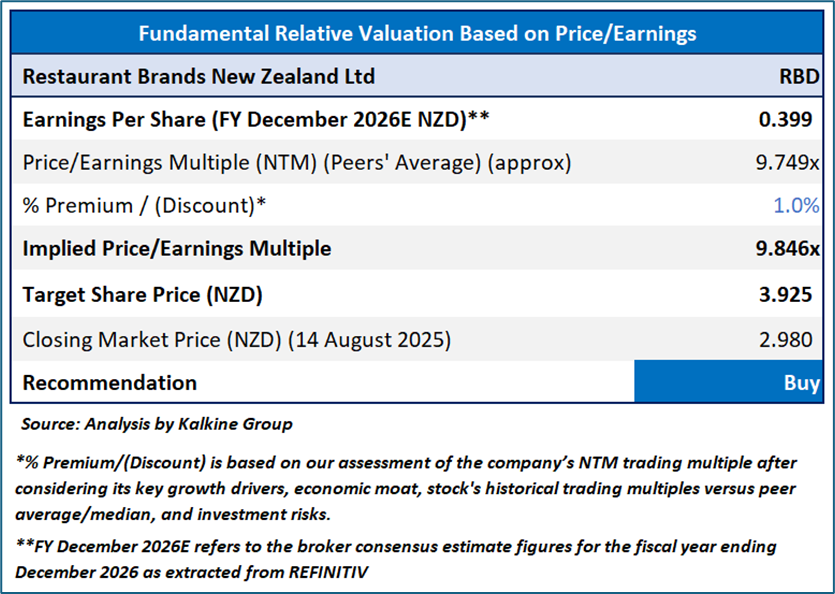
Stock Recommendation
Considering the facts above, a ‘Buy’ recommendation on the stock has been provided at the closing market price of NZD 2.98 per share, down by 0.67% as on 14 August 2025
2) Hallenstein Glasson Holdings Limited (Recommendation: Buy, Potential Upside: Low Double-Digit) (M-Cap: NZD 1 Mn, Annual Dividend Yield: 7.59%)
Business Description:
Hallenstein Glasson Holdings Limited (NZX: HLG) is a NZ-based retailer of men's and women's clothing in New Zealand and Australia.
Outlook:
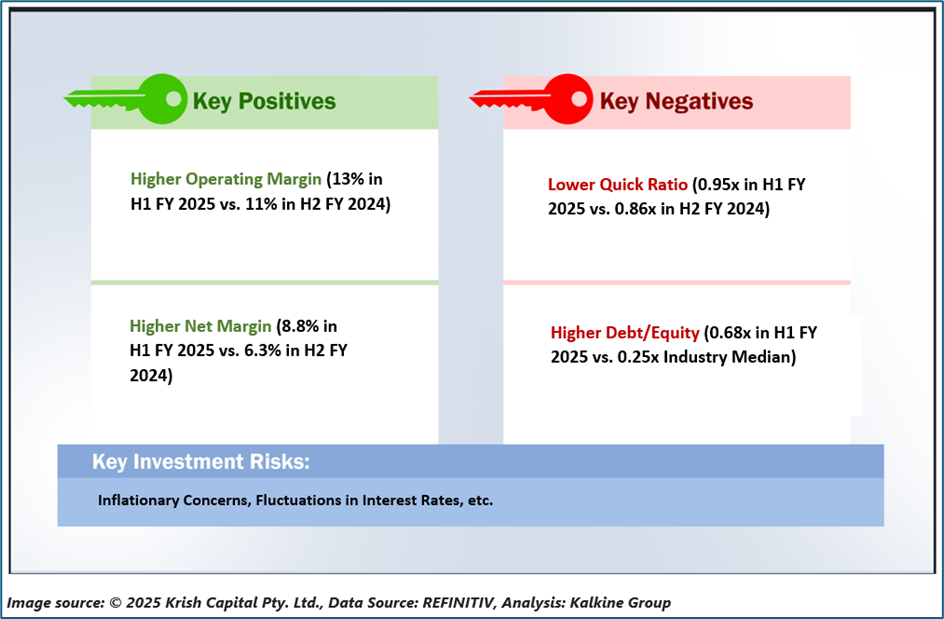
The group sales for the first 7 weeks were +5.4% ahead of the same period of the last year. However, margin is under pressure. Apart from the new stores opened in H1 FY 2025, HLG has additional refurbishment as well as new store opportunities to help growth in the H2 FY 2025.
Technical Overview:
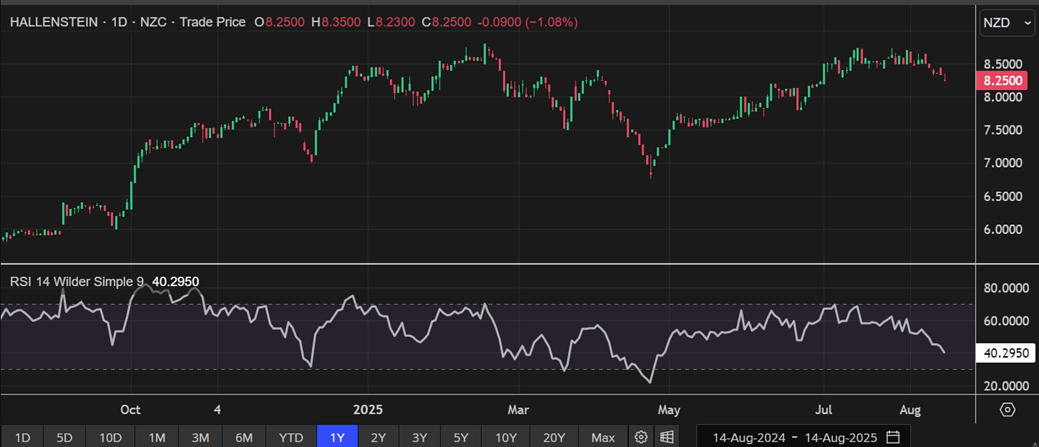
HLG Daily Technical Chart, Data Source: REFINITIV
Technical Commentary
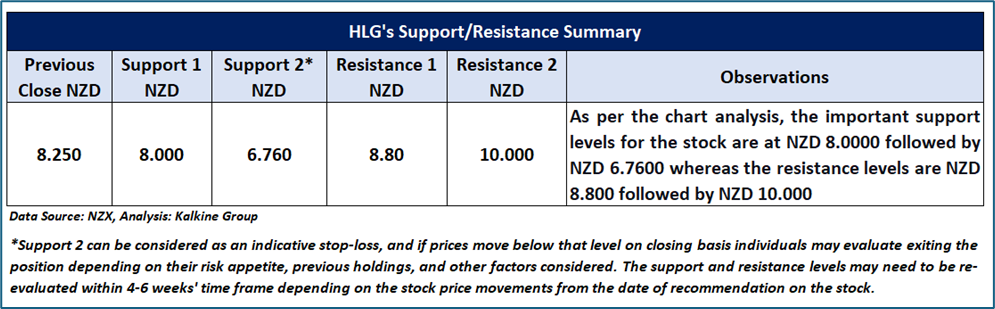
While undergoing an uptrend, HLG’s stock price is approaching its previous peak, anticipating a potential minor correction. Moreover, the momentum oscillator RSI (14-day) is forming top divergence in relation to price, providing further support to the previous observation. Price is trading below both 21-day and 50-day SMAs, which might function as dynamic resistance levels for the stock; in contrast, the stock’s previous low may act as a support level. A major support level is identified at NZD 8.00, while a critical resistance level is positioned at NZD 8.80.
Fundamental Valuation
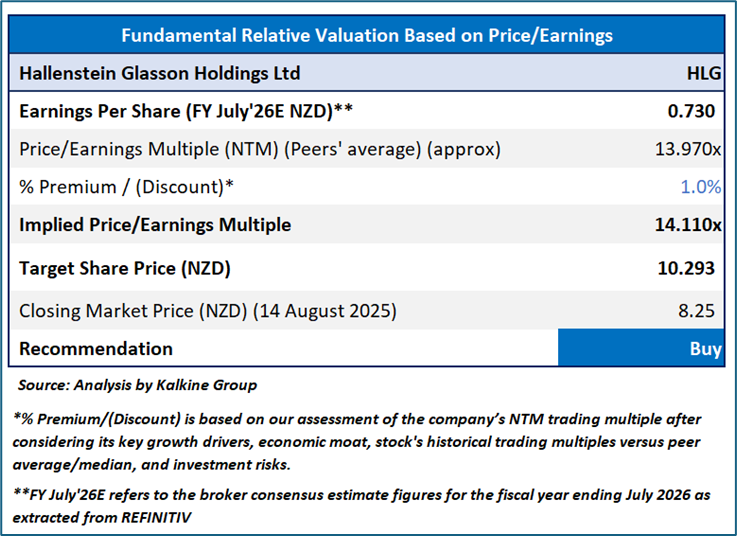
Stock Recommendation
Considering the facts above, a ‘Buy’ recommendation on the stock has been provided at the closing market price of NZD 8.25 per share, down by 1.08% as on 14 August 2025
Markets are trading in a highly volatile zone currently due to certain macro-economic issues and geopolitical tensions prevailing. Therefore, it is prudent to follow a cautious approach while investing.
Note 1: Past performance is not a reliable indicator of future performance.
Note 2: The reference date for all price data, currency, technical indicators, support, and resistance levels is August 14, 2025. The reference data in this report has been partly sourced from REFINITIV.
Note 3: Investment decisions should be made depending on an individual's appetite for upside potential, risks, holding duration, and any previous holdings. An 'Exit' from the stock can be considered if the Target Price mentioned as per the Valuation and or the technical levels provided has been achieved and is subject to the factors discussed above.
Note 4: Annual Dividend Yield is on a Trailing Twelve Month (TTM1) basis and are subject to change based on factors such as company performance, stock price changes, etc.
Note 5: Kalkine reports are prepared based on the stock prices captured either from REFINITIV or Trading View. Typically, REFINITIV or Trading View may reflect stock prices with a delay which could be a lag of 25-30 minutes. There can be no assurance that future results or events will be consistent with the information provided in the report. The information is subject to change without any prior notice.
Technical Indicators Defined: -
Support: A level at which the stock prices tend to find support if they are falling, and a downtrend may take a pause backed by demand or buying interest. Support 1 refers to the nearby support level for the stock and if the price breaches the level, then Support 2 may act as the crucial support level for the stock.
Resistance: A level at which the stock prices tend to find resistance when they are rising, and an uptrend may take a pause due to profit booking or selling interest. Resistance 1 refers to the nearby resistance level for the stock and if the price surpasses the level, then Resistance 2 may act as the crucial resistance level for the stock.
Stop-loss: It is a level to protect further losses in case of unfavourable movement in the stock prices.
Disclaimer This report has been issued by Kalkine New Zealand Limited (FSP691351) (NZBN:9429047678101) (“Kalkine”). Kalkine is a Financial Advice Provider (“FAP”) and is authorised by a Class 1 Financial Advice Provider Licence issued by Financial Markets Authority (“FMA”) to provide financial advice. Kalkine provides only general financial advice through its research reports following a person becoming a member. The reports contain buy/sell/hold and other recommendations in relation to equity securities, managed funds and other managed investment schemes and other financial advice products. The recommendations and opinions in this report and on Kalkine website do not take into account any of your investment objectives, financial situation or needs. Before you make a decision about whether to acquire a financial product, you should obtain the Product Disclosure Statement from the product issuer. You should consider the appropriateness of advice taking into account your own objectives, financial situation and needs and seek independent financial advice before making any financial decisions. If you act on the advice in the research reports, you may have to pay fees, expenses or other amounts (but not to Kalkine). Further information about the complaints and dispute resolution process, as well as information about Kalkine’s duties are available on Kalkine’s website. Please read our Financial Advice Provider (FAP) disclosure statement and Complaints Handling Guide, which are available on the website.
Past performance is not a reliable indicator of future performance.
 Please wait processing your request...