
Company Overview:
Foley Wines Limited (NZX: FWL) is an integrated wine company producing table wines with the marketing and sales of premium wines in New Zealand and various export markets. Delegat Group Limited (NZX: DGL) is a New Zealand-based wine company.
Kalkine’s Sector Report covers the Key Financial Metrics, Risks, Outlook, Technical Analysis along with the Valuation, Target Price, and Recommendation on the stock.
1. Sector Landscape and Outlook
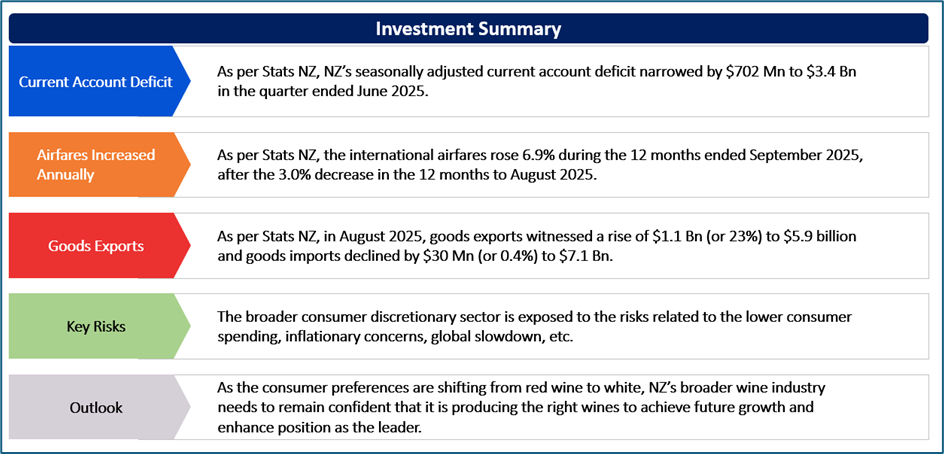
As per Stats NZ, NZ’s seasonally adjusted current account deficit narrowed by $702 Mn to $3.4 Bn in the quarter ended June 2025. This was the smallest deficit since $3.1 Bn deficit in the June 2021 quarter. The smaller current account deficit was because of a $1.0 Bn narrowing of the primary income deficit. The seasonally adjusted goods deficit widened to $128 Mn in the quarter ended June 2025, after the deficit of $126 Mn in the March 2025 quarter.
Notably, the goods exports declined $896 Mn in the June 2025 quarter to $19.8 Bn, led by declines in dairy, fruit, and meat. Also, goods imports fell $895 Mn to $19.9 Bn, led by falls in fuel and mechanical machinery and equipment.
Exhibit 1: Annual Current Account Balance to GDP Ratio (%), Year Ended in Quarter, June 2024 – June 2025
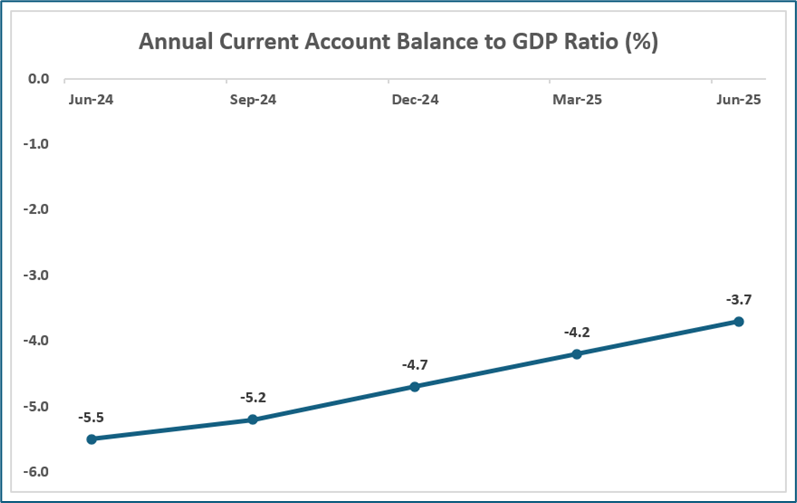
Data Source: This work is based on/includes Stats NZ’s data which are licensed by Stats NZ for reuse under the Creative Commons Attribution 4.0 International Licence; Chart Created by Kalkine Group
Airfares Increased Annually
As per Stats NZ, the international airfares rose 6.9% during the 12 months ended September 2025, after the 3.0% decrease in the 12 months to August 2025. Similarly, the domestic airfares also rose by 2.1% for the same period. The increases for both domestic and international airfares demonstrates that travellers experienced increased prices during the school holidays. Notably, the food prices declined in September 2025 by 0.4% as compared to August 2025. Vegetables and chocolate contributed the most to this decline.
Exhibit 2: International Airfares (Annual % Change) (Jan 2025 – Sept 2025)
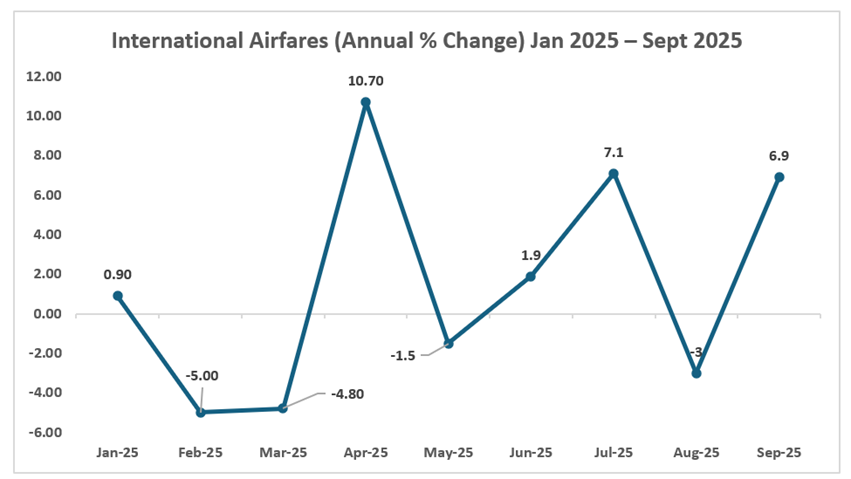
Data Source: This work is based on/includes Stats NZ’s data which are licensed by Stats NZ for reuse under the Creative Commons Attribution 4.0 International Licence; Chart Created by Kalkine Group
Goods Exports Increased $1.1 Billion
In August 2025, goods exports witnessed a rise of $1.1 Bn (or 23%) to $5.9 billion and goods imports declined by $30 Mn (or 0.4%) to $7.1 Bn. The monthly trade balance was deficit of $1.2 Bn. The fruit exports increased $330 Mn (or 57%) to $905 Mn. This was led by kiwifruit, which was up by $301 Mn (or 64%) to $772 Mn.
Notably, for August 2025 year, the annual goods exports were valued at $77.8 Bn, up by $8.7 Bn from the previous year.
Key Risks and Challenges:
RBNZ, in the release dated 08 October 2025, stated that the economic growth in NZ’s trading partners is proving resilient, partly due to the robust investment in AI-related activity, but is projected to slow in 2026. Notably, the cautious behaviour by households and businesses might slow the economic recovery, reducing the medium-term inflation pressure. Overall, the broader consumer discretionary sector is exposed to the risks related to the lower consumer spending, inflationary concerns, global slowdown, etc.
Exhibit 3. Key Risks in Consumer Discretionary Sector:
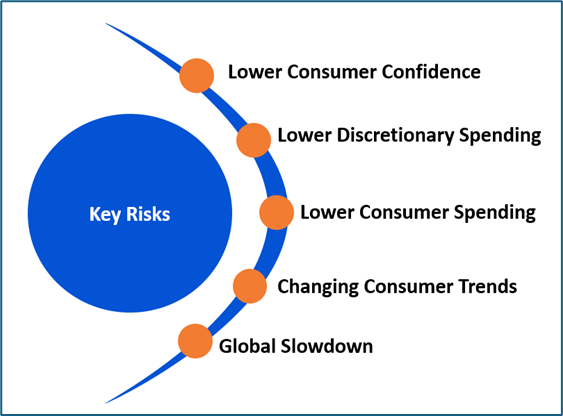
Source: Analysis by Kalkine Group
Outlook:
As per Situation and Outlook for Primary Industries (June 2025), on the global front, the broader industry is witnessing short-term uncertainty because of rapidly evolving global trade policies. However, New Zealand wine demonstrated robust growth in the second-tier markets. NZ is also well placed in the medium to long term as consumer preferences continue to transition towards the white wine. The wine producers are moving towards exporting bulk wine and bottling in-market to decrease the transport costs and the carbon footprint of each shipment. As per SOPI, the wine export revenue is expected to remain similar in 2026, increasing by 1% to $2.1 Bn, while export volumes are expected to grow 2% to 290 Mn litres.
The US is NZ wine’s largest market, reflecting $763 Mn in export revenue in the year ended 31 March 2025, representing 37% of all the wine exports. As per the report, as the consumer preferences are shifting from red wine to white, NZ’s broader wine industry needs to remain confident that it is producing the right wines to achieve future growth and enhance position as the leader.
Apart from the sector-specific factors, an analysis on 2 NZX-listed companies is provided. This report covers their insights, outlook, performance and potential as expected to be delivered in the near to medium term.
1) Foley Wines Limited (Recommendation: Speculative Buy, Potential Upside: Low Double-Digit) (M-Cap: NZD 39.4 Mn)
Business Description:
Foley Wines Limited (NZX: FWL) is an integrated wine company producing table wines with the marketing and sales of premium wines in New Zealand and various export markets.
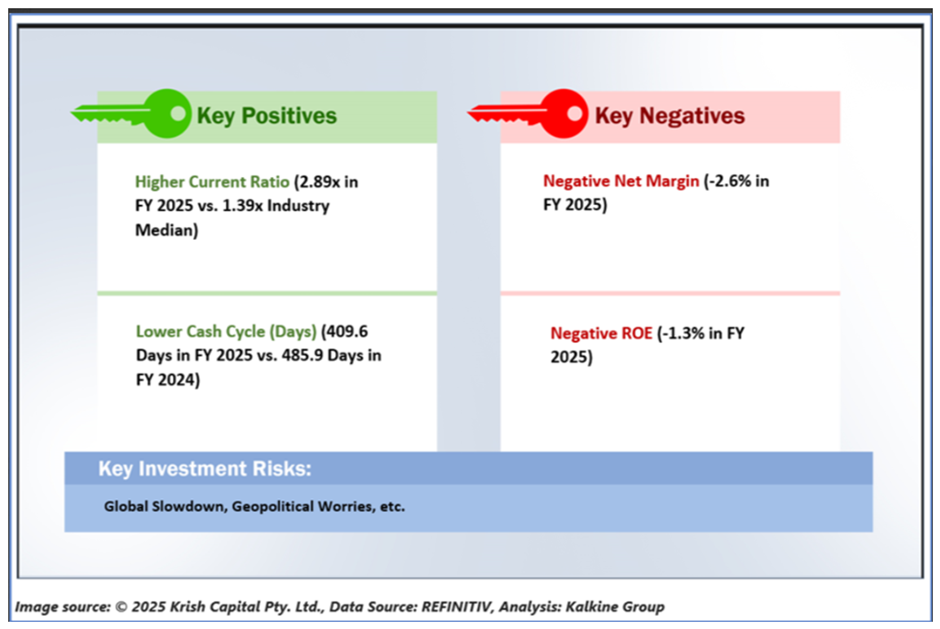
Outlook:
FWL remains in a good position to sell through the 2025 vintage in a timely manner. Also, with the normal vintage in 2026, and improved market conditions, FWL would be in a much-improved position for the future. The capex for the year ahead is expected at ~$4.5 Mn which is in line with the average of the previous 2 years, and less than the company’s depreciation expense.
Technical Overview:
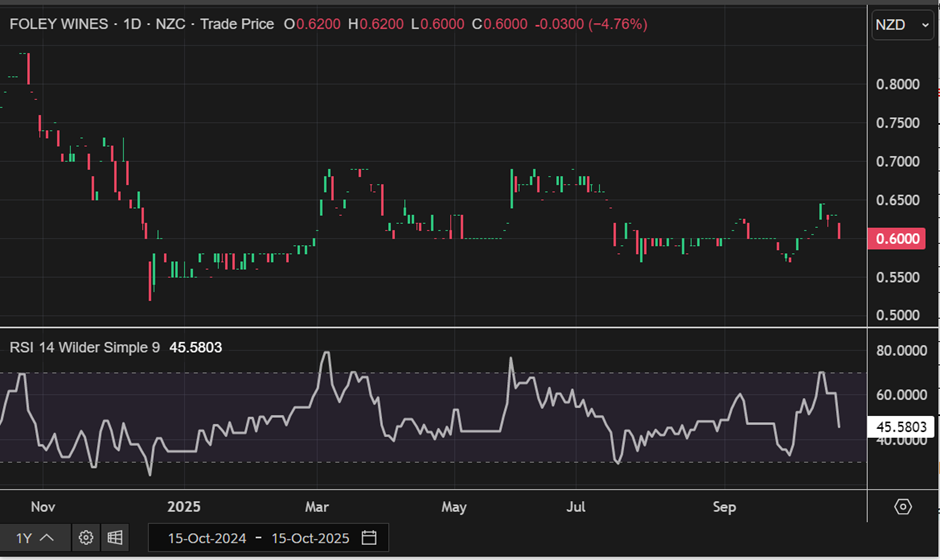
FWL Daily Technical Chart, Data Source: REFINITIV
Technical Commentary
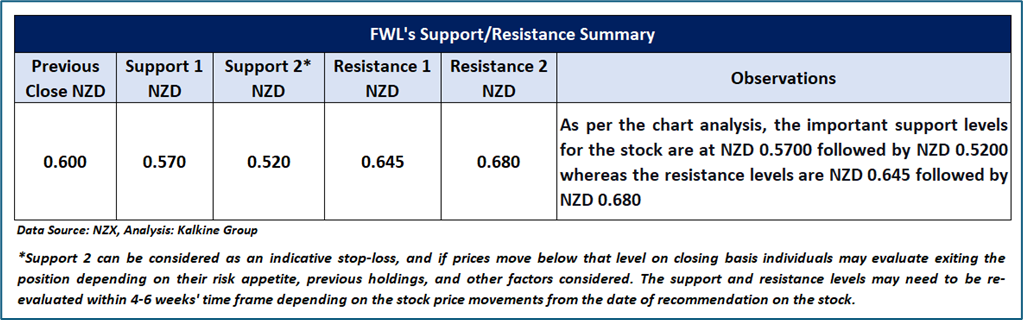
On the daily chart, FWL’s stock price is forming a trading range characterized by a symmetrical triangle pattern, indicating that the current sideways trend may continue in the near term. Moreover, the 14-period RSI is hovering around the midpoint, which further supports this outlook. The stock is trading between its recent high and low, which may act as resistance and support levels, respectively. A key support level is located at NZD 0.570, while a critical resistance level is positioned at NZD 0.645.
Stock Recommendation
The stock price as on the close of 15th October 2025 was NZD 0.60 per share. The stock did not trade on 16th October 2025. Considering the facts above, a ‘Speculative Buy’ recommendation on the stock has been provided at the closing market price of NZD 0.60 per share as on 15th October 2025.
2) Delegat Group Limited (Recommendation: Buy, Potential Upside: Low Double-Digit) (M-Cap: NZD 424.7 Mn, Annual Dividend Yield: 6.61%)
Business Description:
Delegat Group Limited is a New Zealand-based wine company.
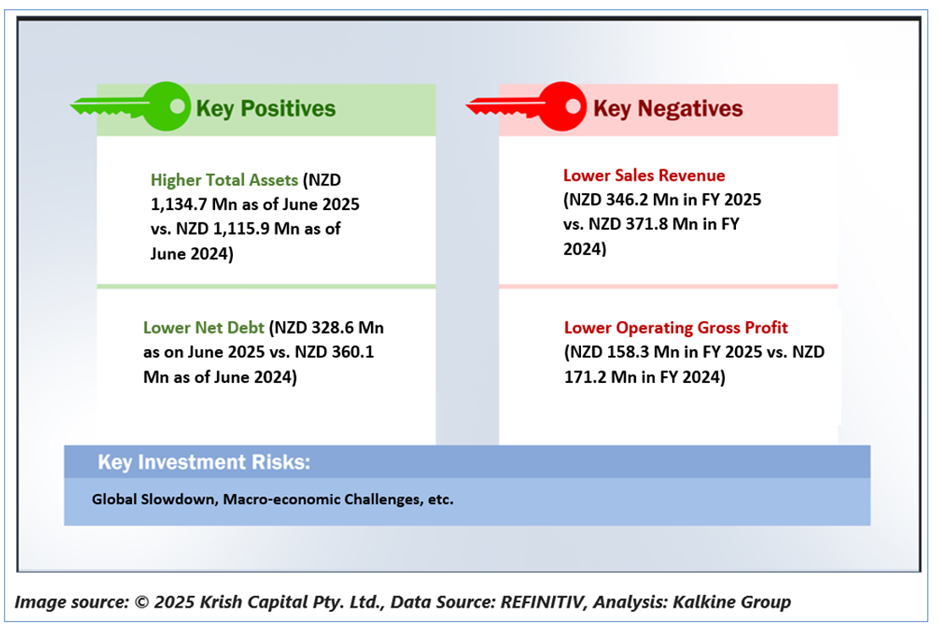
Outlook:
DGL’s focus is towards wine category premiumisation as well as value growth, aligning to the long-term trend of the Super Premium wine consumption. The strengths of category-leading Super Premium brands, in-market sales teams, distribution networks as well as robust consumer demand offered the necessary resilience in the challenging times and healthy foundation which places the company well for the future sales growth.
Technical Overview:
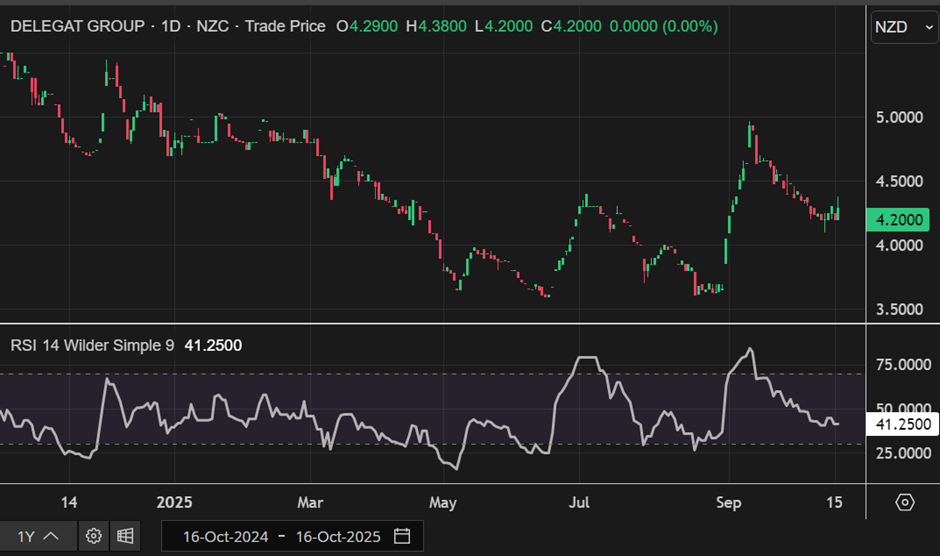
DGL Daily Technical Chart, Data Source: REFINITIV
Technical Commentary
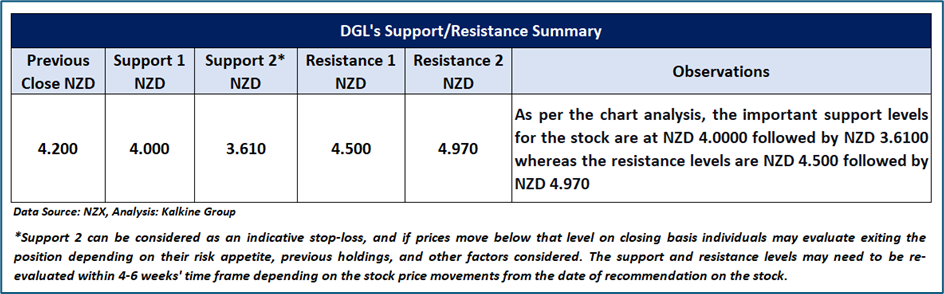
On the daily chart, DGL’s stock price is developing a trading range characterized by identical troughs and higher peak, suggesting that the current sideways period in the stock might remain intact in the near future. Additionally, the 14-period RSI is trading near its midpoint, providing more evidence to the previous observation. Price is trading between its previous peak and trough, which might function as resistance and support levels for the stock, respectively. A significant support level for the stock is positioned at NZD 4.00, while critical resistance level is located at NZD 4.50.
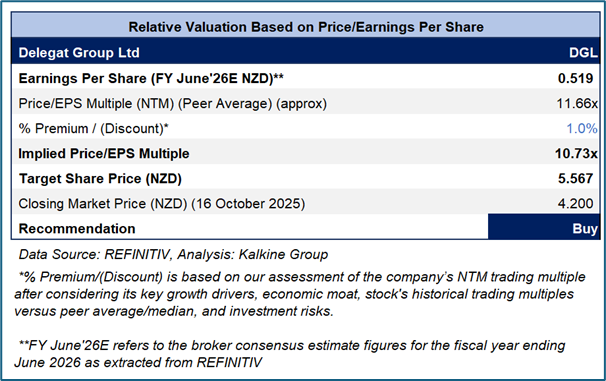
Fundamental Valuation
Stock Recommendation
Considering the facts above, a ‘Buy’ recommendation on the stock has been provided at the closing market price of NZD 4.20 per share as on 16 October 2025
Markets are trading in a highly volatile zone currently due to certain macro-economic issues and geopolitical tensions prevailing. Therefore, it is prudent to follow a cautious approach while investing.
Note 1: Past performance is not a reliable indicator of future performance.
Note 2: The reference data in this report has been partly sourced from REFINITIV.
Note 3: Investment decisions should be made depending on an individual's appetite for upside potential, risks, holding duration, and any previous holdings. An 'Exit' from the stock can be considered if the Target Price mentioned as per the Valuation and or the technical levels provided has been achieved and is subject to the factors discussed above.
Note 4: Annual Dividend Yield is on a Trailing Twelve Month (TTM1) basis and are subject to change based on factors such as company performance, stock price changes, etc.
Note 5: Kalkine reports are prepared based on the stock prices captured either from REFINITIV or Trading View. Typically, REFINITIV or Trading View may reflect stock prices with a delay which could be a lag of 25-30 minutes. There can be no assurance that future results or events will be consistent with the information provided in the report. The information is subject to change without any prior notice.
Technical Indicators Defined: -
Support: A level at which the stock prices tend to find support if they are falling, and a downtrend may take a pause backed by demand or buying interest. Support 1 refers to the nearby support level for the stock and if the price breaches the level, then Support 2 may act as the crucial support level for the stock.
Resistance: A level at which the stock prices tend to find resistance when they are rising, and an uptrend may take a pause due to profit booking or selling interest. Resistance 1 refers to the nearby resistance level for the stock and if the price surpasses the level, then Resistance 2 may act as the crucial resistance level for the stock.
Stop-loss: It is a level to protect further losses in case of unfavourable movement in the stock prices.
This report (“Report”) has been issued by Kalkine New Zealand Limited (FSP691351) (NZBN:9429047678101) (“Kalkine”). Kalkine is a Financial Advice Provider (“FAP”) and is authorised by a Class 1 Financial Advice Provider Licence issued by Financial Markets Authority (“FMA”) to provide financial advice. Kalkine provides only general financial advice through its research reports following a person becoming a member. The reports contain buy/sell/hold and other recommendations in relation to equity securities, managed funds and other managed investment schemes and other financial advice products. The recommendations and opinions in this Report and on Kalkine website do not take into account any of your investment objectives, financial situation or needs. Before you make a decision about whether to acquire a financial product, you should obtain the Product Disclosure Statement from the product issuer. You should consider the appropriateness of advice taking into account your own objectives, financial situation and needs and seek independent financial advice before making any financial decisions. If you act on the advice in the research reports, you may have to pay fees, expenses or other amounts (but not to Kalkine).
The information in this Report and on the Kalkine website has been prepared from a wide variety of sources, which Kalkine, to the best of its knowledge and belief, considers accurate. Kalkine has made every effort to ensure the reliability of the information contained in its reports (including this Report), newsletters and websites. All information represents our views at the date of publication and may change without notice.
Kalkine does not issue, sell or deal in any financial products. The information in this Report does not constitute an offer to sell securities or other financial products or a solicitation of an offer to buy securities or other financial products. Our reports contain general recommendations to invest in securities and other financial products. Kalkine is not responsible for, and does not guarantee, the performance of, or returns on, any investments mentioned in this Report.
This Report may contain information on past performance of particular investments. Past performance is not a reliable indicator of future performance. Returns stated do not take into account transaction costs and taxes.
Further information about the complaints and dispute resolution process, as well as information about Kalkine’s duties are available on Kalkine’s website. Please read our Financial Advice Provider (FAP) disclosure statement and Complaints Handling Guide, which are available on the website.
Copyright 2025 Krish Capital Pty. Ltd. (ABN 61629651510). All Rights Reserved. No part of this Report, or its content, may be reproduced in any form without our prior consent.
Past performance is not a reliable indicator of future performance.
 Please wait processing your request...