
Company Overview: Manawa Energy Limited (NZX: MNW) is one of Aotearoa NZ’s largest independent renewable electricity generators. Vital Limited (NZX: VTL) is a New Zealand-based company which provides fundamental nationwide infrastructure and communication services. Kalkine’s Sector Report covers the Investment Highlights, Key Financial Metrics, Risks, Technical Analysis along with the Valuation, Target Price, and Recommendation on the stock.
I. Sector Landscape and Outlook
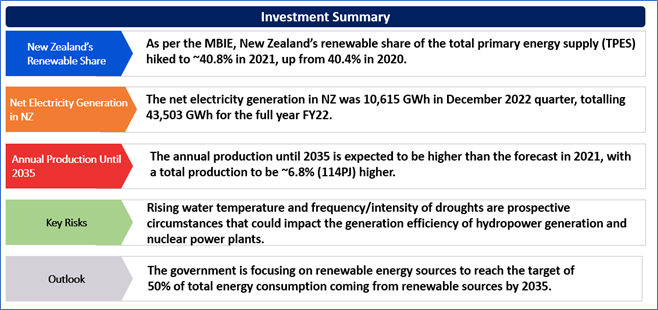
As per the Ministry of Business, Innovation and Employment (MBIE), New Zealand’s renewable share of the total primary energy supply (TPES) hiked to ~40.8% in 2021, up from 40.4% in 2020. Moreover, national energy consumption increased by 0.7% compared to 2020 but was still down 6.6% compared to 2019. The greatest increase in 2021 was in the transport sector.
The net electricity generation in NZ was 10,615 GWh in December 2022 quarter, totalling 43,503 GWh for the full year FY22. Where hydro generation increased by ~9.1% Y-o-Y, geothermal generation declined by ~5.2% on a pcp basis. Wind turbines generated 2,616 GWh in 2021, up from 2,282 GWh in 2020, which is the highest generation on record. On the consumption side, where Industrial usage declined by ~3.0%, electricity consumed for commercial purposes and transport increased by ~8.5% and ~16.1%, respectively.
NZ is utilizing the system of emissions budgets to determine the pathway for 2050 targets of net zero long-lived greenhouse gas emissions and a fall in biogenic methane emissions. NZ is committed to a target of 50% of total final energy consumption to come from renewable sources by 2035.
Trend of Variety of Fuel Prices
As of 1 January 2022, New Zealand had 59 Mn barrels of crude oil remaining and Natural gas production fell 13% in 2021 mainly due to Pohokura’s production falling due to outages. It was at its lowest annual level since 2006, the first time of production. Overall, natural gas consumption fell by 11% in 2021, majorly in the chemical manufacturing sector. The annual production until 2035 is expected to be higher than the forecast in 2021, with a total production to be ~6.8% (114PJ) higher. After 2035, the levels are expected to be lower overall, with a total production to be ~9.4% (32PJ) lower than the 2021 production profile, between 2036 and 2055.
NZ consumed sufficient petrol to fill 1,160 Olympic-sized swimming pools in 2021. Over the period of 2021, premium petrol prices hiked ~20%, regular petrol increased ~24%, and diesel increased 42%. International crude oil prices were at historic lows in 2020. The rise in crude oil prices in 2021 increased the cost of imports and, therefore, the fuel prices.
Exhibit 1: Real Annual Average Fuel Prices (NZ cents per unit)
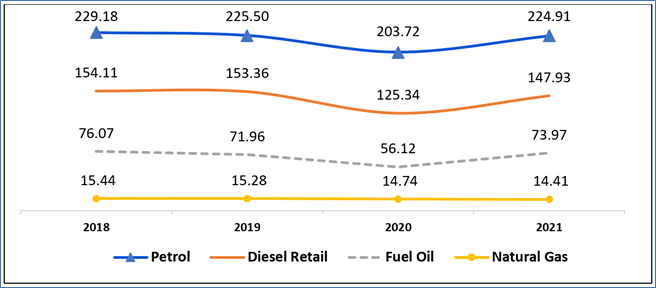
Data Source: This work is owned by the Ministry of Business, Innovation and Employment on behalf of the Crown which are licensed for reuse under the Creative Commons Attribution 4.0 International Licence; Chart Created by Kalkine Group
New Zealand’s Renewable Energy Electricity Generation Contribution
As per MBIE, NZ’s highest share of primary sources of energy comes from renewable sources, as showed by 40.7% in 2021, which was materially higher than the average of the Organisation for Economic Co-operation and Development (OECD) of ~11%. The most significant contributors are hydro and geothermal resources. However, in the calendar year 2021, two large new wind farms were constructed at Waipipi and Turitea, and the first full year of the expansion to the Ngāwhā geothermal power plant contributed to electricity generation and had their highest level on record.
For the December quarter, out of net generation of electricity of 10,615 GWh, Hydro constituted the maximum of 7,157 GWh, followed by 1,903 GWh from Geothermal. The renewable share % was 94.7% for December quarter as compared to 89.6% for the September quarter of 2022.
Exhibit 2: Annual Trend of Major Net Energy Generation Contributors
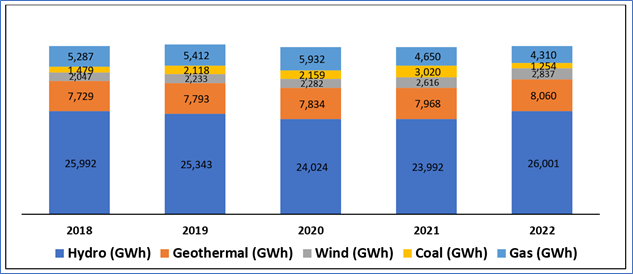
Data Source: This work is owned by the Ministry of Business, Innovation and Employment on behalf of the Crown which are licensed for reuse under the Creative Commons Attribution 4.0 International Licence; Chart Created by Kalkine Group
Index Performance:
The S&P/NZX All Utilities (Sector) Index generated a 1-year return of ~15.93% versus ~7.04% by the S&P/NZX 50 Index. Therefore, NZX All Utilities Index overperformed NZX50 Index by ~8.89% in 1 year.
Exhibit 3: S&P/NZX All Utilities (Sector) vs S&P/NZX50 Index
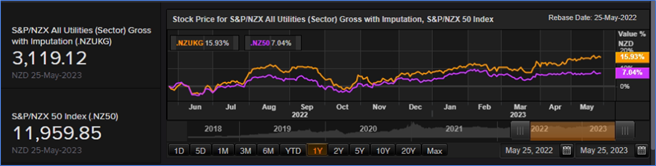
Source: REFINITIV
Key Risks and Challenges:
The government and private players are working together to support low-carbon electricity systems, a complex collaboration of multiple technologies with strategic functions to maximize output. Further, the uncertainty over the availability of raw materials used in renewable electricity generation implies an option value associated with the choice between future non-fossil-fuel generation and fossil-fuel technologies. In line with this, the power sector is also susceptible to drastic changes in the climate suitable for energy generation. Rising water temperature, air temperature, and frequency/intensity of droughts are prospective circumstances that could impact the generation efficiency of hydropower generation and nuclear power plants.
New Zealand’s energy production arises from both renewable and non-renewable sources. The country imports and exports fossil fuels which generate export revenue, but it also makes the country dependent and vulnerable to energy commodity prices. These prices fluctuate according to the international supply and demand factors worldwide which is not in New Zealand’s control.
Exhibit 4. Key Risks in Utilities Sector:
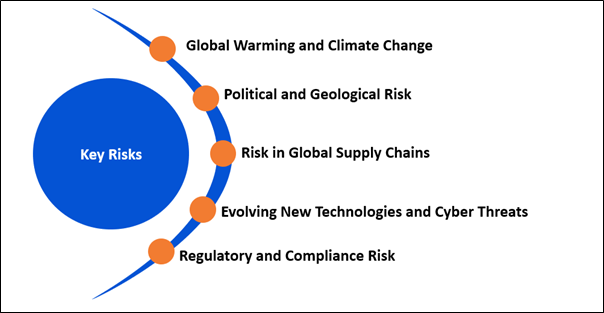
Source:- Analysis: Kalkine Group
Outlook:
During 2021, New Zealand imported more energy products than it exported, making New Zealand a net importer of energy. National energy intensity (energy use divided by gross domestic product (GDP), which tells the amount of energy required to produce each dollar of GDP) has improved by an average of ~1.5% per annum between 1990 and 2019. Being the current contribution by solar energy towards energy supply low, it is expected to rise in future. Christchurch Airport committed 400 hectares to the construction of the Kōwhai Park energy hub, including 220 hectares set aside for a 150-megawatt solar array. This would be the largest single solar farm in the country, whose first generation is expected in 2025.
The government is focusing on renewable energy sources to reach the target of 50% of total energy consumption coming from renewable sources by 2035. Growing NZ’s hydrogen industry can support NZ in achieving its commitments to reduce net emissions of all greenhouse gases (except biogenic methane) to zero by the year 2050 and has the potential to help the government’s goal of touching 100% renewable electricity by the year 2030. Moreover, apart from investment in renewable generation and hydrogen production plants, the country expects to invest in having 24 high-capacity refuelling stations across the country in the next 4 to 5 years. On the other hand, natural gas use is also expected to decline over time, and its production is also expected to decline after 2024 as New Zealand natural gas fields enter end-of-life.
Apart from the sector-specific factors, an analysis on two NZX-listed companies is provided. This report covers their insights, outlook, performance and potential as expected to be delivered in the near to medium term.
1) Manawa Energy Limited (Recommendation: Buy, Potential Upside: Low Double-Digit) (M-Cap: NZD 1.490 billion, Annual Dividend Yield (TTM)1: 14.270%)
Business Description:
Manawa Energy Limited (NZX: MNW) is one of Aotearoa NZ’s largest independent renewable electricity generators.
Outlook:
MNW, for FY24, expects its EBITDAF to be around the top end of NZD 120-140.0 Mn, underpinned by the assumptions of its generation volumes to be approximately 1,915 gigawatt hours and NZD 8mn operational expenditure related to the new generation development pipeline. The capital expenditure guidance comes as NZD 65-80mn, comprising NZD 22-28mn for asset maintenance and lifecycle expenditure. Moreover, the company also expects to receive NZD 20 Mn-28 Mn of cash proceeds in FY24 from the divestment of surplus land and carbon credits.
Technical Overview:
Daily Price Chart
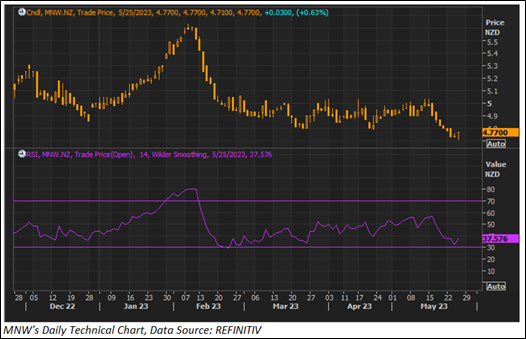
Technical Commentary:
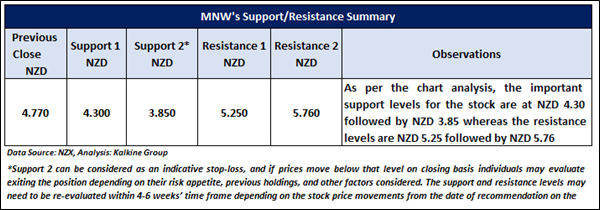
On the daily chart, MNW prices are trading above the downward sloping trendline support level and taking support from the trendline. Moreover, the momentum oscillator RSI (14-period) is showing a reading of ~37.576 level. However, the prices are trading below the trend-following indicators 21-period SMA, which may act as a resistance zone. An important support level for the stock is placed at NZD 4.300 while the key resistance level is placed at NZD 5.250.
Fundamental Valuation:
P/E Based Relative Valuation
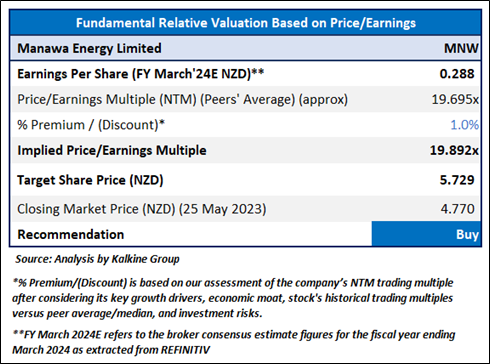
Stock Recommendation
Considering the facts above, a ‘Buy’ recommendation on the stock has been provided at the closing market price of NZD 4.770 per share, up by 0.630% as of 25 May 2023.
2) Vital Limited (Recommendation: Speculative Buy, Potential Upside: Low Double-Digit) (M-Cap: NZD 8.72 million)
Business Description:
Vital Limited (NZX: VTL) is a New Zealand-based company which provides fundamental nationwide infrastructure and communication services. It operates through three segments: Wireless Networks, Wired Networks and Others and caters sectors such as government, civil defence, emergency services, health, utilities, public transport, education, logistics & freight, agriculture, and channel partners.
Outlook:
With a modest recovery, the company re-affirmed the guidance and anticipates revenue and EBITDA (adjusted) to be in between NZD 27.5-28.5mn and NZD 5.8-6.5mn, respectively for FY23. And, for FY24, the revenue and EBITDA (adjusted) is anticipated to be in between NZD 28.0-29.0mn and NZD 6.6-7.1mn, respectively. Also, the reset strategies of VTL represent a planned path to return to positive free cash flow, with an initial focus on debt reduction.
Technical Overview:
Daily Price Chart
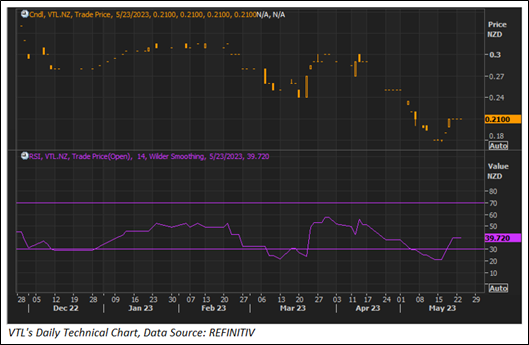
Technical Commentary
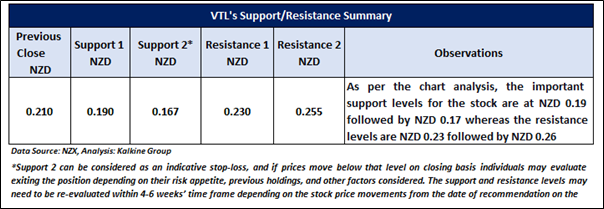
On the daily chart, VTL prices are trading above the horizontal trendline support level. Moreover, the momentum oscillator RSI (14-period) is showing a reading of ~39.72 level. However, the prices are trading below the trend-following indicators 21-period SMA, which may act as a resistance zone. An important support level for the stock is placed at NZD 0.190 while the key resistance level is placed at NZD 0.255.
Stock Recommendation
On a TTM basis, the stock of VTL is trading at an EV/Sales multiple of 1.7x compared to the industry (Telecommunications Services) median of 2.2x, and thus seems undervalued. The company seems to be optimistic about its turnaround metrics and is focused towards achieving an appropriate rate of return on its infrastructure asset base.
Considering the facts above and undervaluation as indicated by the TTM valuation, a ‘Speculative Buy’ recommendation on the stock has been provided at the closing market price of NZD 0.210 per share as of 23 May 2023.
Markets are trading in a highly volatile zone currently due to certain macro-economic issues and geopolitical tensions prevailing. Therefore, it is prudent to follow a cautious approach while investing.
Note 1: Past performance is neither an indicator nor a guarantee of future performance.
Note 2: The reference data in this report has been partly sourced from REFINITIV.
Note 3: Investment decisions should be made depending on an individual's appetite for upside potential, risks, holding duration, and any previous holdings. An 'Exit' from the stock can be considered if the Target Price mentioned as per the Valuation and or the technical levels provided has been achieved and is subject to the factors discussed above.
Note 4: Annual Dividend Yield is on a Trailing Twelve Month (TTM1) basis and are subject to change based on factors such as company performance, stock price changes, etc.
Technical Indicators Defined: -
Support: A level at which the stock prices tend to find support if they are falling, and a downtrend may take a pause backed by demand or buying interest. Support 1 refers to the nearby support level for the stock and if the price breaches the level, then Support 2 may act as the crucial support level for the stock.
Resistance: A level at which the stock prices tend to find resistance when they are rising, and an uptrend may take a pause due to profit booking or selling interest. Resistance 1 refers to the nearby resistance level for the stock and if the price surpasses the level, then Resistance 2 may act as the crucial resistance level for the stock.
Stop-loss: It is a level to protect further losses in case of unfavourable movement in the stock prices.
PJ: Petajoules
Disclaimer
Kalkine New Zealand Limited is a Financial Advice Provider (“FAP”) and is authorised by a Class 1 Financial Advice Provider Licence issued by Financial Markets Authority (“FMA”) to provide financial advice. Kalkine provides only general financial advice through its research reports following a person becoming a member. The reports contain buy/sell/hold and other recommendations in relation to equity financial products. The recommendations and opinions [on this website] / [in this report] do not take into account any of your investment objectives, financial situation or needs. Before you make a decision about whether to acquire a financial product, you should obtain the Product Disclosure Statement from the product issuer. You should consider the appropriateness of advice taking into account your own objectives, financial situation and needs and seek independent financial advice before making any financial decisions. If you act on the advice in the research reports, you may have to pay fees, expenses or other amounts (but not to Kalkine). Further information about the complaints and dispute resolution process, as well as information about Kalkine’s duties are available on Kalkine’s website. Please read our Financial Advice Provider (FAP) disclosure statement and Complaints Handling Guide, which are available on the website.
Past performance is not a reliable indicator of future performance.
 Please wait processing your request...