
1. Sector Landscape and Outlook
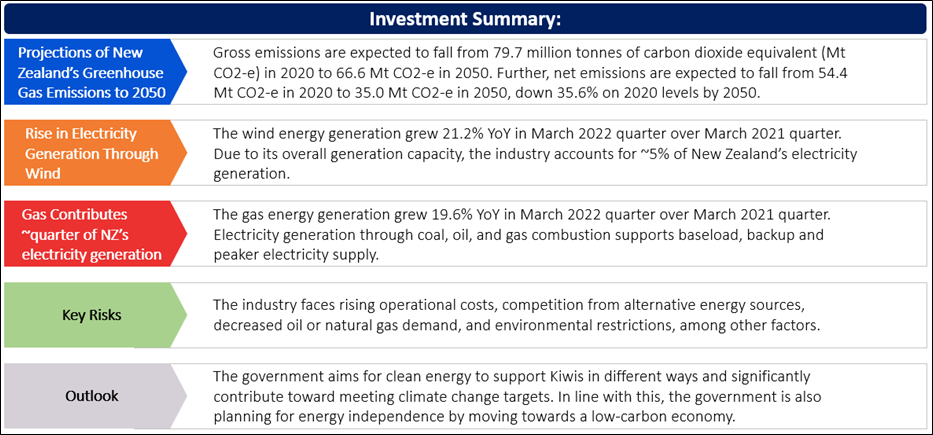
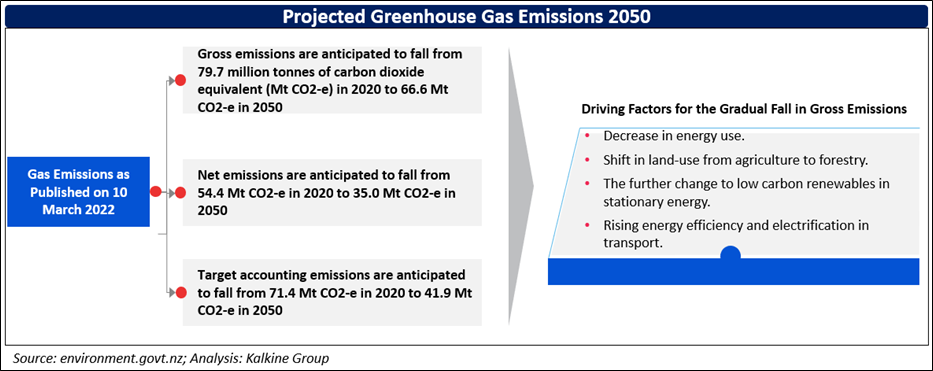
As per the Ministry of Business, Innovation and Employment (MBIE), the net generation increased to 10,227 GWh in March 2022 quarter from 10,212 GWh in March 2021 quarter, up 0.1% YoY. This rise was driven by the increase in Wind energy, which stood at 625 GWh (up 21.2% YoY) and gas energy, which stood at 1,301 GWh (up 19.8% YoY) for the same period. This growth in a net generation was also supported by the increase in solar energy (up 10.1% YoY) and hydro energy (up 5.3% YoY). However, oil contribution towards net generation fell significantly (down 67.6% YoY), followed by coal (down 57.0% YoY). As per the Ministry for the Environment, the Climate Change Response Act (CCRA) targets (i) net-zero emissions of all GHG other than biogenic methane by 2050 and (ii) a 24-47% reduction below 2017 biogenic methane emissions by 2050.
Rise in Electricity Generation Through Wind
As per MBIE, wind energy generation increased 21.2% YoY in March 2022 quarter over March 2021 quarter. Due to its widespread generation capacity, the industry accounts for ~5% of New Zealand’s electricity generation. Most of New Zealand’s wind farms are positioned on the North Island; the largest among them are Tararua Wind Farm and West Wind Makara.
Exhibit 1: Trend in Wind Energy Generation in New Zealand Since March 2018 Quarter
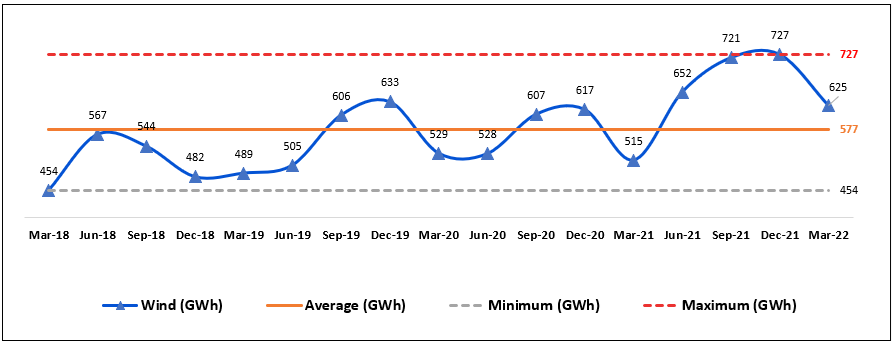
Data Source: This work is owned by the Ministry of Business, Innovation and Employment on behalf of the Crown which are licensed for reuse under the Creative Commons Attribution 4.0 International Licence; Chart Created by Kalkine Group
Gas Contributes Roughly a quarter of New Zealand’s electricity generation
As per MBIE, the gas energy generation grew 19.6% YoY in March 2022 quarter over March 2021 quarter. Electricity generation through coal, oil, and gas combustion supports baseload, backup and peaker electricity supply. Generation from these fuels is approximately a quarter of New Zealand’s electricity generation. Most of New Zealand’s thermal plants are located on the North Island, near domestic coal, oil, and gas resources.
Exhibit 2: Main Energy Contributors in New Zealand Since March 2018 Quarter
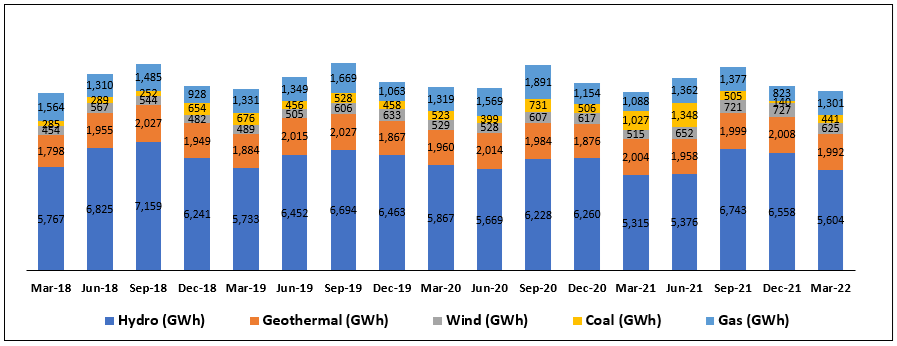
Data Source: This work is owned by the Ministry of Business, Innovation and Employment on behalf of the Crown which are licensed for reuse under the Creative Commons Attribution 4.0 International Licence; Chart Created by Kalkine Group
Higher Prices Paid by The Electricity and Gas Supply
As per Stats.NZ, the quarter prices received by producers of goods and services (outputs) grew 2.4% in the June 2022 quarter versus the March 2022 quarter, and prices paid by producers of goods and services (inputs) increased 3.1% over the same period. Higher prices received by the building construction (up 4.2%), electricity and gas supply (up 6.4%), and construction services (up 3.0%) industries were the most significant contributors to the increase in prices received by producers. Higher prices paid by the electricity and gas supply (up 9.4%), building construction (up 4.2%), and construction services (up 3.9%) industries were the most significant contributors to the increase in prices paid by producers.
Exhibit 3: Producers Price Indexes, Quarterly Percent Change, March 2018–June 2022 Quarters
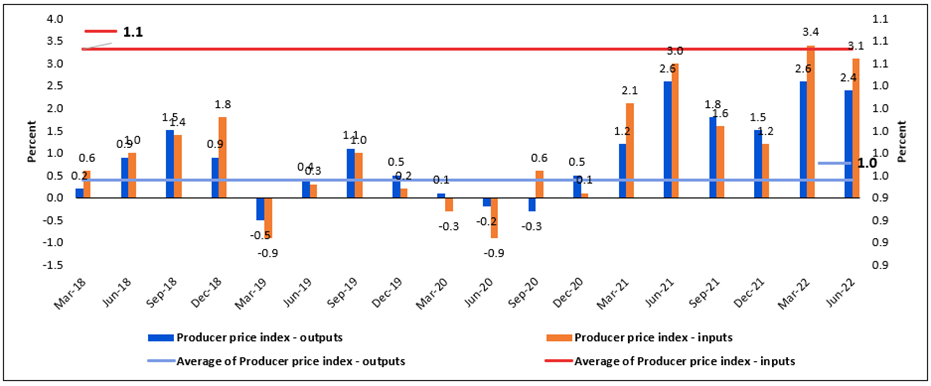
Data Source: This work is based on/includes Stats NZ’s data which are licensed by Stats NZ for reuse under the Creative Commons Attribution 4.0 International Licence; table Created by Kalkine Group
Index Performance:
The S&P/NZX All Energy (Sector) Index generated a 2-year return of ~79.48% versus ~-3.05% by the S&P/NZX 50 Index. Therefore, NZX All Energy Index overperformed NZX50 Index by ~82.53% in 2-year.
Exhibit 4: S&P/NZX All Energy (Sector) vs S&P/NZX50 Index
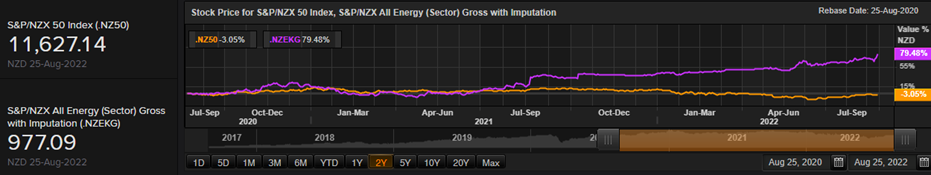
Source: REFINITIV
Key Risks and Challenges:
The government and private players have joined hands to support low-carbon electricity systems that are a very complex collaboration of multiple technologies with strategic functions to maximize reliable supply. Further, the uncertainty over the availability of raw materials used in generating electricity implies an option value associated with the choice between future non-fossil-fuel generation and fossil fuel technologies. In line with this, the power sector is also susceptible to the drastic change in the climate suitable for energy generation like rising water temperature, air temperature, and frequency/intensity of droughts are prospective circumstances that could impact the generation efficiency of hydropower generation and nuclear power plants.
Exhibit 5. Key Risks in Utilities Sector:
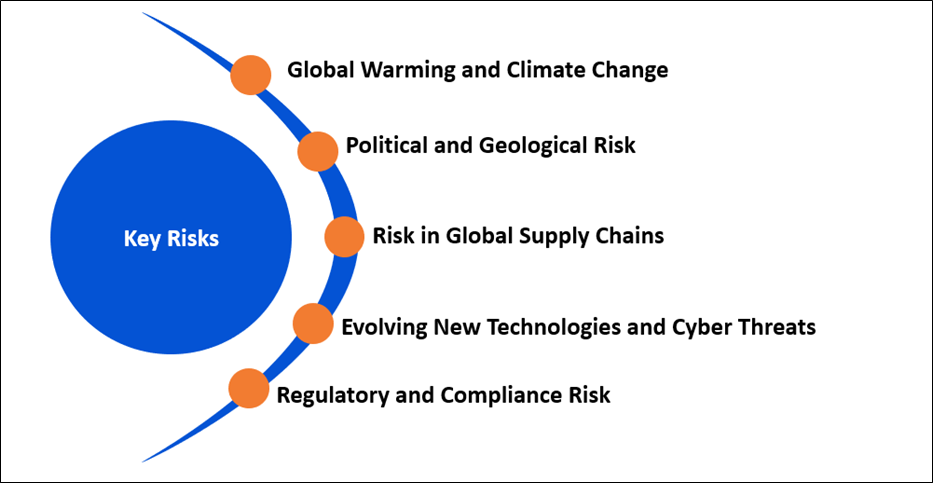
Source:- Analysis: Kalkine Group
Outlook:
Budget 2022 offers $678 million towards the Government Investment in Decarbonising Industry Fund (GIDI). Also, the budget has parked $764 million towards the ‘Energy and Industry sector’, primarily for industrial decarbonization push and efforts to support the broader energy transition, a way towards the direction of energy independence. This includes supporting businesses to shift to cleaner energy, reduce costs & emissions and take measures to strengthen the transition to a renewable electricity system.
As per ‘The Treasury’, the Reserve Bank of New Zealand (RBNZ) increased the Official Cash Rate (OCR) to 3.0% and directed that if inflation continues at an elevated level, the OCR will increase to 4.1% in the coming months. The domestic demand momentum and supply constraints continued to lift inflation high. A higher OCR will be required to ensure demand slows to desired levels to bring inflation back to target.
Apart from the sector-specific factors, we have also analysed three NZX-listed companies operating in the same sector. This report covers their insights, outlook, performance and potential as expected to be delivered in the near to medium term.
1) Manawa Energy Limited (Recommendation: Buy, Potential Upside: Low Double-Digit) (M-Cap: NZ$1.95 billion, Annual Dividend Yield (TTM)1: 7.28%)
Business Description:
Manawa Energy Limited (NZX: MNW) is Aotearoa, New Zealand’s largest independent electricity generator and renewables developer.
Outlook
The company has over 30 new solar and wind development projects under active consideration, including four solar projects in the feasibility stage. The company is projecting EBITDAF at $140-$160 million and capital expenditure between $45-$55 million for FY23.
On 25 August 2022, it announced the issued quotation notice for its issue of $150 million of unsecured, unsubordinated, fixed-rate bonds with an interest rate of 5.36%.
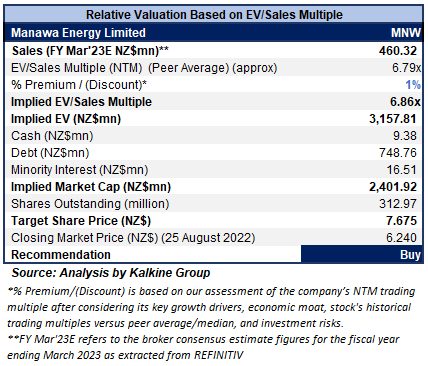
Valuation Methodology: EV/Sales Based Relative Valuation (Illustrative)
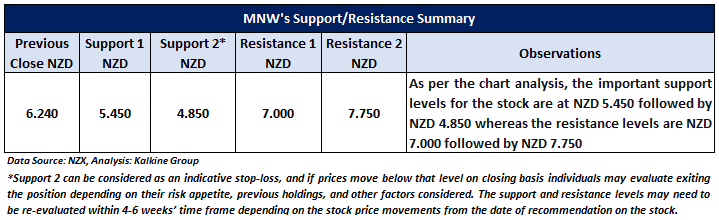
Technical Overview:
Daily Price Chart
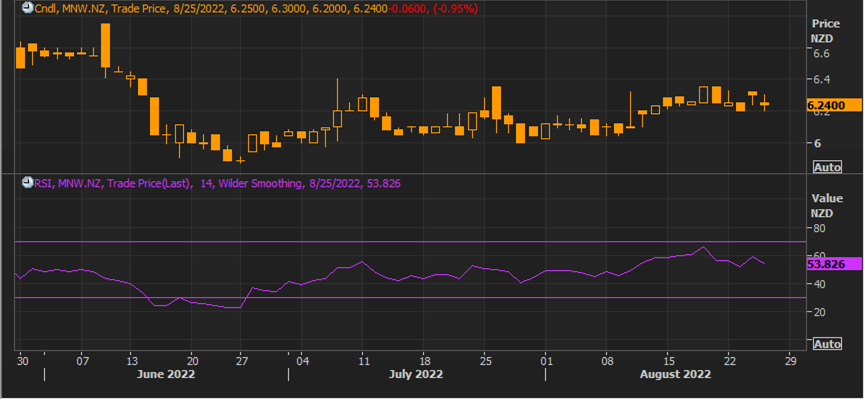
Source: REFINITIV, Note: Purple color line reflects Relative Strength Index (14-Period)
Stock Recommendation:
The stock has been valued using an EV/Sales multiple-based illustrative relative valuation, and the target price so arrived reflects a rise of low double-digit (in % terms). A slight premium has been applied to EV/Sales Multiple (NTM) (Peer Average), considering the solid financial performance in FY22 and stable outlook.
Considering the aforementioned factors, a ‘Buy’ rating on the stock has been provided at the closing market price of $6.24 per share, down 0.95% as of 25 August 2022.
2) NZ Windfarms Limited (Recommendation: Speculative Buy, Potential Upside: Low Double-Digit) (M-Cap: NZ$55.31 million, Annual Dividend Yield (TTM)1: 1.96%)
Business Description:
NZ Windfarms Limited (NZX: NWF) is engaged in the wind farm business as a specialist wind farm owner and operator.
Outlook
An unimputed Q3’FY22 dividend of $0.0020 was announced on 25 May 2022. Lower average wind speeds have extended into the 2H’FY22, disrupting generation. Based on the actual generation to 24 May 2022, the full-year generation is projected to be ~100 GWh. (FY21: 110.5 GWh). Accordingly, the board anticipates FY2022 EBITDAF towards the bottom of $6.5-$7.5 million.
Technical Overview:
Daily Price Chart
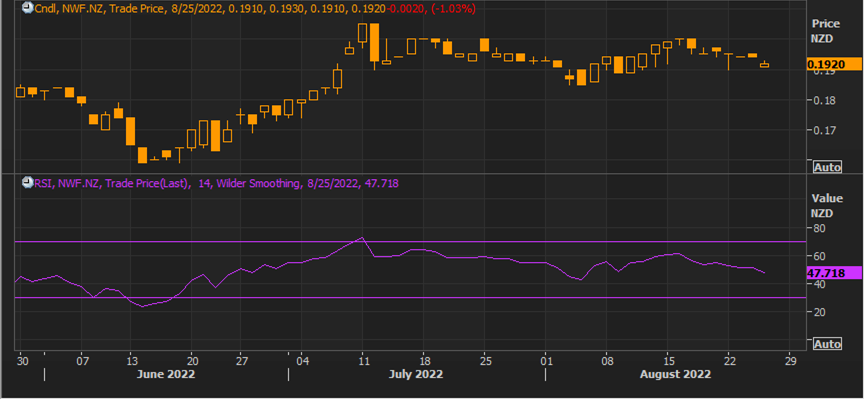
Source: REFINITIV, Note: Purple color line reflects Relative Strength Index (14-Period)
Stock Recommendation:
Considering the aforementioned factors, a ‘Speculative Buy’ rating on the stock has been provided at the closing market price of $0.192 per share, down 1.03% as of 25 August 2022.
3) Contact Energy Limited (Recommendation: Hold, Potential Upside: Low Double-Digit) (M-Cap: NZ$6.07 billion, Annual Dividend Yield (TTM)1: 5.87%)
Business Description:
Contact Energy Limited (NZX: CEN) is involved in providing electricity, natural gas, and liquefied petroleum gas (LPG), along with broadband services. The electricity is generated through thermal, hydro, and geothermal sources.
Outlook
The company is committed to leading the decarbonization of the NZ economy. The strategy is focused on boosting demand, increasing renewable development, portfolio decarbonization and enhancing customer experiences. It is seeing solid demand for renewable electricity from forward-thinking customers. Also, realizing stable progress on the 168MW (1.40TWh p.a.) Tauhara geothermal power station development would supply ~3.5% of NZ’s total electricity demand by the end of next year. In line with this, it is growing the development pipeline by securing land access rights to strengthen the development of wind projects.
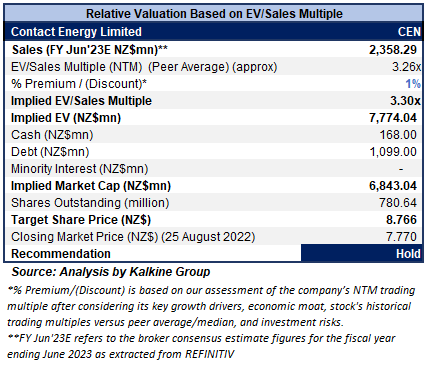
Valuation Methodology: EV/Sales Based Relative Valuation (Illustrative)
Technical Overview:
Daily Price Chart
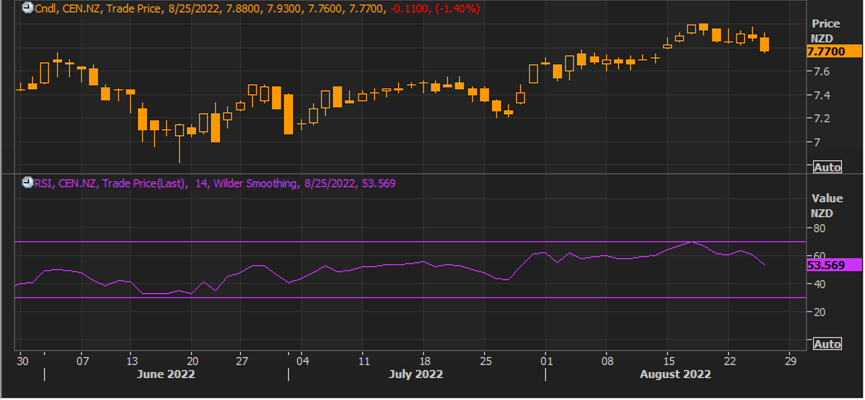
Source: REFINITIV, Note: Purple color line reflects Relative Strength Index (14-Period)
Stock Recommendation:
The stock has been valued using an EV/Sales multiple-based illustrative relative valuation, and the target price so arrived reflects a rise of low double-digit (in % terms). A slight premium has been applied to EV/Sales Multiple (NTM) (Peer Average), considering the continued growth in retail sales volumes and focus on the renewable development pipeline.
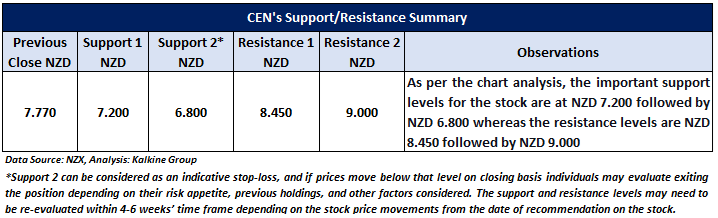
Considering the aforementioned factors, a ‘Hold’ rating on the stock has been provided at the closing market price of $7.77 per share, down 1.40% as of 25 August 2022.
Markets are trading in a highly volatile zone currently due to certain macro-economic issues and geopolitical tensions prevailing. Therefore, it is prudent to follow a cautious approach while investing.
Note 1: Past performance is not a reliable indicator of future performance.
Note 2: The reference date for all price data, currency, technical indicators, support, and resistance levels is August 25, 2022. The reference data in this report has been partly sourced from REFINITIV.
Note 3: Investment decisions should be made depending on an individual's appetite for upside potential, risks, holding duration, and any previous holdings. An 'Exit' from the stock can be considered if the Target Price mentioned as per the Valuation and or the technical levels provided has been achieved and is subject to the factors discussed above.
Note 4: Annual Dividend Yield is on a Trailing Twelve Month (TTM1) basis and are subject to change based on factors such as company performance, stock price changes, etc.
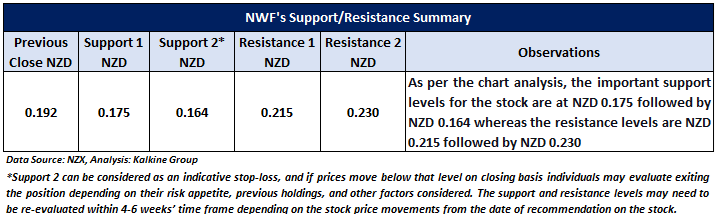
Technical Indicators Defined: -
Support: A level at which the stock prices tend to find support if they are falling, and a downtrend may take a pause backed by demand or buying interest. Support 1 refers to the nearby support level for the stock and if the price breaches the level, then Support 2 may act as the crucial support level for the stock.
Resistance: A level at which the stock prices tend to find resistance when they are rising, and an uptrend may take a pause due to profit booking or selling interest. Resistance 1 refers to the nearby resistance level for the stock and if the price surpasses the level, then Resistance 2 may act as the crucial resistance level for the stock.
Stop-loss: It is a level to protect further losses in case of unfavourable movement in the stock prices.
Disclaimer
Kalkine New Zealand Limited is authorised to provide general advice only. The information on this website does not take into account any of your investment objectives, financial situation or needs. Before you make a decision about whether to acquire a financial product, you should obtain the Product Disclosure Statement from the product issuer. You should consider the appropriateness of advice taking into account your own objectives, financial situation and needs and seek independent financial advice before making any financial decisions.
Past performance is not a reliable indicator of future performance.
 Please wait processing your request...