
.png)
I. Sector Landscape and Outlook
As per the Ministry of Transport, New Zealand’s largest container ports comprised of Ports of Auckland, Port of Tauranga, Port of Napier, Port Nelson, CentrePort, Lyttelton Port Company, PrimePort Timaru, Port Otago, and South Port. Of these, Port of Auckland’s container throughput fell to 818,238 TEU (Twenty-foot Equivalent Units) in FY21 over 880,781 TEU in FY20. Further, Car and light commercial vehicle throughput increased to 236,260 units in FY21, over 216,356 units in FY20. Meanwhile, Napier Port’s total container trade fell 1.1% to 268,000 TEU in FY20, while bulk cargo volumes decreased 8.3% to 3.1 million tonnes in FY20.
The country has made $4.60 billion of total expenditure on land transport in FY19, where 57% of rail freight is bulk commodities in FY19. Further, the country has 30,839 total electric motor vehicles in the vehicle fleet, 19.70% GHG emissions were transport-related in FY19, 48.90 billion vehicle kilometres travelled in FY19, and 26.90km (in FY18) of average daily travel in New Zealand was reported by the Ministry of Transport.
Rebound in Export Resulting a Narrower Current Account Deficit to $3.0 Billion
As per Stats.NZ, the seasonally adjusted current account deficit reduced to $3.0 billion in the June 2021 quarter. The current account deficit was $2.2 billion narrower than the March 2021 quarter primarily led by the increased value of goods exports (up $1.4 billion) and services exports (up $1.7 billion). Thus, the strengthening of exports helped narrowed the goods and services deficit by over $1.0 billion each. Meanwhile, the seasonally adjusted goods exports stood at $16.0 billion in the June 2021 quarter, up $1.4 billion primarily due to a rise in milk powder, butter, and cheese; logs, wood, and wood articles; meat and edible offal; and mechanical machinery and equipment.
Exhibit 1: Seasonally Adjusted Values of Goods and Services ($ Million), March 2015–June 2021 Quarters
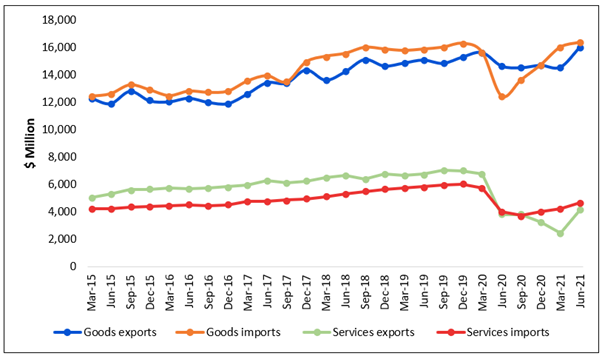
Data Source: This work is based on/includes Stats NZ’s data which are licensed by Stats NZ for reuse under the Creative Commons Attribution 4.0 International Licence; Chart Created by Kalkine Group
Strong International Trade, Supporting Port and Related Businesses: June 2021 quarter
As per Stats.NZ, the quarterly goods and services traded by New Zealand for the June 2021 quarter reported at $41.3 billion. In this, the total exports of goods and services for the period stood at $20.9 billion, from $19.2 billion in the June 2020 quarter. However, total imports of goods and services for the June 2021 quarter were reported at $20.4 billion, from $15.9 billion in the June 2020 quarter. This indicates that the port and related business is gathering momentum, primarily driven by accelerated demand for NZ products in the global market.
Exhibit 2: Goods and Services Exports and Imports – June 2021 Quarter
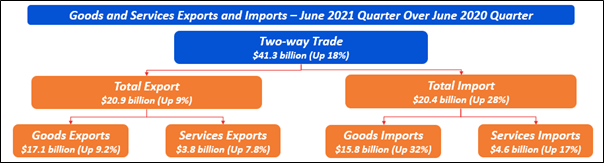
Data Source: This work is based on/includes Stats NZ’s data which are licensed by Stats NZ for reuse under the Creative Commons Attribution 4.0 International Licence; Chart Created by Kalkine Group
Rise in Values of Sea and Air Transport in December 2020 versus June 2020
As per Stats.NZ, spending on international sea and air transportation services have reported decent growth in December 2020 quarter from the low level reported in the June 2020 quarter, strengthening total transportation services imports by $100 million in the December 2020 quarter (up 15% QoQ). In the December 2020 quarter, the spending on transportation by sea and air has reported a sign of recovery.
Exhibit 3: Number of Heavy Trucks in NZ and Growth Momentum YoY
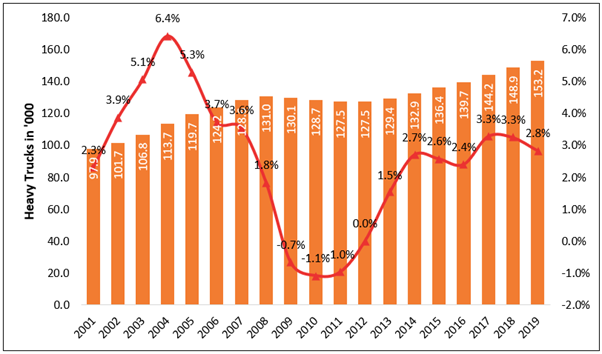
Data Source: This work is based on/includes Ministry of Transport data which are licensed by Crown Copyright for reuse under the Creative Commons Attribution 4.0 International Licence; Chart Analysis by Kalkine Group
Index Performance:
The S&P/NZX All Industrials (Sector) Index generated a 1-year return of ~32.61% versus ~10.71% by the S&P/NZX 50 Index. Therefore, NZX All Industrials Index overperformed NZX50 Index by ~21.90% in 1 year.
Exhibit 4: S&P/NZX All Industrials (Sector) vs S&P/NZX50 Index
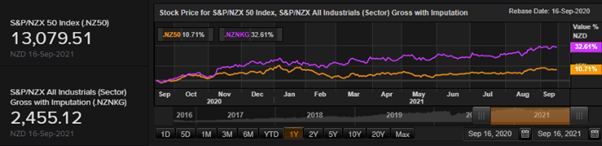
Source: REFINITIV
Key Risks and Challenges:
Rising technological developments, cyber exposures, and market fluctuations due to international trade disputes are some of the key risks faced by the transportation industry. In addition, experienced driver shortage, regulatory compliance, and slow-down in big infrastructure projects are the persistent challenges in the industry.
Beyond intellectual property concerns, manufacturers face the risks of competitiveness, complexities of the supply chain, growing manufacturing skills gap, technology and cybercrime, business interruption, and compliance risk, among others.
The country is experiencing the impacts of climate change (like more frequent severe storm events, flooding, and coastal inundation) on New Zealand’s transport network. Handling of these risks requires the coordination and collaboration of multiple agencies. As per the Government Policy Statement on land transport (GPS), there are four big challenges: preventing deaths and serious injuries, decarbonization, better transport choices for New Zealanders.
Exhibit 5. Key Risks in Industrials Sector:
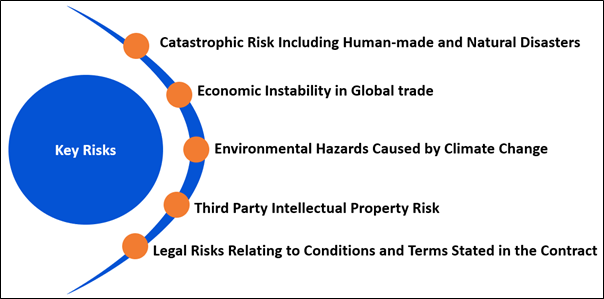
Sources: Analysis by Kalkine Group
Outlook:
As per the Government Policy Statement on Land Transport 2021/22 – 2030/31, the Government has picked four strategic priorities for land transport investment to improve communities’ wellbeing and liveability, comprised of safety (Developing a transport system where no-one is killed or seriously injure), Better Travel Options (Providing people with better transport options to access social and economic opportunities), Climate Change (Developing a low carbon transport system that supports emissions reductions, while improving safety and inclusive access), and Improving Freight Connections (Improving freight connections for economic development).
As per the Ministry of Transport, Long-term Insights Briefings (LTIB) are intended to provide greater visibility of future challenges and opportunities that could affect New Zealanders. In this regard, the Ministry is willing to investigate the impact of autonomous vehicles on the transport system and transport outcomes. It indicates a clear opportunity to take a “deep dive” into a specific area of transport that is expected to present significant challenges and opportunities for the transport system over the next 10-15 years.
Broadly, the government is driving the economic recovery through investments in business, infrastructure, and tourism support. The infrastructure investment over the next 4 years totals $57.3 billion. Further, support, recovery, and re-set for Tourism Communities has been set at $200 million, and small business digital training, advisory, and support program has been set at $44 million.
This investment support by the government is expected to accelerate economic growth in the coming quarters, thereby benefiting private and public companies immensely and raise output and incomes in the short run.
Apart from the sector-specific factors, we have also analysed four NZX-listed companies operating in the same sector. This report covers their insights, outlook, performance and potential as expected to be delivered in the near to medium term.
1) Napier Port Holdings Limited (Recommendation: Buy, Potential Upside: Low Double-Digit) (M-Cap: NZ$637.60 million, Gross Dividend Yield: 3.323%)
Business Description:
Napier Port Holdings Limited (NZX: NPH) offers shipping connections services, marine services, cargo handling services, cruise, crane driver training, and port tech solutions.
Outlook:
As per the management of the company, there will be no change to the guidance shared earlier for an underlying result from operating activities for FY21 of between $39-$42 million. The company does not see cruise ship visits in the 2021/22 cruise season. Meanwhile, revenue for 9MFY21 increased 8.4% YoY to $83.0 million and Bulk cargo revenue grew 38.1% YoY to $30.8 million driven by a 36.1% YoY increase in log exports to 2.24 million tonnes.
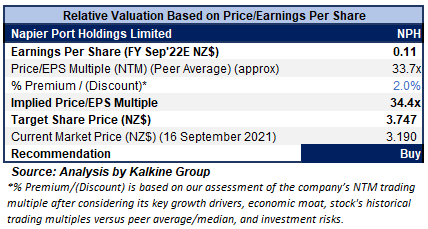
Valuation Methodology: Price/Earnings Per Share Based Relative Valuation (Illustrative)
Daily Price Chart
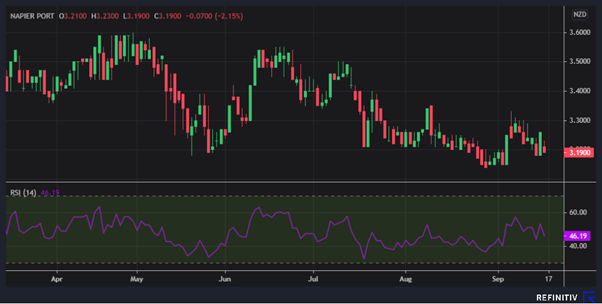
Source: REFINITIV, Note: Purple color line reflects Relative Strength Index (14-Period)
Stock Recommendation
The stock has been valued using a P/E multiple-based illustrative relative valuation method and arrived at a target price of low double-digit (in percentage terms). The company might trade at a slight premium to its peers’ average, considering strong 9MFY21 results as well as decent outlook.
For the valuation purpose, we have taken peers such as Port of Tauranga Ltd. (POT.NZ), Freightways Ltd. (FRE.NZ), and Qube Holdings Ltd. (QUB.AX) to name a few.
Considering the aforesaid facts, current trading level, and risks associated with the stock we give a “Buy” recommendation on the stock at the current market price of $3.19 per share, down 2.15% as on 16th September 2021.
2) MOVe Logistics Group Limited (Recommendation: Speculative Buy, Potential Upside: Low Double-Digit) (M-Cap: NZ$135.91 million)
Business Description:
MOVe Logistics Group Limited (NZX: MOV) offers freight services, logistics & warehousing services, international services, specialised lifting and transport, and fuel services.
Outlook
As per the management of the company, the prime focus will continue to be margin improvement and growing shareholder value. The current drive in the NZ economy is anticipated to be bettered, with some limitations on supply and capacity in the short run. However, in the long run, the market dynamics are expected to accelerate with anticipated growth in the economy. Some disruption is anticipated on supply chains from Covid-19 in FY22, with lockdowns, shipping constraints, and Port closures.
Technical Analysis:
Weekly Chart
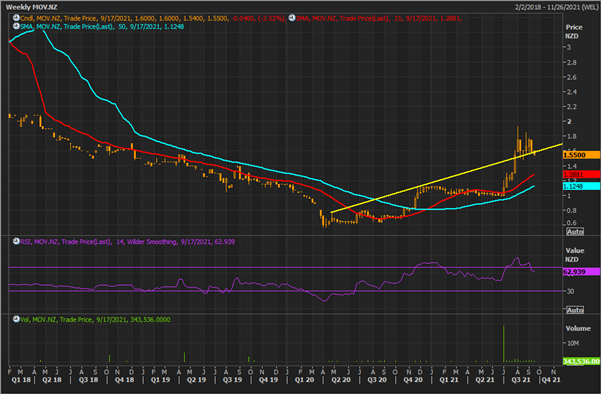
MOV's prices are forming a bullish pennant (bullish continuation) pattern on the weekly chart, indicating the possibility of further upside movement in the stock. Prices are also hovering around an upward sloping trend line breakout level for the past 6 weeks, further supporting an uptrend. On the weekly chart, the leading indicator RSI (14-period) is trading in positive territory at ~62.94 levels. The CMP is sustaining above the trend following indicators 21-period SMA and 50-period SMA, which act as support levels. Now an immediate resistance level for the stock appears at $1.400 while resistance is at $1.76 level.
Note: The purple color line in the chart depicts RSI (14-period), while the yellow color line represents the trend line. The sky-blue and red color lines show 21-Period SMA and 50-Period SMA respectively, while green color histograms at the bottom of charts represent weekly volumes.
Stock Recommendation:
Considering existing momentum in the NZ market and growth revival in the international market, we give a “Speculative Buy” recommendation on the stock at the current market price of $1.55 per share, down by 2.52% on 16th September 2021.
3) South Port New Zealand Limited (Recommendation: Hold, Potential Upside: Low Double-Digit) (M-Cap: NZ$246.61 million, Gross Dividend Yield: 3.842%)
Business Description:
South Port New Zealand Limited (NZX: SPN) is New Zealand’s southernmost commercial deep water port, primarily situated to service Southland’s phenomenal export and import industries comprising aluminium, timber, fisheries, dairy, meat, wood chips, stock food, cement, alumina, fertiliser and petroleum products.
Outlook
As per the management of the company, in the next 12 months, not much of the fundamentals will change. However, bulk cargoes are expected to be consistent and will continue to maintain their strengths. Moreover, the Southland region is constantly working hard to establish fresh industry in aquaculture and potentially green hydrogen, which will drive future growth. The company anticipates that earnings in FY22 are likely to remain consistent with FY21 reported earnings.
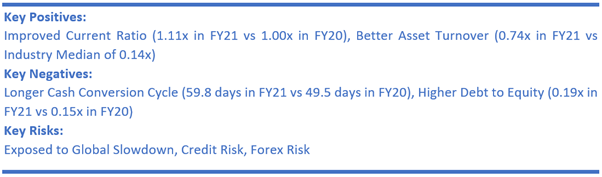
Daily Price Chart
Source: REFINITIV, Note: Purple color line reflects Relative Strength Index (14-Period)
Stock Recommendation
Considering the aforesaid facts, we give a “Hold” recommendation on the stock at the current market price of $9.40 per share, as of 16th September 2021.
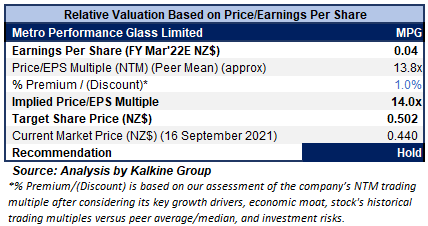
4) Metro Performance Glass Limited (Recommendation: Hold, Potential Upside: Low Double-Digit) (M-Cap: NZ$81.57 million)
Business Description:
Metro Performance Glass Limited (NZX: MPG) provides high-performance glass and industry-leading services to Australasian residential and commercial construction markets.
Outlook
As per the management of the company, the residential dwelling consents have remained elevated, despite the pandemic, strengthening a healthy pipeline of work. However, capacity limitation across the wider construction sphere may restrict growth in the near run. In south-east Australia, the level of residential approvals has phenomenally bettered that is expected to provide some support through the 2021 calendar year. The residential segment in New Zealand is expected to be competitive and dynamic through FY22.
Valuation Methodology: Price/Earnings Per Share Based Relative Valuation (Illustrative)
Daily Price Chart
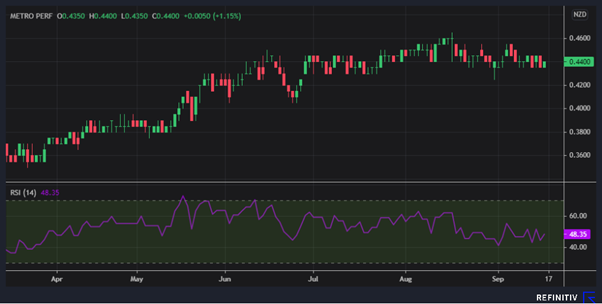
Source: REFINITIV, Note: Purple color line reflects Relative Strength Index (14-Period)
Stock Recommendation
The stock has been valued using a P/E multiple-based illustrative relative valuation method and arrived at a target price of low double-digit (in percentage terms). The company might trade at a slight premium to its peers’ average, considering strong residential demand from the Australian market and continued strength in the New Zealand market that is expected to provide decent growth in financials in FY22.
For the valuation purpose, we have taken peers such as Fletcher Building Ltd. (FBU.NZ), Skellerup Holdings Ltd. (SKL.NZ), and CIMIC Group Ltd. (CIM.AX) to name a few.
Considering the traction in economic recovery, acceleration in demand, strong FY22 financial expectation, and its growth strategies, we give a “Hold” recommendation on the stock at the current market price of $0.44 per share, up by 1.15% on 16th September 2021.
Note 1: The reference data in this report has been partly sourced from REFINITIV.
Note 2: Investment decisions should be made depending on the investors’ appetite on upside potential, risks, holding duration, and any previous holdings. Investors can consider exiting from the stock if the Target Price mentioned as per the analysis has been achieved and subject to the factors discussed above alongside support levels provided.
Technical Indicators Defined: -
Support: A level where-in the stock prices tend to find support if they are falling, and downtrend may take a pause backed by demand or buying interest.
Resistance: A level where-in the stock prices tend to find resistance when they are rising, and uptrend may take a pause due to profit booking or selling interest.
Stop-loss: It is a level to protect further losses in case of unfavourable movement in the stock prices.
Disclaimer
Kalkine New Zealand Limited is authorised to provide general advice only. The information on this website does not take into account any of your investment objectives, financial situation or needs. Before you make a decision about whether to acquire a financial product, you should obtain the Product Disclosure Statement from the product issuer. You should consider the appropriateness of advice taking into account your own objectives, financial situation and needs and seek independent financial advice before making any financial decisions.
Past performance is not a reliable indicator of future performance.
 Please wait processing your request...