
Kalkine’s Sector Report covers the Investment Highlights, Key Financial Metrics, Risks, Outlook, Technical Analysis, Key Support and Resistance Levels, and Recommendation on the stock.
1. Sector Landscape and Outlook
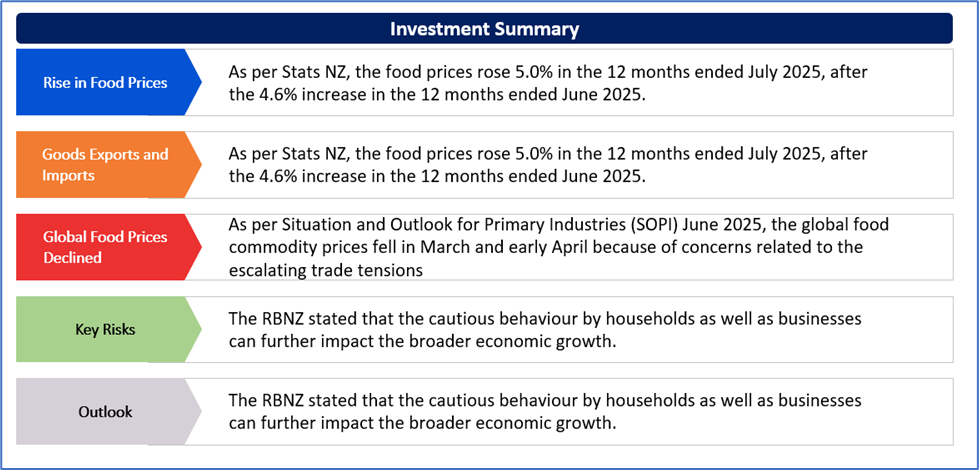
As per Stats NZ, the food prices rose 5.0% in the 12 months ended July 2025, after the 4.6% increase in the 12 months ended June 2025. Notably, all the 5 food groups witnessed higher prices as compared to the last year. Notably, increased prices for the grocery food group, which were up 5.1%, contributed the most to the annual rise in food prices. The rise in price for the grocery food group was because of increased prices for milk, butter, and cheese. Notably, in the 12 months ended July 2025, milk prices contributed more to the rise in overall food prices than any other food item.
The prices for the meat, poultry as well as fish group, which were up by 7.9%, was the next largest contributor to the annual rise in food prices. Also, the rent prices rose 2.4% in the 12 months ended July 2025, after the 2.6% rise in the 12 months ended June 2025.
Exhibit 1: Food Prices (Annual % Percentage) March 2025 – July 2025
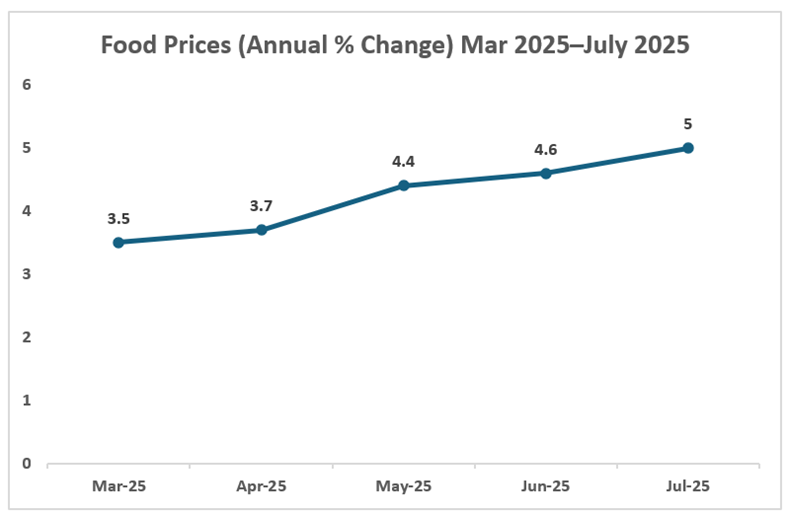
Data Source: This work is based on/includes Stats NZ’s data which are licensed by Stats NZ for reuse under the Creative Commons Attribution 4.0 International Licence; Chart Created by Kalkine Group
Overseas Merchandise Trade (July 2025)
Stats NZ released data about overseas merchandise trade (July 2025). In July 2025, goods exports witnessed a rise of $626 Mn (or 10%) to $6.7 Bn, and goods imports increased by $183 Mn (or 2.6%) to $7.3 Bn. The monthly trade balance was the deficit of $578 Mn. With respect to goods exports, the milk powder, butter, and cheese increased $ 275 Mn (or 17%) to $1.9. Talking about export movements by country, with respect to China, the total exports rose $98 Mn (or 7.1%). The largest increases were preparations of milk, cereals, flour, and starch (up $85 Mn), milk powder, butter, and cheese (up $77 Mn), and meat and edible offal (up $19 Mn).
Exhibit 2: Merchandise Trade Values ($ Bn), Exports and Imports, July Months, 2022–2025
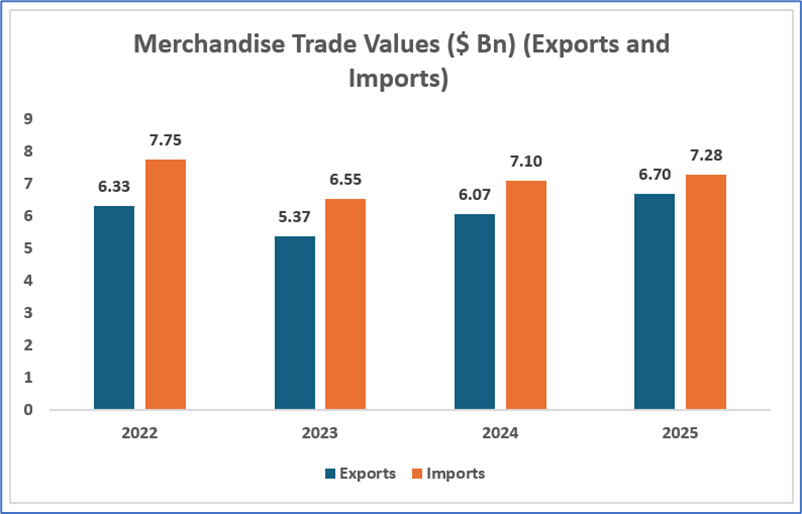
Data Source: This work is based on/includes Stats NZ’s data which are licensed by Stats NZ for reuse under the Creative Commons Attribution 4.0 International Licence; Chart Created by Kalkine Group
Global Food Prices Declined
As per Situation and Outlook for Primary Industries (SOPI) June 2025, the global food commodity prices fell in March and early April because of concerns related to the escalating trade tensions as well as their impact on the global demand. As per SOPI, the World Bank’s food price index declined by ~2% in the March 2025 quarter, reflecting a 4% decrease in comparison to the previous year. Over the March 2025 quarter, oils and meals prices witnessed the sharpest decline at 5%, with grain prices falling by 1%.
Notably, the supply-side constraints are an important driver of global dairy prices. SOPI highlighted that only ~7% of global milk production (in a milk-equivalent basis) is traded internationally. Therefore, the changes in milk supply conditions in leading dairy exporting markets like NZ, the EU, the US, Australia, and Argentina and in large dairy importing nations like China could significantly affect the global dairy prices.
Key Risks and Challenges:
Recently, the RBNZ stated that the cautious behaviour by households as well as businesses can further impact the broader economic growth. As per SOPI, the global food markets face challenges due to the trade tensions, currency movements as well as supply chain disruptions, which can influence the price stability over the upcoming months. The global food prices are anticipated to fall further. Overall, the consumer staples sector is exposed to the risks related to the global macroeconomic slowdown, geopolitical tensions, etc.
Exhibit 3. Key Risks in Consumer Staples Sector:
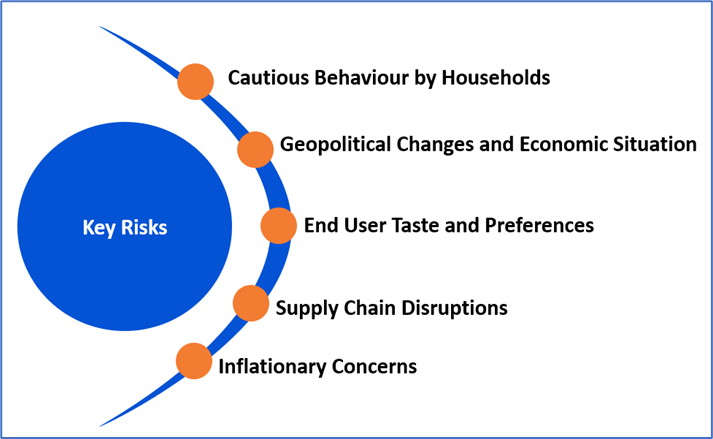
Source: Analysis by Kalkine Group
Outlook:
The destocking process, in which wine retailers were reducing the inventories after the COVID-19, remained a challenge that impacted the NZ wine exports in earlier seasons. However, as per SOPI June 2025, this process now seems to be over, with export volumes increasing to all top 10 export markets except Australia in the year ended 31 March 2025. This growth was helped by the weaker NZD. In 2024, NZ wine sales in the US increased for the 16th consecutive year.
SOPI highlighted that as the consumer preferences are shifting from red wine to white, NZ’s wine industry should remain confident that it continues to produce the right wines to achieve future growth as well as to enhance the position as a leader in global wine. Also, the 2024/25 cherry season ended with record export revenue of $124 Mn, up 35% from the previous season. This was because of increased export volumes while average export prices remained stable.
Apart from the sector-specific factors, an analysis on three NZX-listed companies is provided. This report covers their insights, outlook, performance and potential as expected to be delivered in the near to medium term.
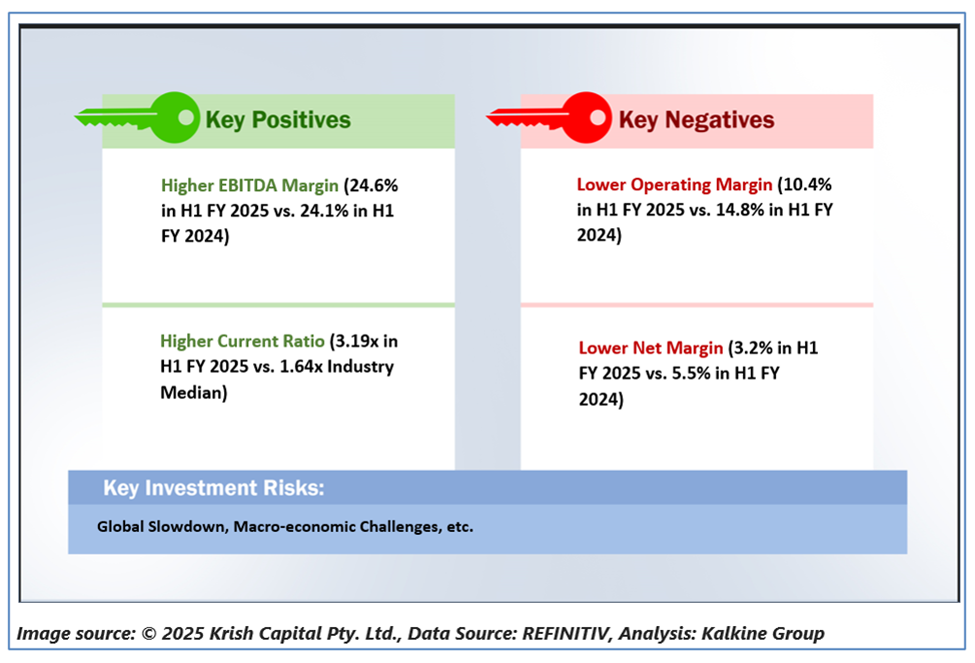
1) Foley Wines Limited (Recommendation: Speculative Buy, Potential Upside: Low Double-Digit) (M-Cap: NZD 39.4 Mn)
Business Description:
Foley Wines Limited (NZX: FWL) is an integrated wine company producing table wines with the marketing and sales of premium wines in New Zealand and various export markets.
Outlook:
While the broader industry might have struggled with export sales, the work FWL has done on establishing strong export markets has paid off. FWL reported growth in case sales throughout all exports markets. The company has established routes to market for what it produces. Also, its inventory is in good shape.
Technical Overview:
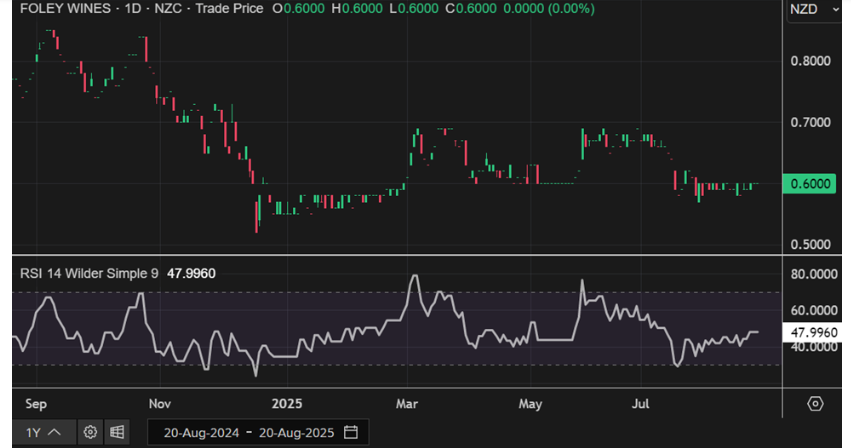
Source: REFINITIV, Note: Purple color line reflects Relative Strength Index (14-Period)
Technical Commentary
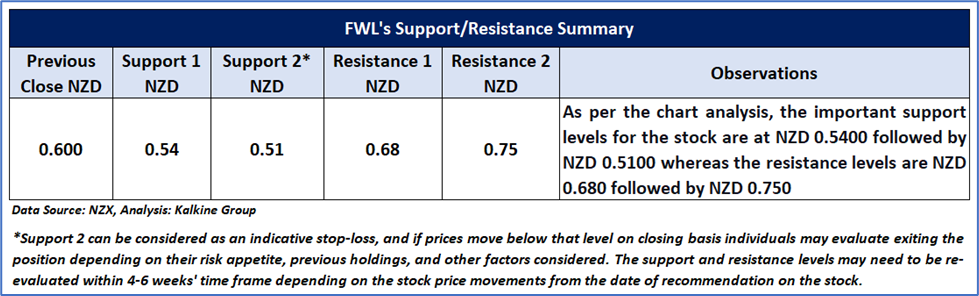
On the daily chart, FWL’s stock is forming a symmetrical triangle pattern, indicating that the current sideways trend may continue in the near term. Moreover, the 14-period RSI is hovering near the midpoint, which further supports this outlook. The stock is trading between its recent high and low, which may act as resistance and support levels, respectively. A key support level is located at NZD 0.54, while a critical resistance level is positioned at NZD 0.68.
Stock Recommendation
Considering the facts above, a ‘Speculative Buy’ recommendation on the stock has been provided at the closing market price of NZD 0.600 per share as on 20 August 2025.
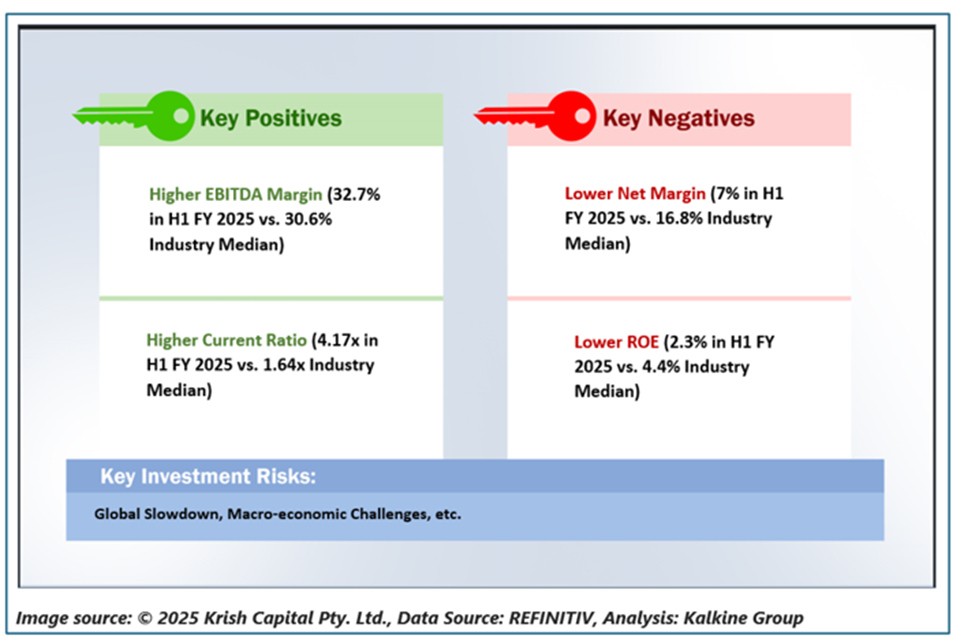
2) Delegat Group Limited (Recommendation: Buy, Potential Upside: Low Double-Digit) (M-Cap: NZD 369.1 Mn)
Business Description:
Delegat Group Limited (NZX: DGL) is a New Zealand-based wine company.
Outlook:
DGL is expecting global case sales of 3,182,000 cases for the FY 2025 year, down 5% from previous guidance. It expects Operating Net Profit after Tax of $47.0 million - $50.0 million for the year ended 30 June 2025. The Oyster Bay brand is holding a leadership position in the US market.
Technical Overview:
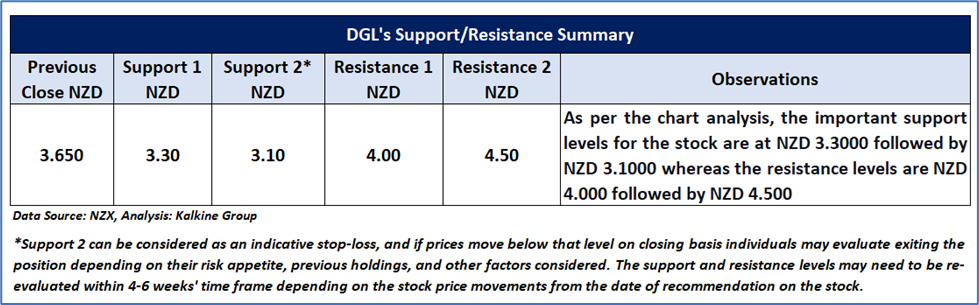
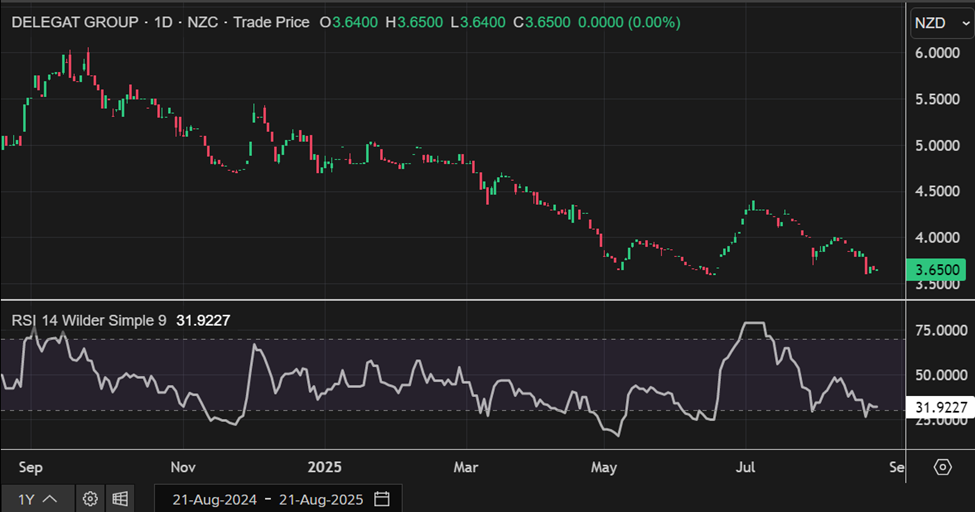
DGL Daily Technical Chart, Data Source: REFINITIV
Technical Commentary:
While experiencing a downtrend, DGL’s stock prices broke below the Neckline of a Head and shoulders pattern, indicating a negative bias. In contrast, the stock is approaching its previous trough, anticipating a potential minor rally. Prices are trading below both 21-day and 50-day SMAs, which might function as dynamic resistance levels for the stock; in contrast, the stock’s most recent low may act as a support level. A significant support level for the stock is positioned at NZD 3.30, while critical resistance level is located at NZD 4.00.
Stock Recommendation
Considering the facts above, a ‘Buy’ recommendation on the stock has been provided at the closing market price of NZD 3.65 per share as on 21 August 2025.
Markets are trading in a highly volatile zone currently due to certain macro-economic issues and geopolitical tensions prevailing. Therefore, it is prudent to follow a cautious approach while investing.
Note 1: Past performance is not a reliable indicator of future performance.
Note 2: The reference date for all price data, currency, technical indicators, support, and resistance levels is August 21, 2025. The reference data in this report has been partly sourced from REFINITIV.
Note 3: Investment decisions should be made depending on an individual's appetite for upside potential, risks, holding duration, and any previous holdings. An 'Exit' from the stock can be considered if the Target Price mentioned as per the Valuation and or the technical levels provided has been achieved and is subject to the factors discussed above.
Note 4: Annual Dividend Yield is on a Trailing Twelve Month (TTM1) basis and are subject to change based on factors such as company performance, stock price changes, etc.
Note 5: Kalkine reports are prepared based on the stock prices captured either from REFINITIV or Trading View. Typically, REFINITIV or Trading View may reflect stock prices with a delay which could be a lag of 25-30 minutes. There can be no assurance that future results or events will be consistent with the information provided in the report. The information is subject to change without any prior notice.
Technical Indicators Defined: -
Support: A level at which the stock prices tend to find support if they are falling, and a downtrend may take a pause backed by demand or buying interest. Support 1 refers to the nearby support level for the stock and if the price breaches the level, then Support 2 may act as the crucial support level for the stock.
Resistance: A level at which the stock prices tend to find resistance when they are rising, and an uptrend may take a pause due to profit booking or selling interest. Resistance 1 refers to the nearby resistance level for the stock and if the price surpasses the level, then Resistance 2 may act as the crucial resistance level for the stock.
Stop-loss: It is a level to protect further losses in case of unfavourable movement in the stock prices.
This report (“Report”) has been issued by Kalkine New Zealand Limited (FSP691351) (NZBN:9429047678101) (“Kalkine”). Kalkine is a Financial Advice Provider (“FAP”) and is authorised by a Class 1 Financial Advice Provider Licence issued by Financial Markets Authority (“FMA”) to provide financial advice. Kalkine provides only general financial advice through its research reports following a person becoming a member. The reports contain buy/sell/hold and other recommendations in relation to equity securities, managed funds and other managed investment schemes and other financial advice products. The recommendations and opinions in this Report and on Kalkine website do not take into account any of your investment objectives, financial situation or needs. Before you make a decision about whether to acquire a financial product, you should obtain the Product Disclosure Statement from the product issuer. You should consider the appropriateness of advice taking into account your own objectives, financial situation and needs and seek independent financial advice before making any financial decisions. If you act on the advice in the research reports, you may have to pay fees, expenses or other amounts (but not to Kalkine).
The information in this Report and on the Kalkine website has been prepared from a wide variety of sources, which Kalkine, to the best of its knowledge and belief, considers accurate. Kalkine has made every effort to ensure the reliability of the information contained in its reports (including this Report), newsletters and websites. All information represents our views at the date of publication and may change without notice.
Kalkine does not issue, sell or deal in any financial products. The information in this Report does not constitute an offer to sell securities or other financial products or a solicitation of an offer to buy securities or other financial products. Our reports contain general recommendations to invest in securities and other financial products. Kalkine is not responsible for, and does not guarantee, the performance of, or returns on, any investments mentioned in this Report.
This Report may contain information on past performance of particular investments. Past performance is not a reliable indicator of future performance. Returns stated do not take into account transaction costs and taxes.
Further information about the complaints and dispute resolution process, as well as information about Kalkine’s duties are available on Kalkine’s website. Please read our Financial Advice Provider (FAP) disclosure statement and Complaints Handling Guide, which are available on the website.
Copyright 2025 Krish Capital Pty. Ltd. (ABN 61629651510). All Rights Reserved. No part of this Report, or its content, may be reproduced in any form without our prior consent.
Past performance is not a reliable indicator of future performance.
 Please wait processing your request...