
Company Overview:
PGG Wrightson Limited (NZX: PGW) is an agricultural services business operating throughout New Zealand. Seeka Limited (NZX: SEK) is an integrated horticultural and produce company which grows, processes, distributes and markets high quality produce to world markets.
Kalkine’s Sector Report covers the Key Financial Metrics, Risks, Outlook, Technical Analysis along with the Valuation, Target Price, and Recommendation on the stock.
In 2022/23, MPI is increasing the value of its services, helping boost economic as well as environmental performance of New Zealand’s food and fibre sector. During the year, sector export revenue stood at $57.4 Bn and, total earnings from food and fibre sector exports to free trade agreement partners, stood at $39.5 Bn. As at 30 June 2023, over $566 Mn has been co-invested in Sustainable Food and Fibre Futures projects alongside industry partners since inception in 2018 and $38.4 Mn was committed to 58 Sustainable Food and Fibre Futures projects in 2022/23.
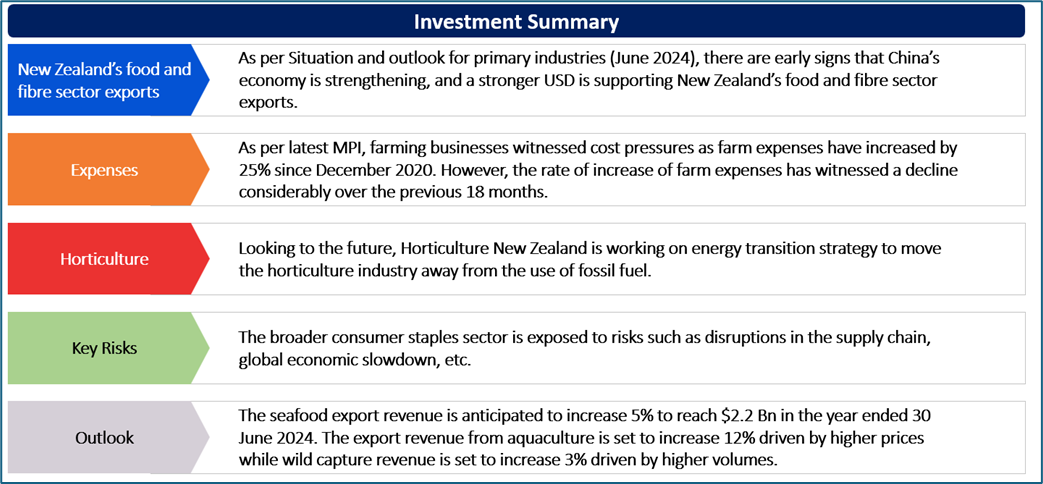
As per Situation and outlook for primary industries (June 2024), there are early signs that China’s economy is strengthening, and a stronger USD is supporting New Zealand’s food and fibre sector exports. Even though cost pressures are there, global shipping costs have remained well below the high levels witnessed in 2021/22.
New Zealand’s food and fibre sector is responsible for more than 80% of NZ’s goods exports. In 2023/24, prices and revenue for many exports have corrected from highs witnessed in 2021/22 and 2022/23 because of cyclical nature of commodity markets with slower global growth, specifically in NZ’s key export market China.
Exhibit 1: Export Revenue (Year to 31 March 2024)
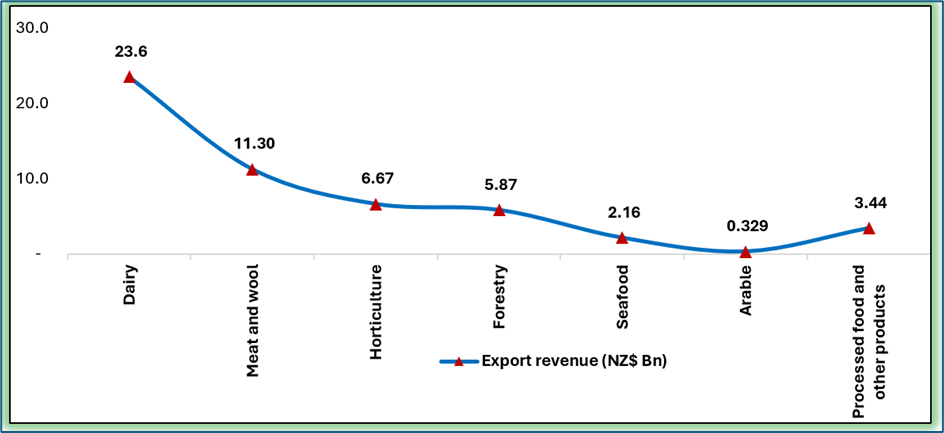
Data Source: This work is based on/includes Stats NZ’s data which are licensed by Stats NZ for reuse under the Creative Commons Attribution 4.0 International Licence; Chart Created by Kalkine Group
Farm Expenses
As per latest MPI, farming businesses witnessed cost pressures as farm expenses have increased by 25% since December 2020. However, the rate of increase of farm expenses has witnessed a decline considerably over the previous 18 months. In the 12 months ended 31 March 2024, farm expenses rose 1%. This was much slower than 12% increase experienced in the 12 months to 31 March 2023 and the 10 percent increase in the 12 months to 31 March 2022. Notably, low commodity prices and elevated farm expenses would likely be dampening the farm profitability.
The slowdown in the rate of increase over the past 12 months to 31 March 2024 was mainly driven by a decline in fertiliser expenses, down 7%, and livestock purchases, down 8%.
Exhibit 2: Farm Expenses Increase Slightly In 2023/24
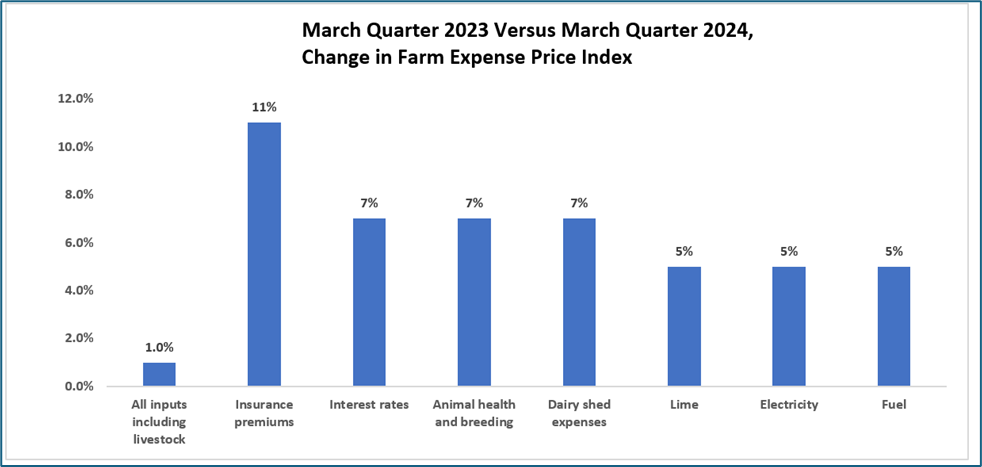
Data Source: This work is based on/includes Stats NZ’s data which are licensed by Stats NZ for reuse under the Creative Commons Attribution 4.0 International Licence; Chart Created by Kalkine Group
Horticulture – A Detailed View
In the 12 months ended 31 March 2024, horticulture experienced highest rate of increase in farm expenses, up 4%, followed by cropping and other farming, up 3%. The New Zealand-European Union Free Trade Agreement was entered into force on 1 May 2024. As NZ’s 4th largest trading partner, the EU is one of NZ’s most important markets with close to 450 Mn consumers.
For NZ’s horticultural sector, tariffs are eliminated immediately on kiwifruit, apples, and onions, resulting in savings of NZ$46 Mn per annum. Looking to the future, Horticulture New Zealand is working on energy transition strategy to move the horticulture industry away from the use of fossil fuel.
Horticulture export revenue is expected to increase 1% to $7.1 Bn for the year ended 30 June 2024. The climatic conditions in 2023/24 were favourable for most of the crops with higher production of kiwifruit, apples, cherries, and vegetables following the impacts of previous wet summers as well as cyclone damage.
Key Risks and Challenges:
The broader consumer staples sector is exposed to risks such as disruptions in the supply chain, increased labour shortages, global macro-economic challenges, etc. Moreover, geopolitical tensions could trigger the global energy and food crisis which could impact broader consumer staples sector in NZ.
Notably, the pace of future global economic growth is anticipated to be lower than the historical level of 3.8%. This was because of near-term factors like high borrowing costs from restrictive monetary policies, withdrawal of fiscal support, weaker growth in productivity and increasing geoeconomic fragmentation.
Exhibit 3. Key Risks in Consumer Staples Sector:
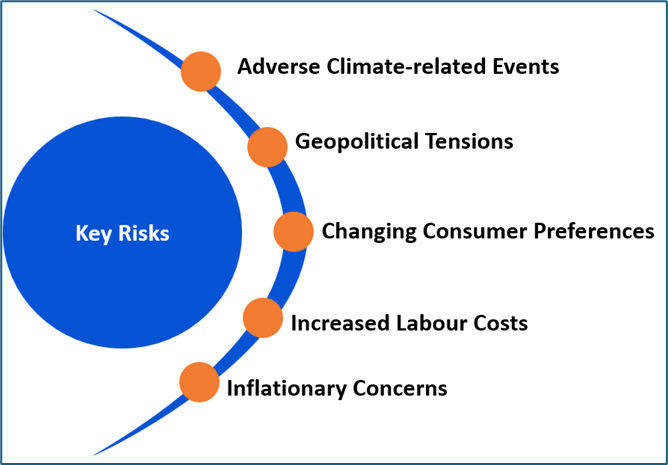
Source: Analysis by Kalkine Group
Outlook:
Notably, food and fibre sector export revenue is anticipated to decline 5% from the record high to $54.6 Bn for the year ended 30 June 2024. The revenue growth in the arable, horticulture, and seafood sectors is anticipated to increase, softening the decline in overall export revenue in 2023/24. The remainder of the outlook period remains positive with the recovery of markets as well as improvements in demand forecast to drive food and fibre export revenue to reach $66.6 billion in 2027/28.
The seafood export revenue is anticipated to increase 5% to reach $2.2 Bn in the year ended 30 June 2024. The export revenue from aquaculture is set to increase 12% driven by higher prices while wild capture revenue is set to increase 3% driven by higher volumes. The arable export revenue is anticipated to increase 12% to $310 Mn for the year ended 30 June 2024
Apart from the sector-specific factors, an analysis on three NZX-listed companies is provided. This report covers their insights, outlook, performance and potential as expected to be delivered in the near to medium term.
1) PGG Wrightson Limited (Recommendation: Buy, Potential Upside: Low Double-Digit) (M-Cap: NZD 113.9 million, Annual Dividend Yield1: 9.20%)
Business Description:
PGG Wrightson Limited (NZX: PGW) is an agricultural services business operating throughout New Zealand.
Outlook:
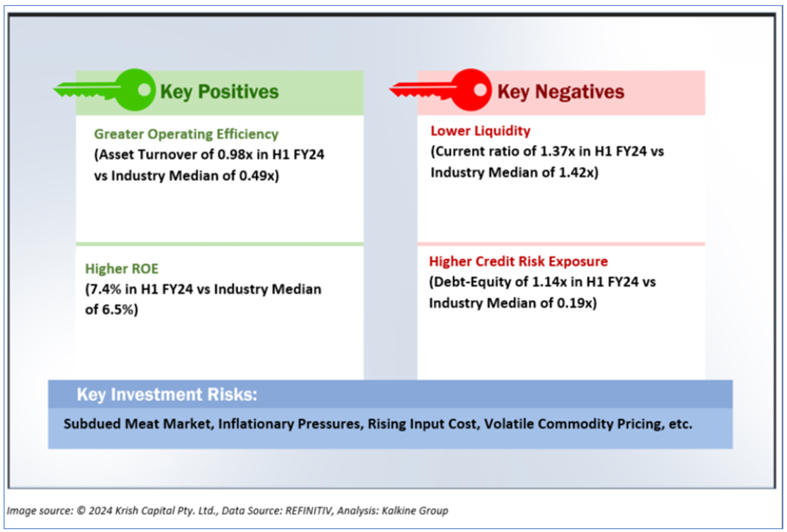
PGW has revised its Operating EBITDA of ~$43 Mn for the financial year ended 30 June 2024. Despite the present difficult market conditions, PGW is positive regarding the prospects for the sector over the medium to longer term. The company is confident that it is well placed to support the clients through challenging times and beyond.
PGW continues to maintain and grow share in the markets in which it operates.
Technical Overview:
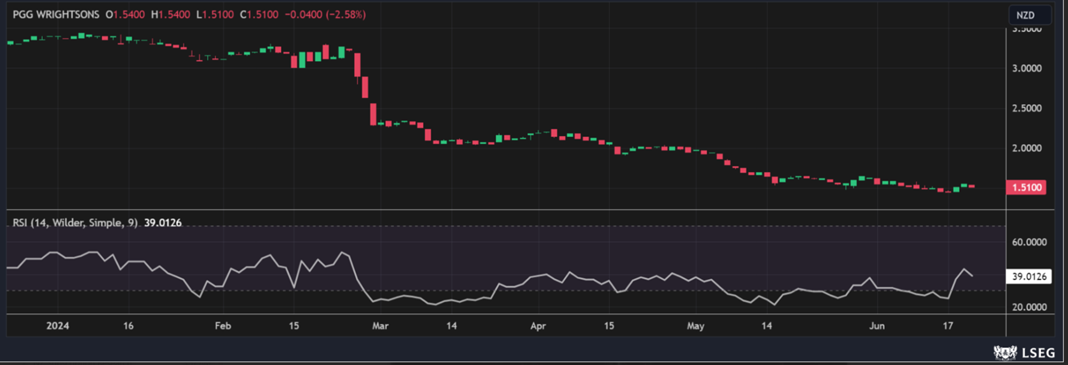
PGW Daily Technical Chart, Data Source: REFINITIV
Technical Commentary
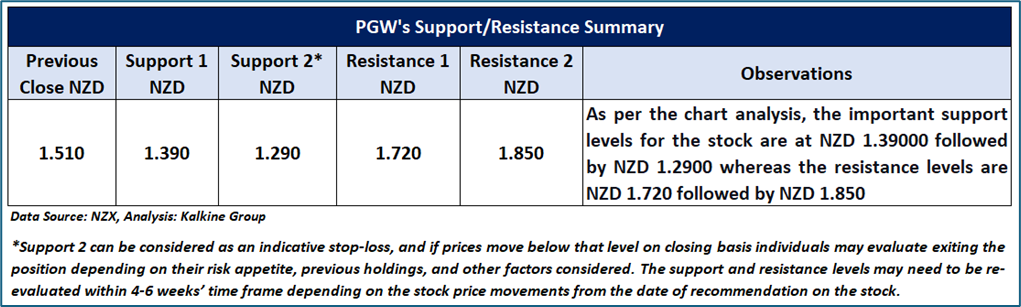
While experiencing a downtrend, PGW’s stock prices are developing a descending wedge pattern, suggesting that the downside momentum in the stock has been halting. Additionally, after forming multiple bottom divergences in relation to prices, the momentum oscillator RSI (14-period) is rebounding from its oversold region, providing more support for the previous observation. Prices are trading below both the trend-following indicators 21-period and 50-period SMAs, which might serve as dynamic resistance levels for the stock; in contrast, the stock’s previous low may act as a support. An important support level for the stock is placed at NZD 1.39, while key resistance level is situated at NZD 1.72.
Fundamental Valuation
P/E Based Relative Valuation
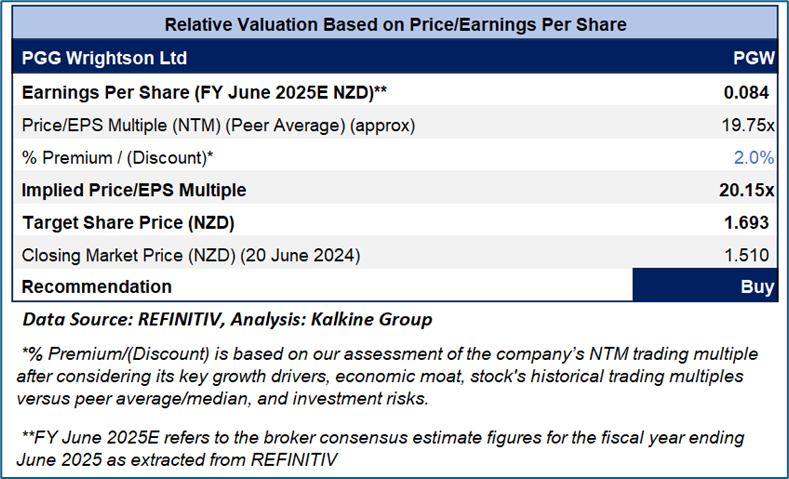
Stock Recommendation
Considering the facts above, a ‘Buy’ recommendation on the stock has been provided at the closing market price of NZD 1.51 per share, down by 2.58% as on 20 June 2024
2) Seeka Limited (Recommendation: Buy, Potential Upside: Low Double-Digit) (M-Cap: NZD 105.2 Mn, Annual Dividend Yield: )
Business Description:
Seeka Limited (NZX: SEK) is an integrated horticultural and produce company which grows, processes, distributes and markets high quality produce to world markets.
Outlook:
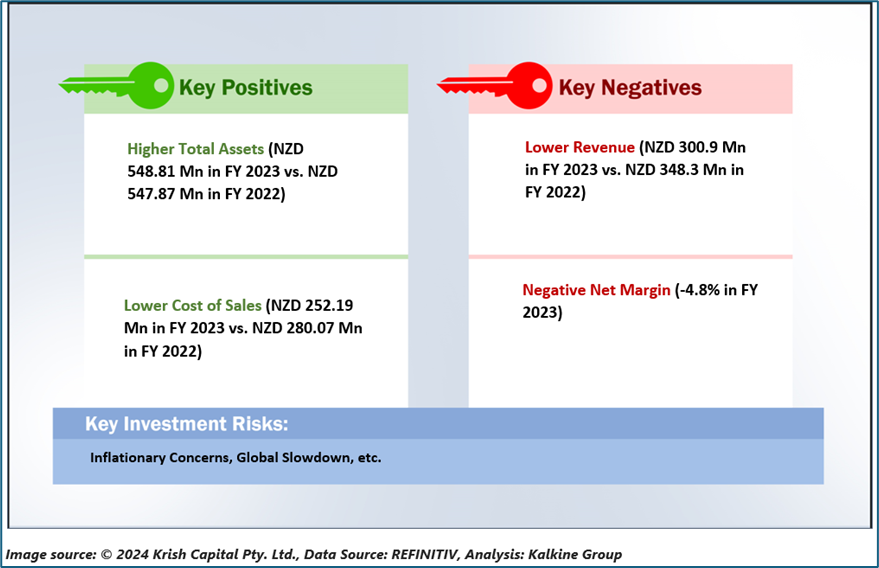
Following the successful completion of the kiwifruit harvests in New Zealand and Australia, SEK advised that it has completed the financial forecasts for the year ending 31 December 2024 indicating an expected net profit before tax in the range of $15 Mn to $19 Mn. This compares to a net loss before tax of $21 Mn in the prior year.
Technical Overview:
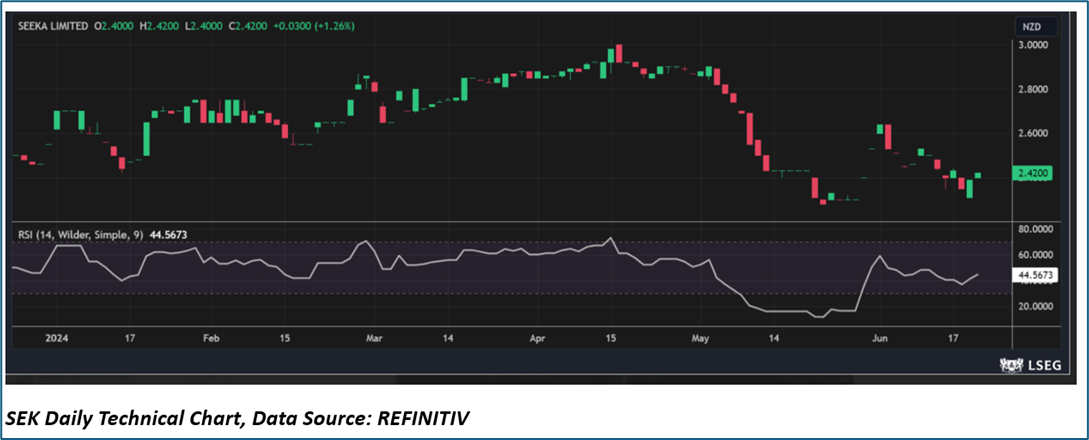
Technical Commentary
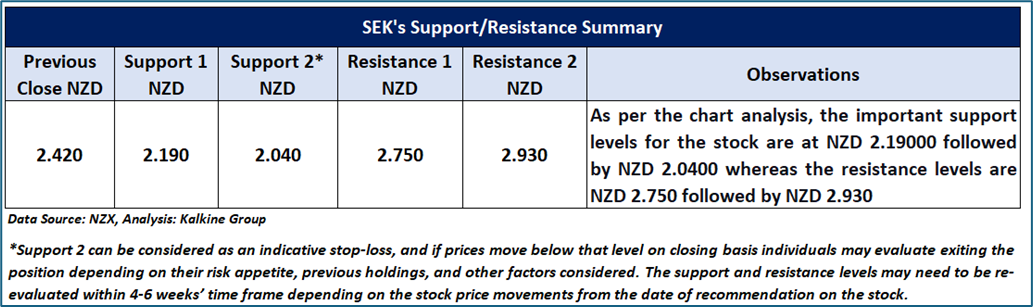
On the daily chart, SEK’s stock prices are forming a trading range, suggesting that the sideways period in the stock might continue to persist in the near future. Moreover, the momentum oscillator RSI (14-period) is hovering near the midpoint, adding further evidence for the mentioned recommendation. Prices fluctuating between its previous peak and trough, which might function as dynamic resistance and support levels for the stock, respectively. A significant support level for the stock is positioned at NZD 2.18, while critical resistance level is located at NZD 2.75.
Fundamental Valuation
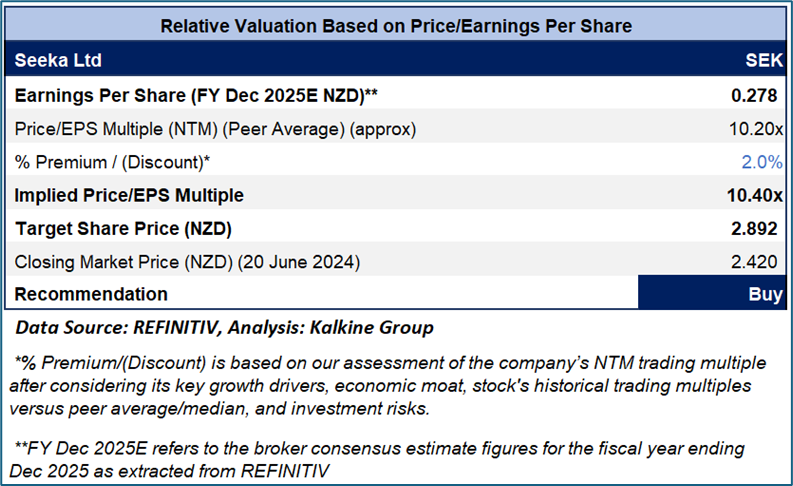
P/E Based Relative Valuation
Stock Recommendation
Considering the facts above, a ‘Buy’ recommendation on the stock has been provided at the closing market price of NZD 2.42 per share, up by 1.26% as on 20 June 2024.
Markets are trading in a highly volatile zone currently due to certain macro-economic issues and geopolitical tensions prevailing. Therefore, it is prudent to follow a cautious approach while investing.
Note 1: Past performance is not a reliable indicator of future performance.
Note 2: The reference date for all price data, currency, technical indicators, support, and resistance levels is June 20, 2024. The reference data in this report has been partly sourced from REFINITIV.
Note 3: Investment decisions should be made depending on an individual's appetite for upside potential, risks, holding duration, and any previous holdings. An 'Exit' from the stock can be considered if the Target Price mentioned as per the Valuation and or the technical levels provided has been achieved and is subject to the factors discussed above.
Note 4: Annual Dividend Yield is on a Trailing Twelve Month (TTM1) basis and are subject to change based on factors such as company performance, stock price changes, etc.
Technical Indicators Defined: -
Support: A level at which the stock prices tend to find support if they are falling, and a downtrend may take a pause backed by demand or buying interest. Support 1 refers to the nearby support level for the stock and if the price breaches the level, then Support 2 may act as the crucial support level for the stock.
Resistance: A level at which the stock prices tend to find resistance when they are rising, and an uptrend may take a pause due to profit booking or selling interest. Resistance 1 refers to the nearby resistance level for the stock and if the price surpasses the level, then Resistance 2 may act as the crucial resistance level for the stock.
Stop-loss: It is a level to protect further losses in case of unfavourable movement in the stock prices.
Disclaimer This report has been issued by Kalkine New Zealand Limited (FSP691351) (NZBN:9429047678101) (“Kalkine”). Kalkine is a Financial Advice Provider (“FAP”) and is authorised by a Class 1 Financial Advice Provider Licence issued by Financial Markets Authority (“FMA”) to provide financial advice. Kalkine provides only general financial advice through its research reports following a person becoming a member. The reports contain buy/sell/hold and other recommendations in relation to equity securities, managed funds and other managed investment schemes and other financial advice products. The recommendations and opinions in this report and on Kalkine website do not take into account any of your investment objectives, financial situation or needs. Before you make a decision about whether to acquire a financial product, you should obtain the Product Disclosure Statement from the product issuer. You should consider the appropriateness of advice taking into account your own objectives, financial situation and needs and seek independent financial advice before making any financial decisions. If you act on the advice in the research reports, you may have to pay fees, expenses or other amounts (but not to Kalkine). Further information about the complaints and dispute resolution process, as well as information about Kalkine’s duties are available on Kalkine’s website. Please read our Financial Advice Provider (FAP) disclosure statement and Complaints Handling Guide, which are available on the website.
Past performance is not a reliable indicator of future performance.
 Please wait processing your request...