
Section 1: Company Overview and Fundamentals
1.1 Company Overview:
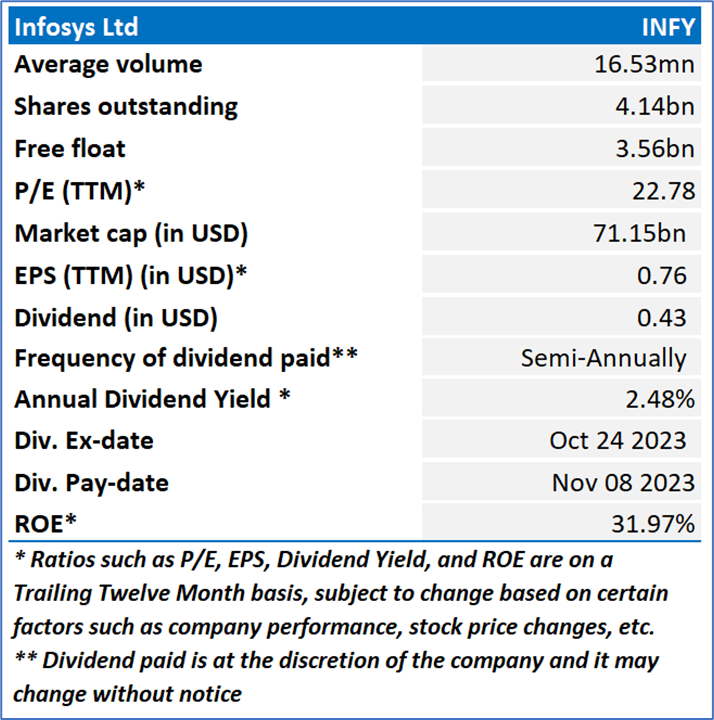
Infosys Limited (NYSE: INFY) is an India-based company, which provides consulting, technology, outsourcing and digital services. Its segments include Financial Services; Retail; Communication; Energy, Utilities, Resources and Services; Manufacturing; Hi-Tech; Life Sciences and All other segments. All other segments represent the operating segments of businesses in India, Japan, China, Infosys Public Services, and other enterprises in public services.
Kalkine’s American Tech Report covers the Company Overview, Key positives & negatives, Investment summary, Key investment metrics, Top 10 shareholding, Business updates and insights into company recent financial results, Key Risks & Outlook, Price performance and technical summary, Target Price, and Recommendation on the stock.
Stock Performance:
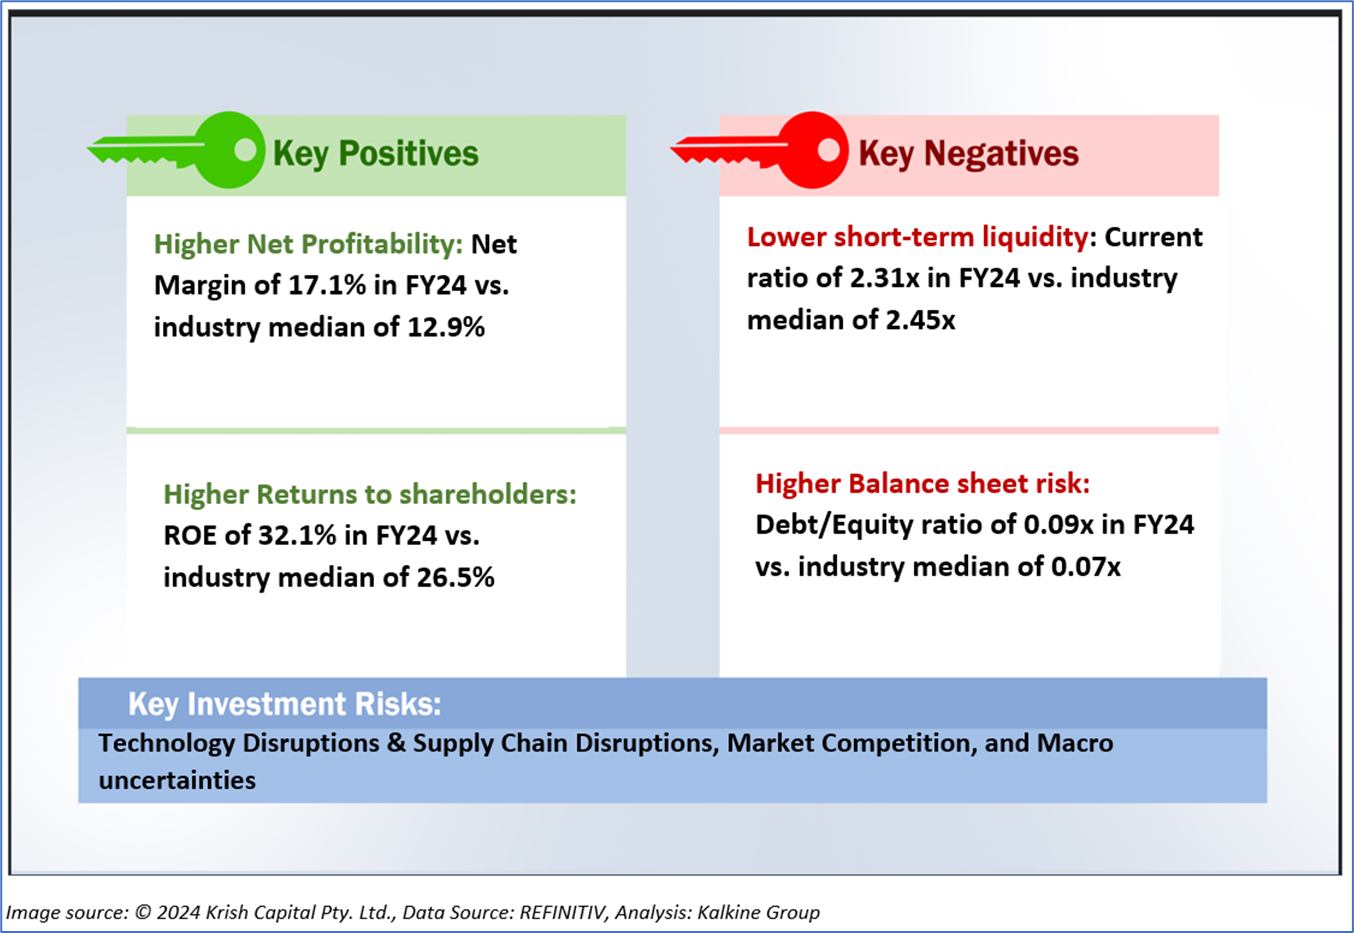
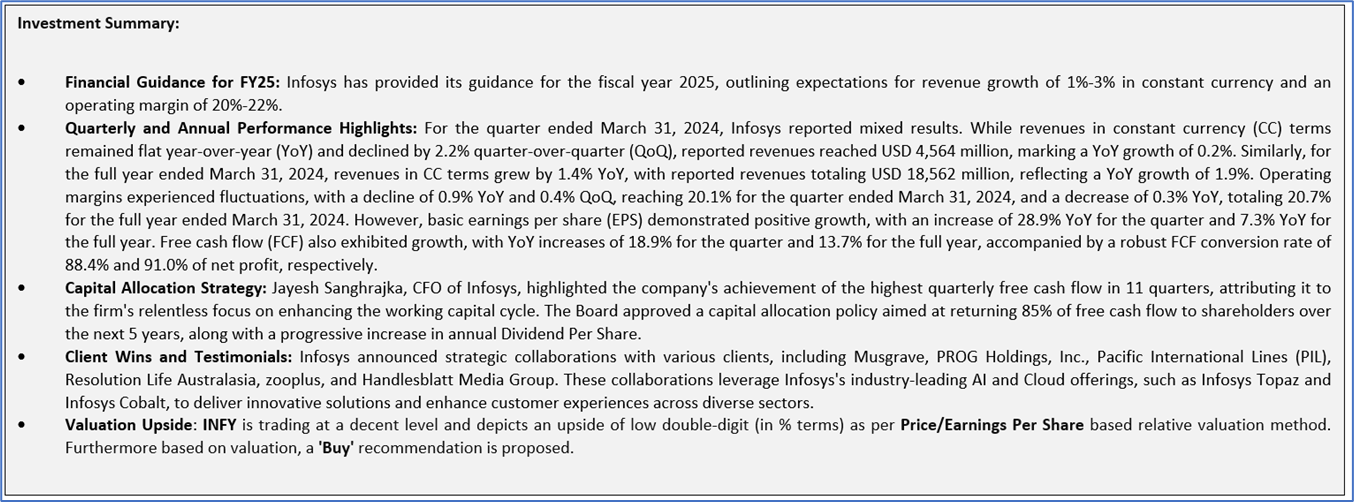
1.2 The Key Positives, Negatives, and Investment summary
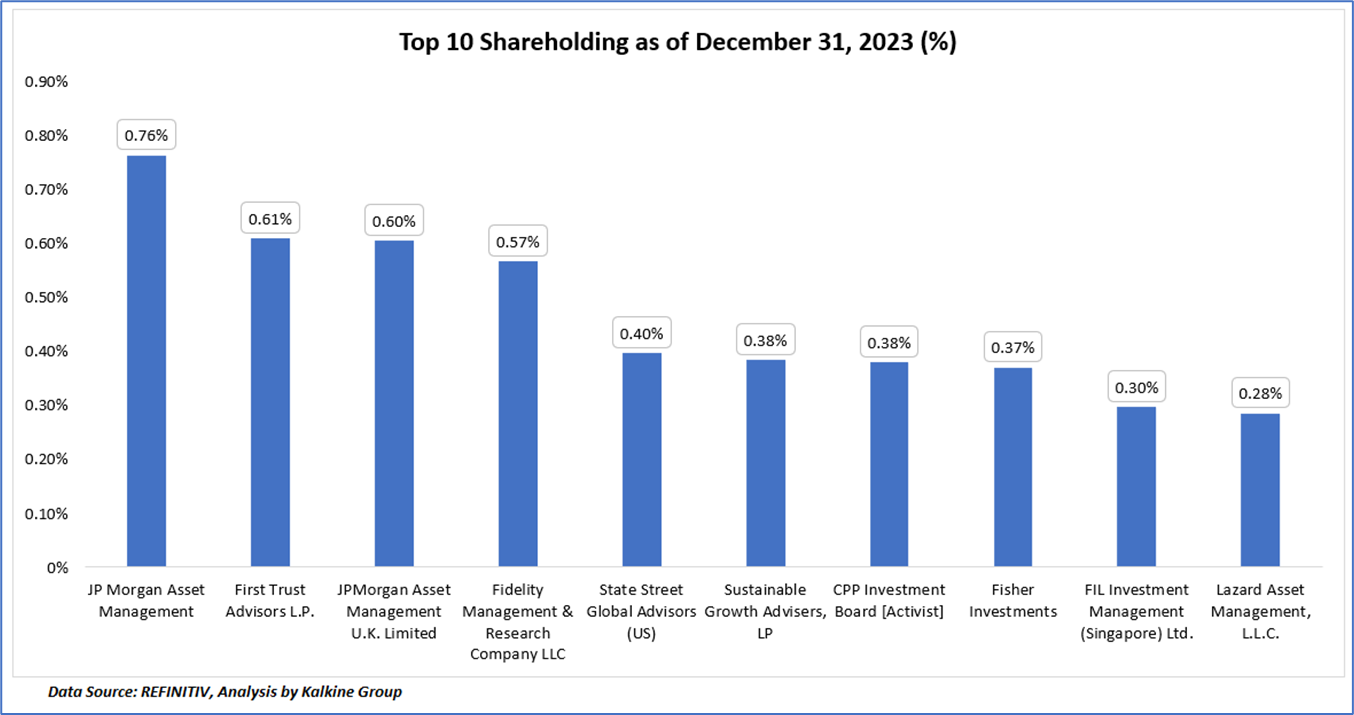
1.3 Top 10 shareholders:
The top 10 shareholders together form ~4.65% of the total shareholding, signifying diverse shareholding. JP Morgan Asset Management and First Trust Advisors L.P. are the biggest shareholders, holding the maximum stake in the company at ~0.76% and ~0.61%, respectively.
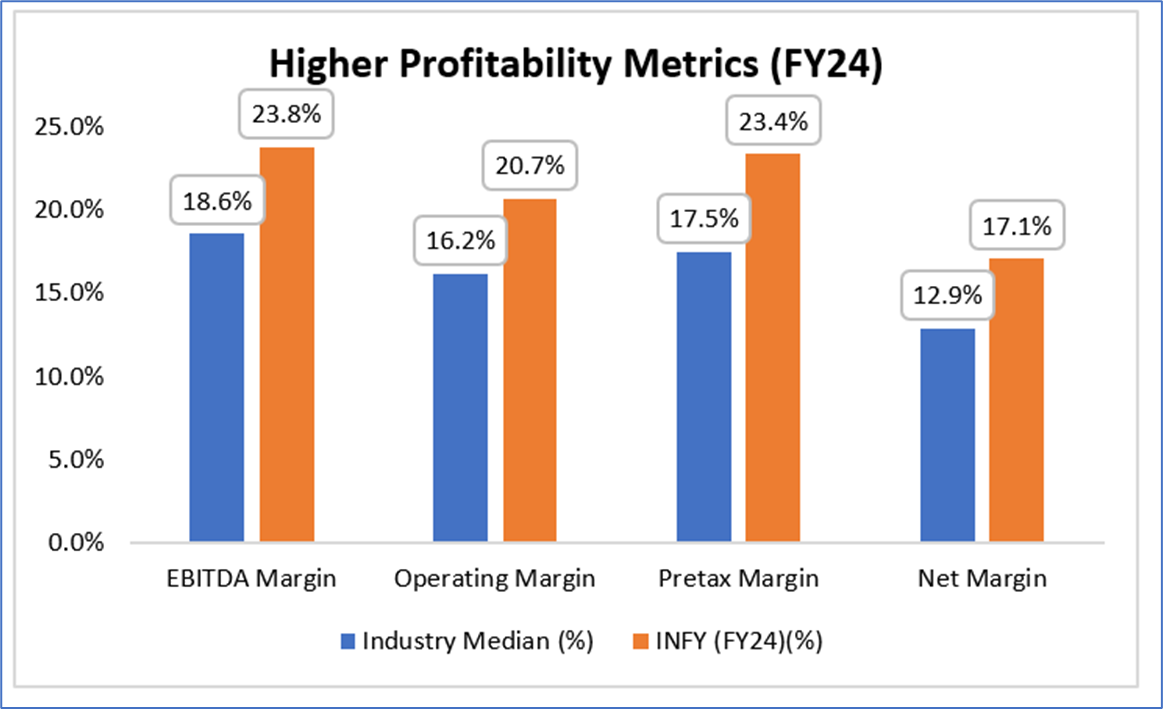
1.4 Key Metrics:
In FY24, Infosys showcased exceptional financial performance compared to industry benchmarks across key metrics. With an EBITDA margin of 23.8%, Infosys surpassed the industry median by 5.2 percentage points, reflecting efficient operational management and cost control measures. Similarly, its operating margin of 20.7% exceeded the industry median by 4.5 percentage points, indicating effective management of operating expenses relative to revenue. Furthermore, Infosys excelled in pretax margin, surpassing the industry median by 5.9 percentage points with a margin of 23.4%, showcasing efficient management of both operating and non-operating expenses. Additionally, Infosys demonstrated a strong net margin of 17.1%, exceeding the industry median by 4.2 percentage points, highlighting effective bottom-line management and the ability to translate a higher proportion of revenue into net income compared to industry standards.
Section 2: Business Updates and Corporate Business Highlights
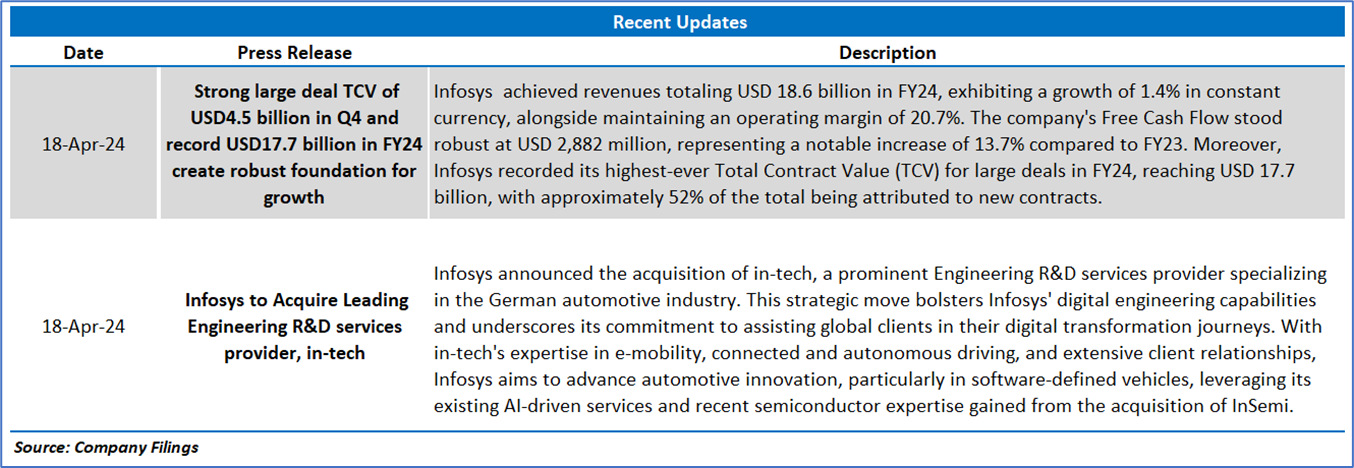
2.1 Recent Updates:
The below picture gives an overview of the recent updates:
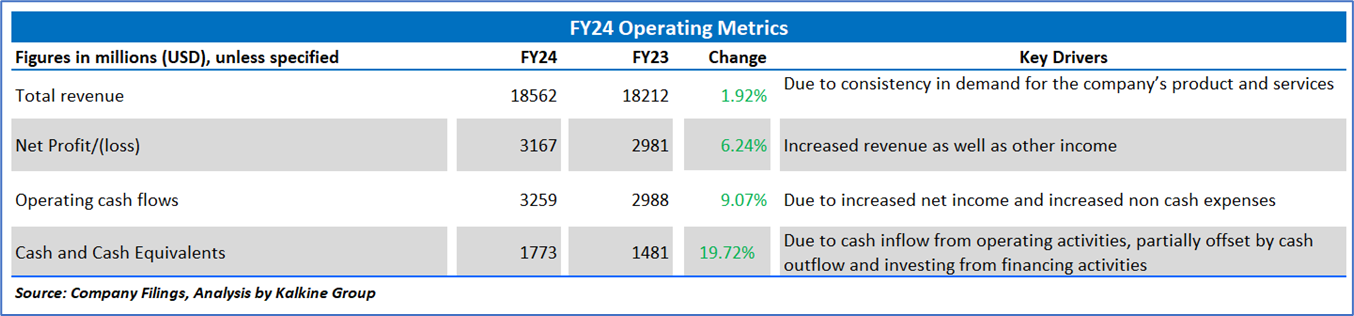
2.2 Insights of FY24:
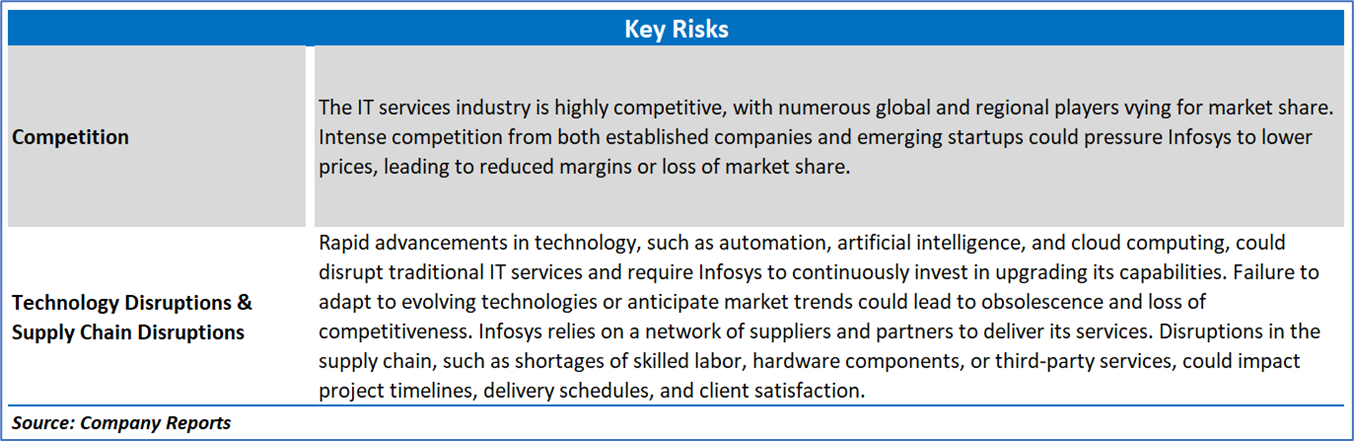
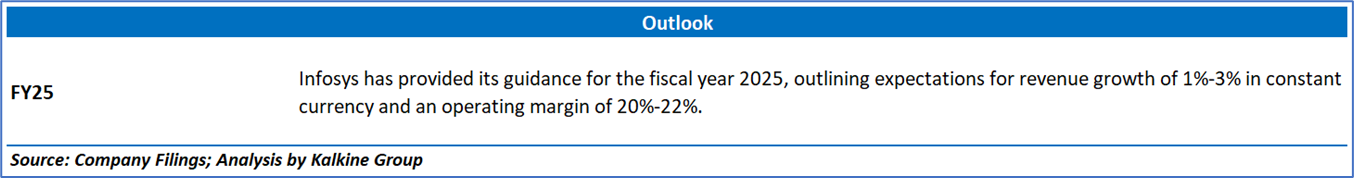
Section 3: Key Risks & Outlook
Section 4: Stock Recommendation Summary:
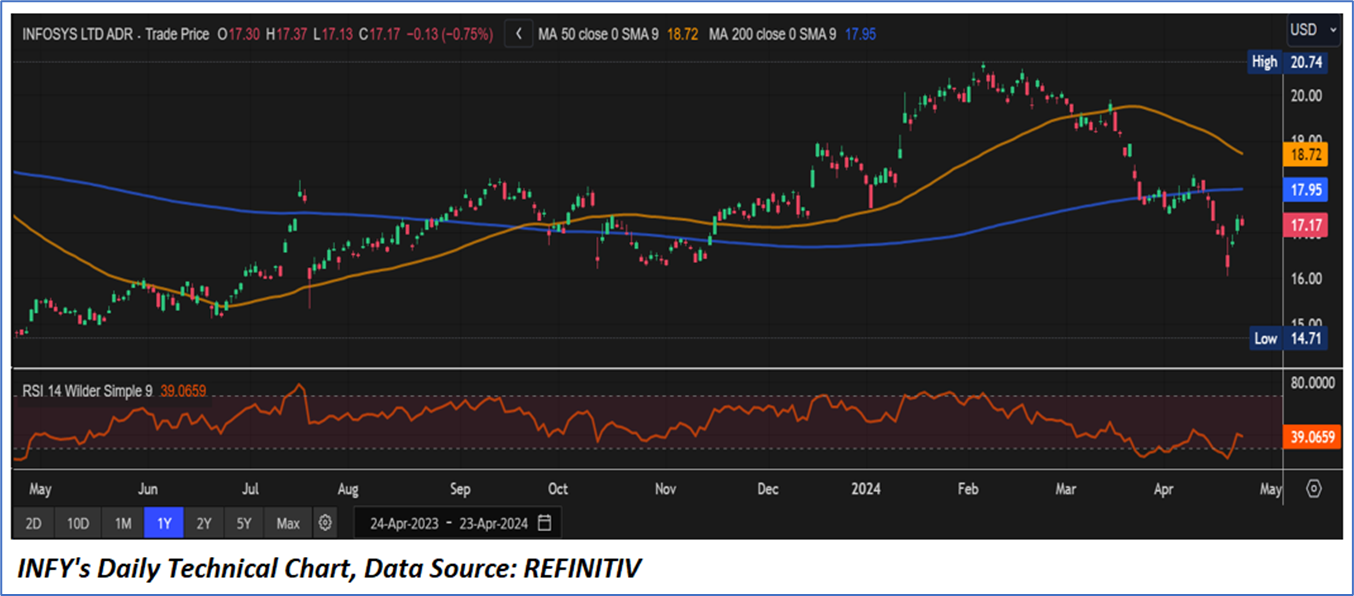
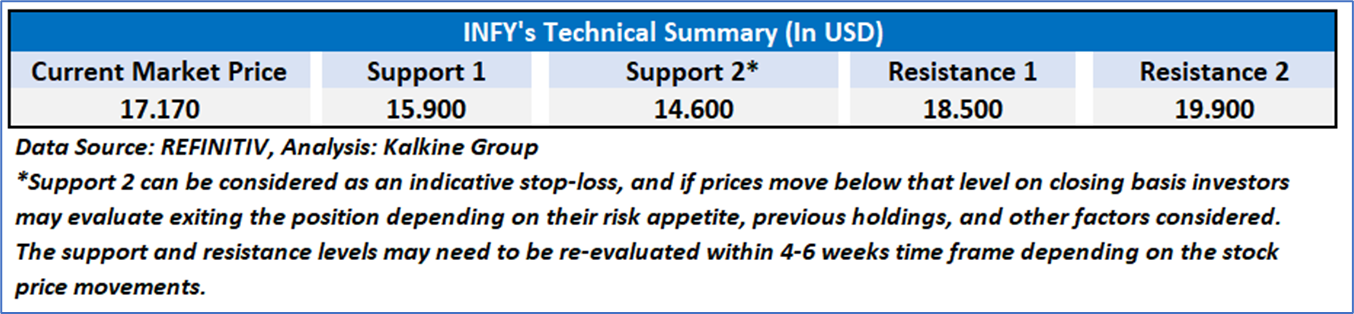
4.1 Price Performance and Technical Summary:
Stock Performance:
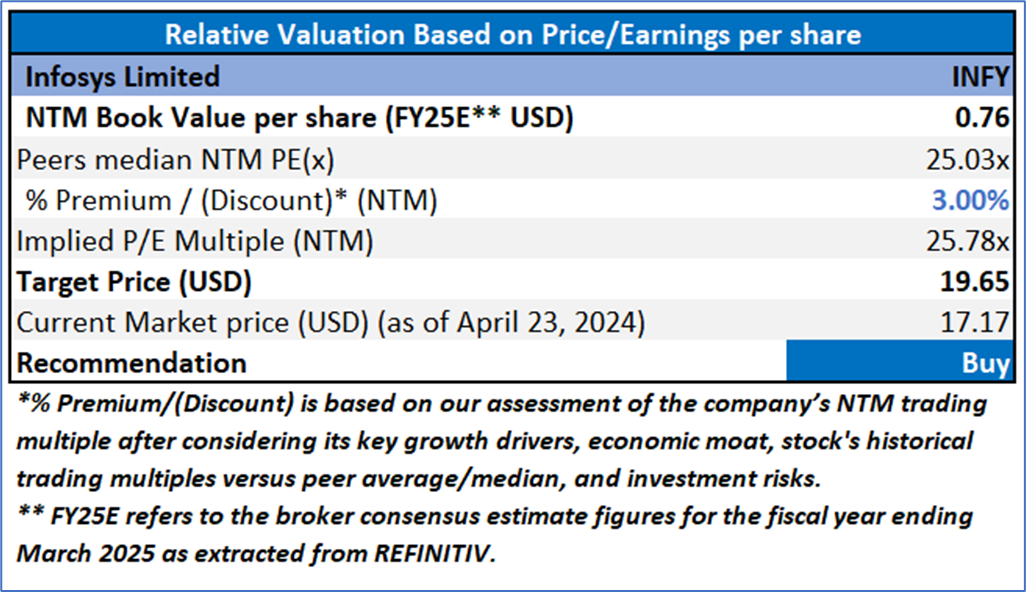
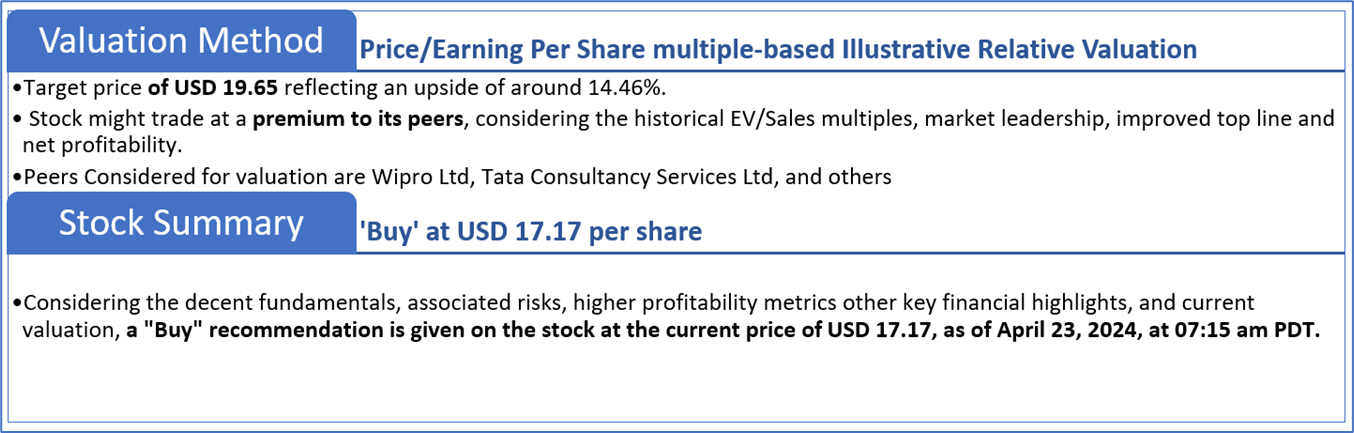
4.2 Fundamental Valuation
Valuation Methodology: Price/Earnings Per Share Multiple Based Relative Valuation
Markets are trading in a highly volatile zone currently due to certain macroeconomic issues and geopolitical tensions prevailing. Therefore, it is prudent to follow a cautious approach while investing.
Note 1: Past performance is not a reliable indicator of future performance.
Note 2: The reference date for all price data, currency, technical indicators, support, and resistance levels is April 23, 2024. The reference data in this report has been partly sourced from REFINITIV.
Note 3: Investment decisions should be made depending on an individual's appetite for upside potential, risks, holding duration, and any previous holdings. An 'Exit' from the stock can be considered if the Target Price mentioned as per the Valuation and or the technical levels provided has been achieved and is subject to the factors discussed above.
Note 4: The report publishing date is as per the Pacific Time Zone.
Technical Indicators Defined: -
Support: A level at which the stock prices tend to find support if they are falling, and a downtrend may take a pause backed by demand or buying interest. Support 1 refers to the nearby support level for the stock and if the price breaches the level, then Support 2 may act as the crucial support level for the stock.
Resistance: A level at which the stock prices tend to find resistance when they are rising, and an uptrend may take a pause due to profit booking or selling interest. Resistance 1 refers to the nearby resistance level for the stock and if the price surpasses the level, then Resistance 2 may act as the crucial resistance level for the stock.
Stop-loss: It is a level to protect against further losses in case of unfavorable movement in the stock prices.
Disclaimer
Kalkine New Zealand Limited is a Financial Advice Provider (“FAP”) and is authorised by a Class 1 Financial Advice Provider Licence issued by Financial Markets Authority (“FMA”) to provide financial advice. Kalkine provides only general financial advice through its research reports following a person becoming a member. The reports contain buy/sell/hold and other recommendations in relation to equity financial products. The recommendations and opinions [on this website] / [in this report] do not take into account any of your investment objectives, financial situation or needs. Before you make a decision about whether to acquire a financial product, you should obtain the Product Disclosure Statement from the product issuer. You should consider the appropriateness of advice taking into account your own objectives, financial situation and needs and seek independent financial advice before making any financial decisions. If you act on the advice in the research reports, you may have to pay fees, expenses or other amounts (but not to Kalkine). Further information about the complaints and dispute resolution process, as well as information about Kalkine’s duties are available on Kalkine’s website. Please read our Financial Advice Provider (FAP) disclosure statement and Complaints Handling Guide, which are available on the website.
Past performance is not a reliable indicator of future performance.
 Please wait processing your request...