Company Overview: WEB Travel Group Limited (ASX: WEB), formerly Webjet Limited, is an Australia-based global business to business (B2B) travel distribution company. The Company connects travel sellers with travel buyers across all major global markets. BCAL Diagnostics Limited (ASX: BDX) is an Australia-based biotechnology company involved in diagnosis and monitoring of breast cancer and development of blood screening tests for breast cancer screening methods. Kalkine’s Inflation Report covers the Investment Highlights, Key Financial Metrics, Risks, Outlook, Technical Analysis along with the Valuation, Target Price, and Recommendation on these two stocks.
Section 1: Introduction
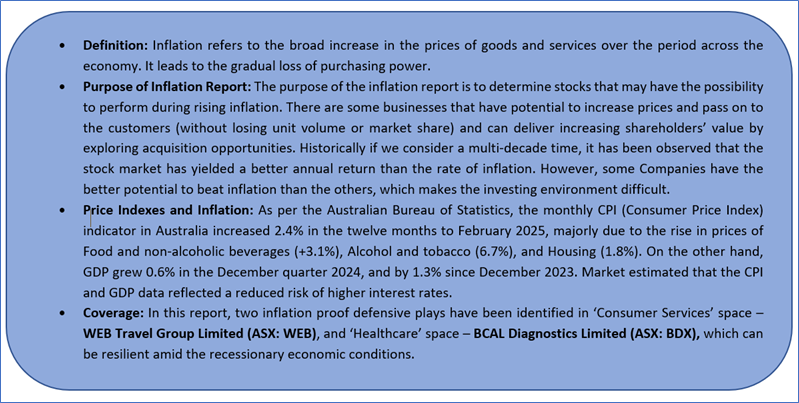
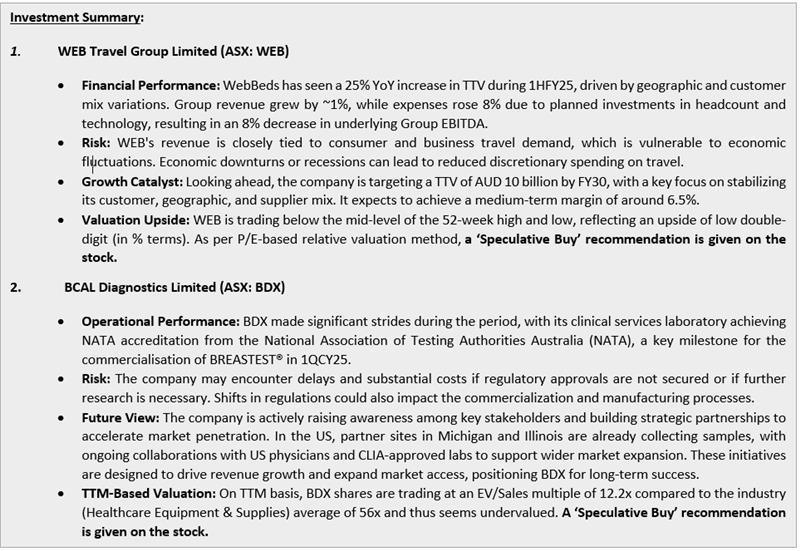
Section 2: Investment Highlights & Summary Table

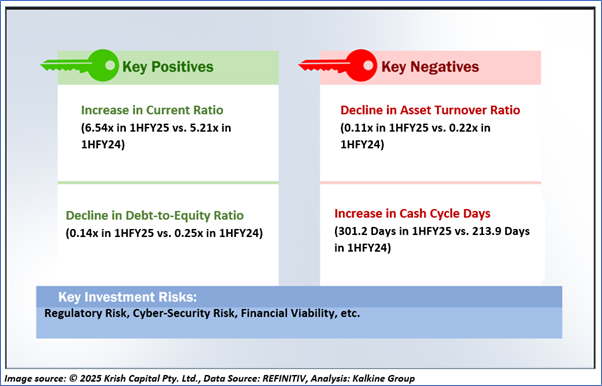
Section 3.0: Key Metrics in Pictures
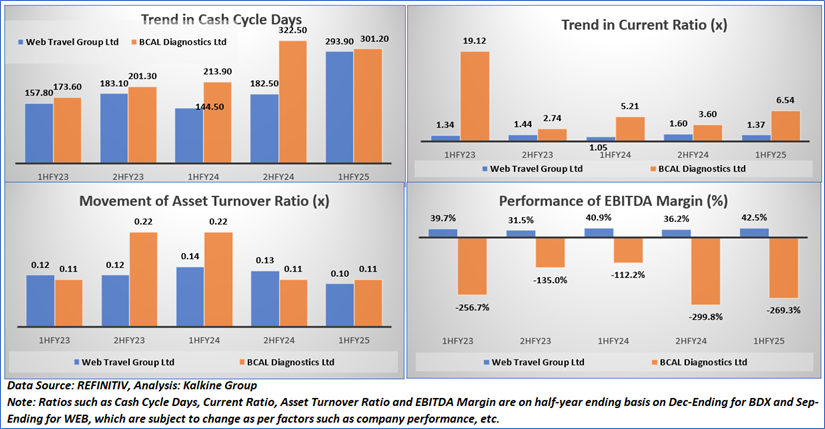
Having looked at the key financial ratios above, the following sections provide an in-depth fundamental, and technical analysis on these two ASX-listed stocks along with respective recommendations, technical support and resistance levels and indicative stop-loss.
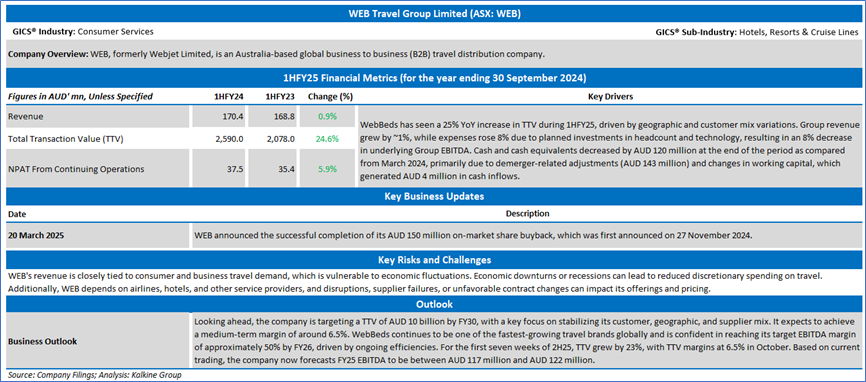
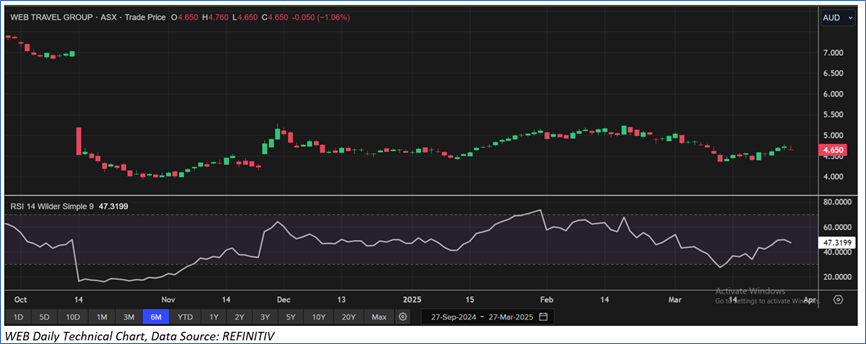
Section 4: WEB Travel Group Limited (ASX: WEB) (‘Speculative Buy’ at AUD 4.650, closing market price per share as on 27 March 2025)
4.1 Company Details, Business Updates, Key Risks & Outlook

Section 5: Valuation and Recommendation Summary
The stock has witnessed a decline of ~7.2% in the last one month, and over the last six months, it has decreased by ~37.3%. The stock has a 52-week low and 52-week high of AUD 3.935 and AUD 9.720, respectively, and is currently trading below the average of 52-week high-low average. WEB was last covered in a report dated '29 November 2024'.

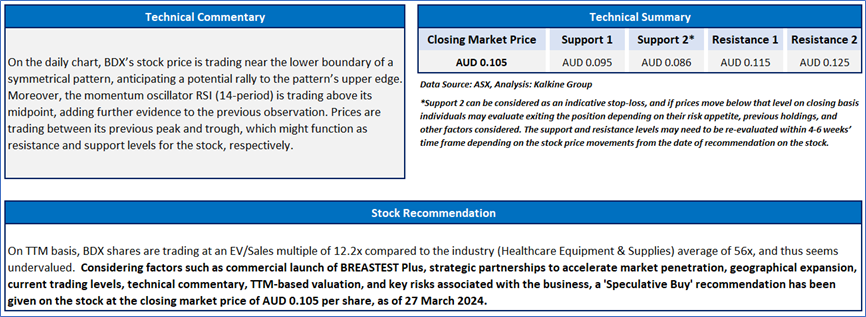
Section 6: BCAL Diagnostics Limited (ASX: BDX) (‘Speculative Buy’ at AUD 0.105, closing market price per share as on 27 March 2025)
6.1 Company Details, Business Updates, Key Risks & Outlook

Section 7: Valuation and Recommendation Summary
The stock has witnessed a decline of ~4.5% in the last one month, and over the last six months, it has decreased by ~15.9%. The stock has a 52-week low and 52-week high of AUD 0.086 and AUD 0.185, respectively, and is currently trading below the average of 52-week high-low average. BDX was last covered in a report dated ’29 May 2024’.
 Markets are trading in a highly volatile zone currently due to certain macro-economic issues and geopolitical tensions prevailing. Therefore, it is prudent to follow a cautious approach while investing.
Note 1: Past performance is neither an indicator nor a guarantee of future performance.
Note 2: The reference date for all price data, currency, technical indicators, support, and resistance levels is 27 March 2025. The reference data in this report has been partly sourced from REFINITIV.
Note 3: Investment decisions should be made depending on an individual’s appetite for upside potential, risks, holding duration, and any previous holdings. An ‘Exit’ from the stock can be considered if the Target Price mentioned as per the Valuation and or the technical levels provided have been achieved and is subject to the factors discussed above.
Note 4: Kalkine reports are prepared based on the stock prices captured either from REFINITIV or Trading View. Typically, REFINITIV or Trading View may reflect stock prices with a delay which could be a lag of 25-30 minutes. There can be no assurance that future results or events will be consistent with the information provided in the report. The information is subject to change without any prior notice.
Technical Indicators Defined: -
Support: A level at which the stock prices tend to find support if they are falling, and a downtrend may take a pause backed by demand or buying interest. Support 1 refers to the nearby support level for the stock and if the price breaches the level, then Support 2 may act as the crucial support level for the stock.
Resistance: A level at which the stock prices tend to find resistance when they are rising, and an uptrend may take a pause due to profit booking or selling interest. Resistance 1 refers to the nearby resistance level for the stock and if the price surpasses the level, then Resistance 2 may act as the crucial resistance level for the stock.
Stop-loss: It is a level to protect further losses in case of unfavourable movement in the stock prices.
Past performance is not a reliable indicator of future performance.
 Please wait processing your request...