
Section 1: Company Overview and Fundamentals
1.1 Company Overview:
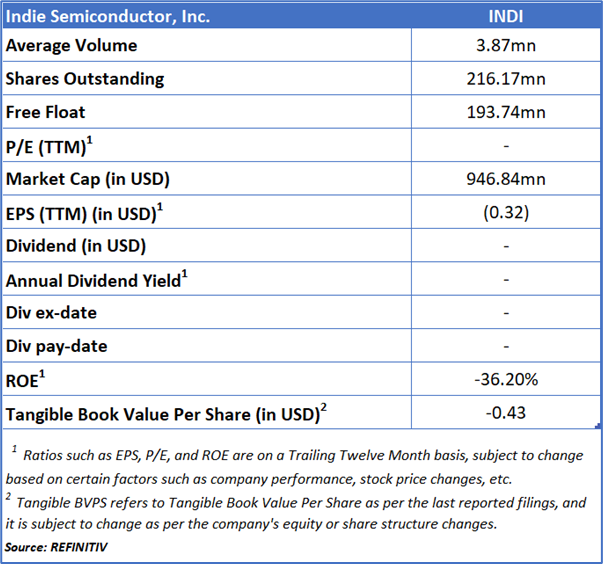
Indie Semiconductor, Inc. (NASDAQ: INDI) develops and provides automotive-grade semiconductors and software platforms that power advanced driver assistance systems (ADAS), autonomous driving, in-cabin and connected car user experiences, and vehicle electrification technologies.
Kalkine’s American Tech Report covers the Company Overview, Key positives & negatives, Investment summary, Key investment metrics, Top 10 shareholding, Business updates and insights into company recent financial results, Key Risks & Outlook, Price performance and technical summary, Target Price, and Recommendation on the stock.
Price Performance:
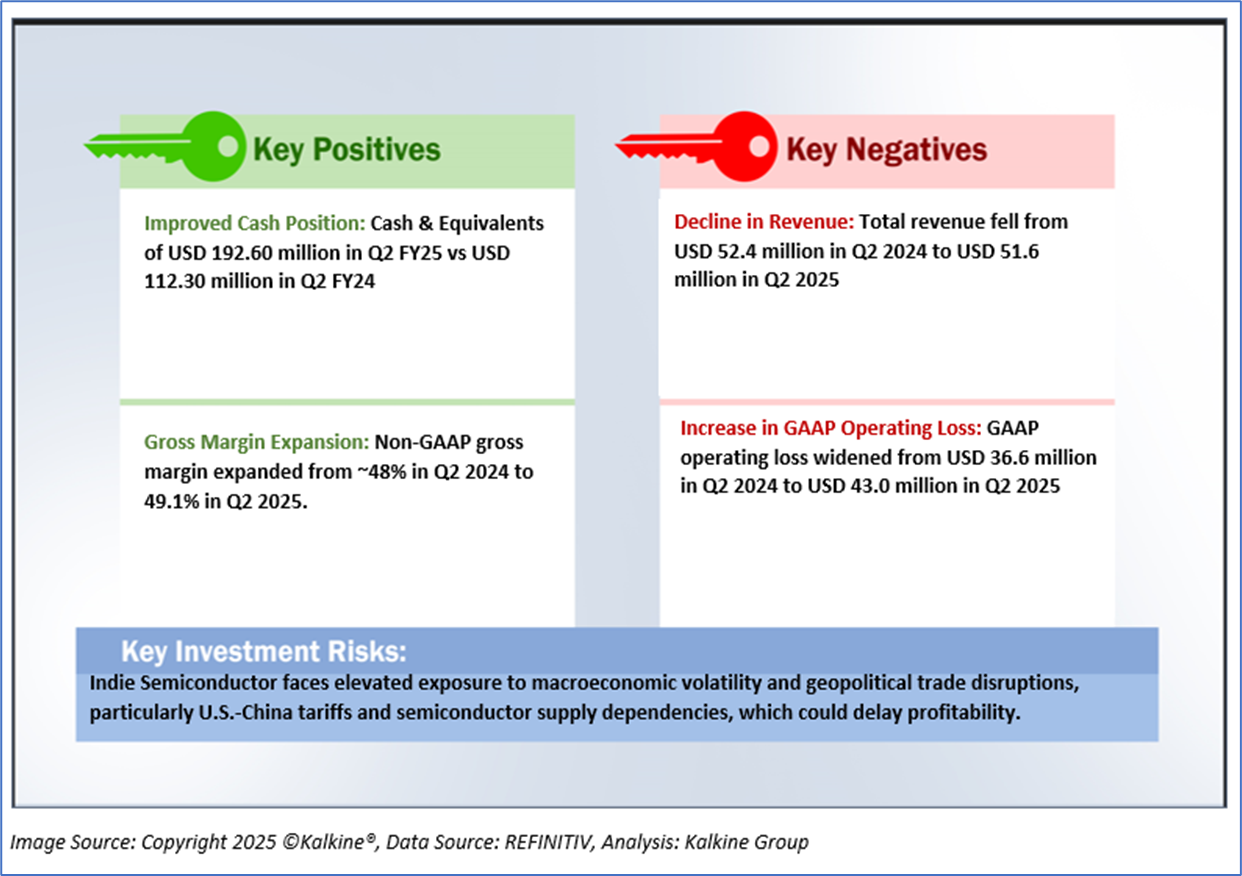
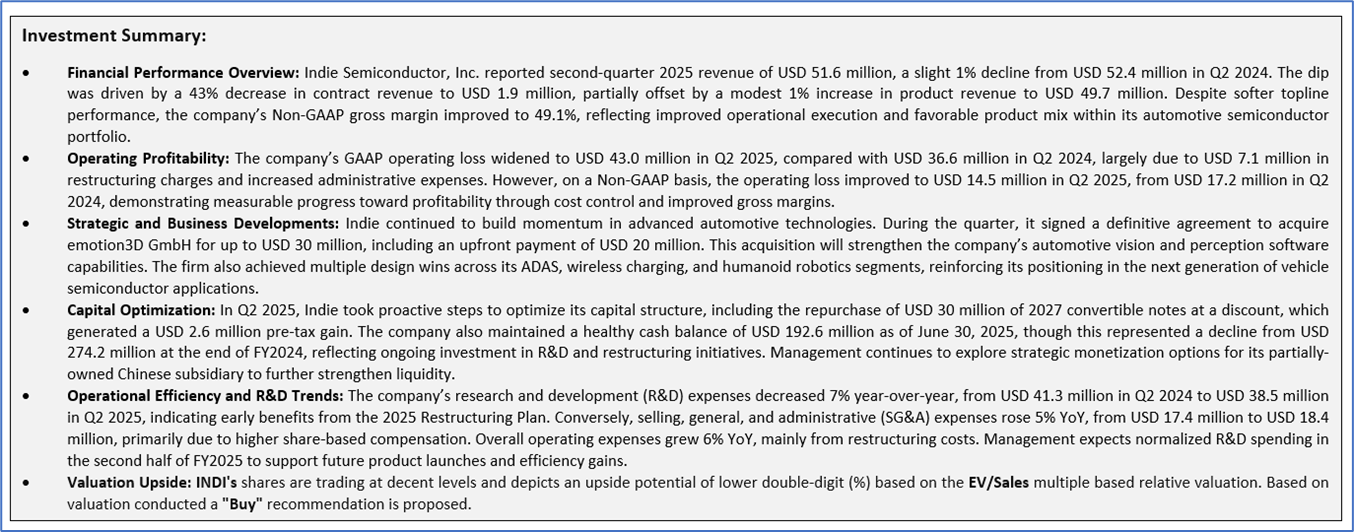
1.2 The Key Positives, Negatives, and Investment summary
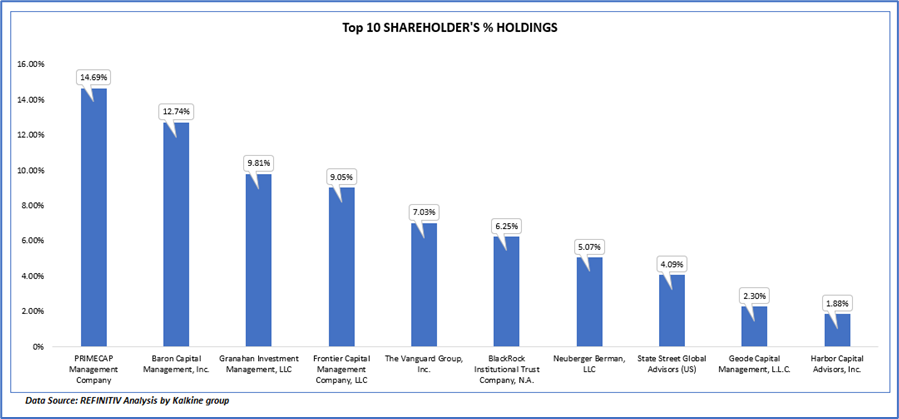
1.3 Top 10 shareholders:
The top 10 shareholders together form ~72.91% of the total shareholding, signifying concentrated shareholding. PRIMECAP Management Company and Baron Capital Management, Inc. are the biggest shareholders, holding the maximum stake in the company at ~14.69% and ~12.74%, respectively.
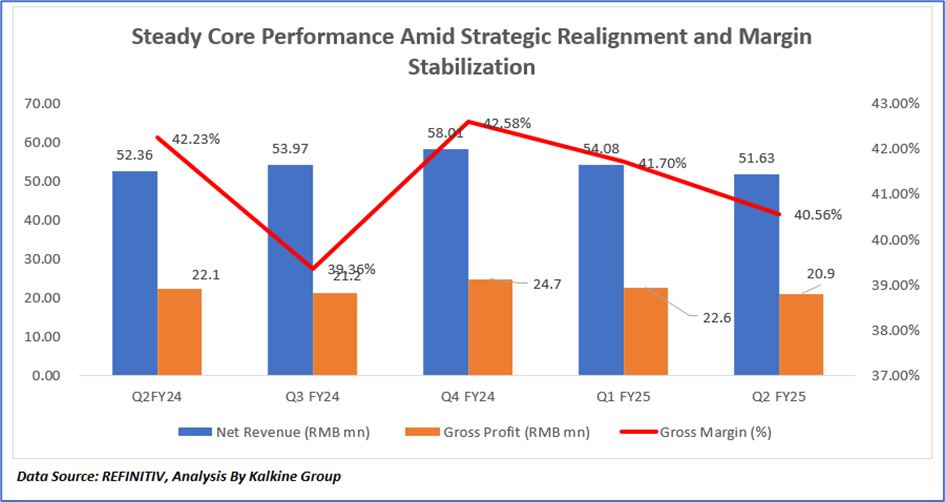
1.4 Key Metrics:
The chart illustrates a softening trend in Indie Semiconductor’s financial performance from Q4 FY24 through Q2 FY25, characterized by moderating revenue, declining gross profit, and a gradual compression in gross margins. After peaking at USD 58.0 million in Q4 FY24, revenue fell to USD 54.1 million in Q1 FY25 and further to USD 51.6 million in Q2 FY25, largely due to a slowdown in contract revenue as customer development projects tapered off, even as product sales in ADAS and vision segments remained steady. Correspondingly, gross profit declined from USD 24.7 million to USD 20.9 million, reflecting reduced contribution from higher-margin services. Gross margin decreased from 42.6% in Q4 FY24 to 40.6% in Q2 FY25, driven by an unfavorable shift in product mix toward lower-margin components, underutilization of manufacturing capacity amid softer sales, and minor foreign exchange effects. Compared to Q2 FY24, margins also eased by nearly 170 basis points, highlighting the impact of transitional restructuring and product realignment. Overall, the observed trend signifies a period of normalization following a strong finish to FY24, with near-term margin pressure stemming from cyclical and strategic adjustments rather than underlying demand weakness in the company’s core automotive semiconductor business.
Section 2: Business Updates and Financial Highlights
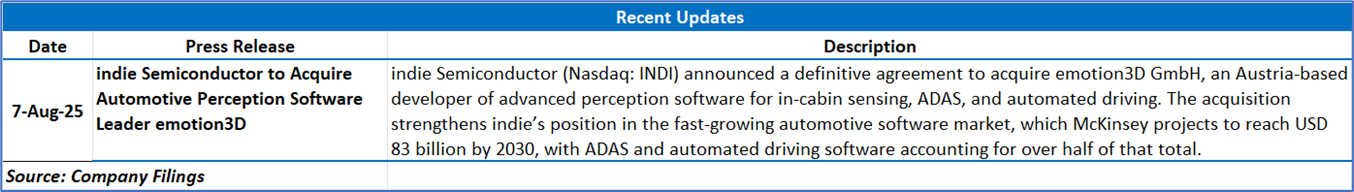
2.1 Recent Updates:
The below picture gives an overview of the recent updates:
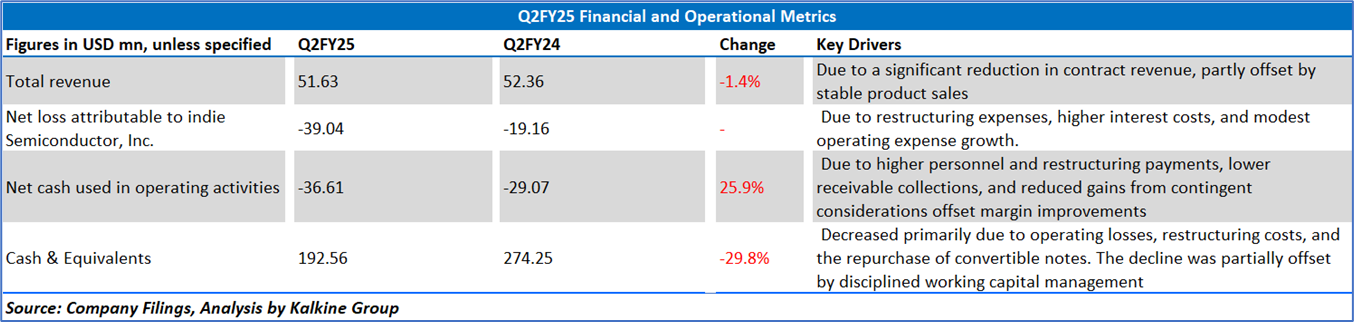
2.2 Insights of Q2FY25:
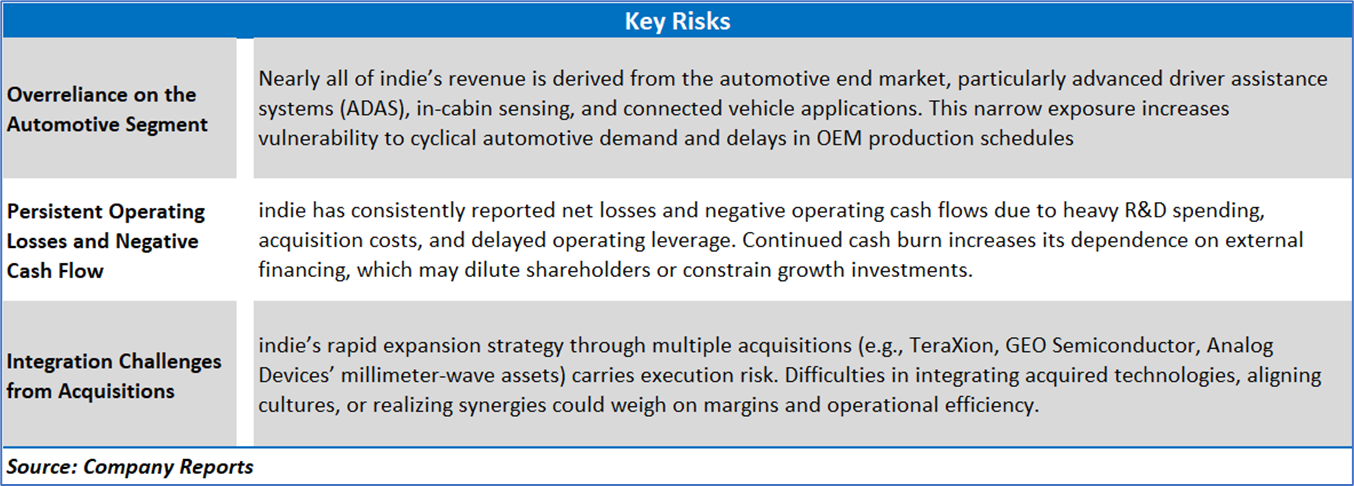
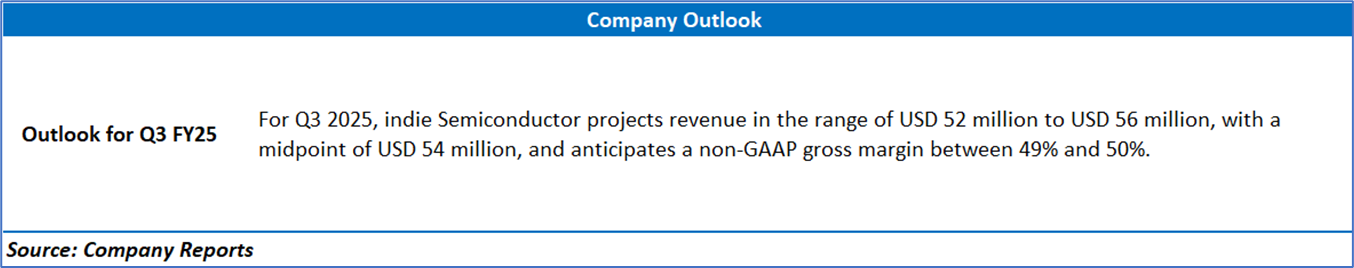
Section 3: Key Risks and Outlook:
Section 4: Stock Recommendation Summary:
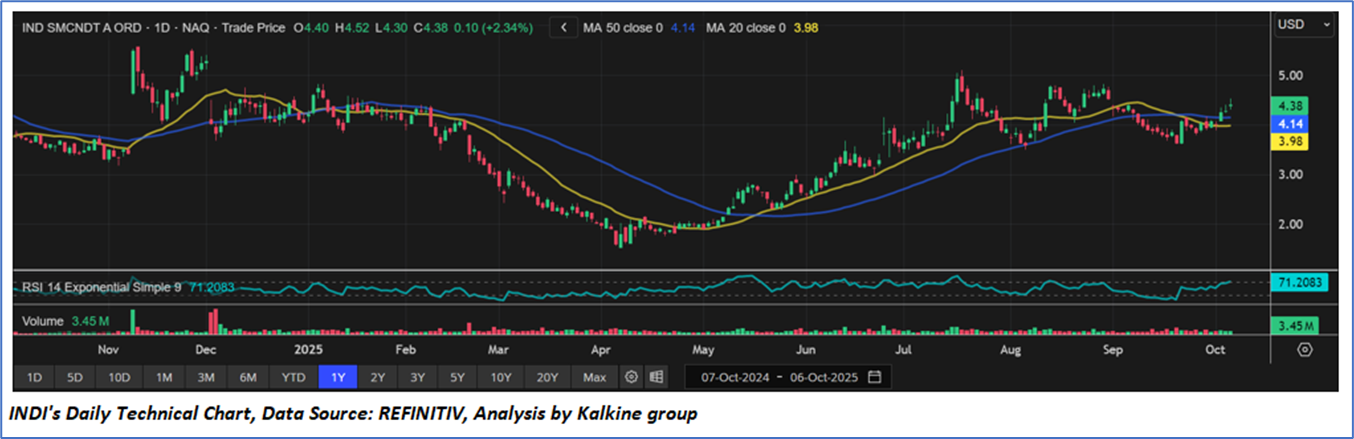
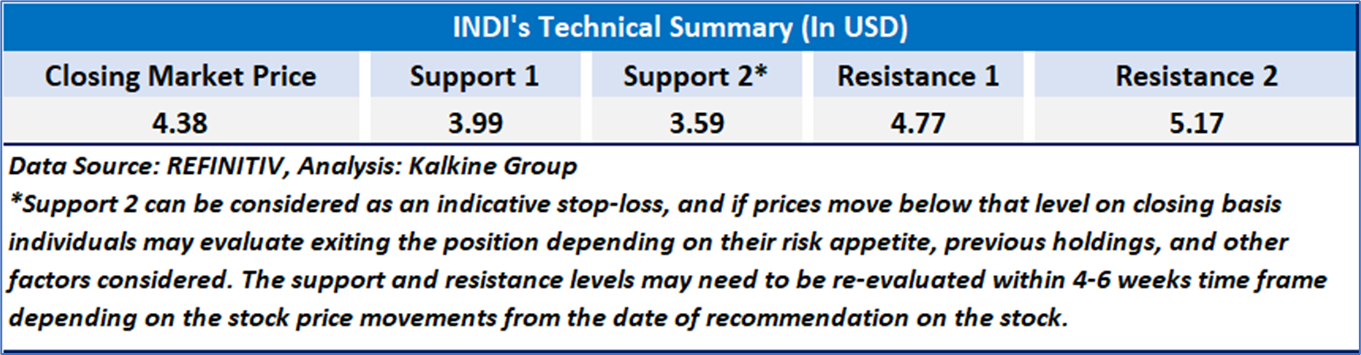
4.1 Technical Summary:
Price Performance:
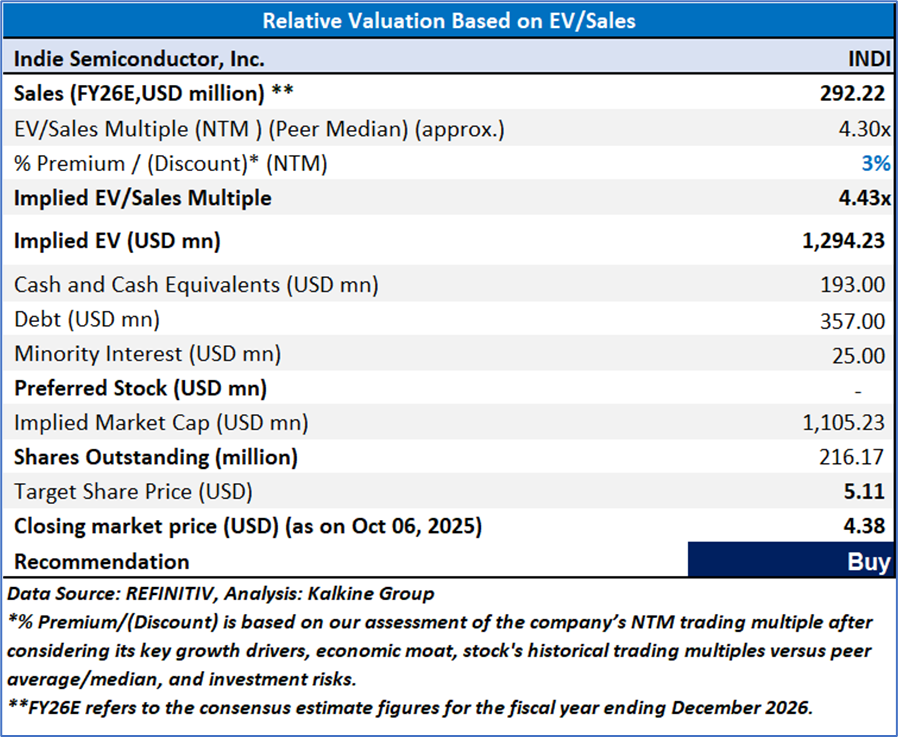
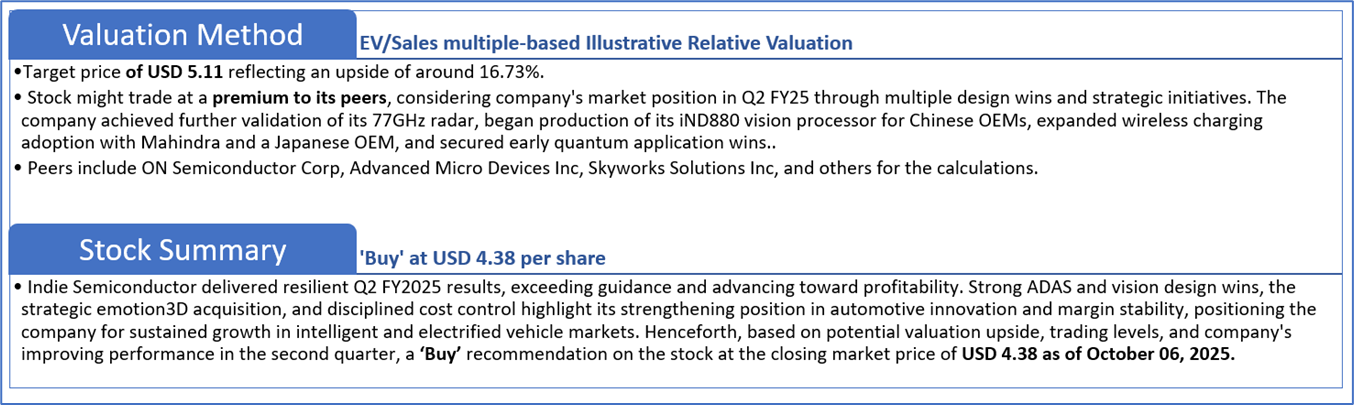
4.2 Fundamental Valuation
Valuation Methodology: EV/EBITDA Multiple Based Relative Valuation
Markets are trading in a highly volatile zone currently due to certain macroeconomic issues and geopolitical tensions prevailing. Therefore, it is prudent to follow a cautious approach while investing.
Note 1: Past performance is not a reliable indicator of future performance.
Note 2: The reference date for all price data, currency, technical indicators, support, and resistance levels is October 06, 2025. The reference data in this report has been partly sourced from REFINITIV.
Note 3: Investment decisions should be made depending on an individual's appetite for upside potential, risks, holding duration, and any previous holdings. An 'Exit' from the stock can be considered if the Target Price mentioned as per the Valuation and or the technical levels provided has been achieved and is subject to the factors discussed above.
Note 4: The report publishing date is as per the Pacific Time Zone.
Technical Indicators Defined: -
Support: A level at which the stock prices tend to find support if they are falling, and a downtrend may take a pause backed by demand or buying interest. Support 1 refers to the nearby support level for the stock and if the price breaches the level, then Support 2 may act as the crucial support level for the stock.
Resistance: A level at which the stock prices tend to find resistance when they are rising, and an uptrend may take a pause due to profit booking or selling interest. Resistance 1 refers to the nearby resistance level for the stock and if the price surpasses the level, then Resistance 2 may act as the crucial resistance level for the stock.
Stop-loss: It is a level to protect against further losses in case of unfavorable movement in the stock prices.
Disclaimer This report has been issued by Kalkine New Zealand Limited (FSP691351) (NZBN:9429047678101) (“Kalkine”). Kalkine is a Financial Advice Provider (“FAP”) and is authorised by a Class 1 Financial Advice Provider Licence issued by Financial Markets Authority (“FMA”) to provide financial advice. Kalkine provides only general financial advice through its research reports following a person becoming a member. The reports contain buy/sell/hold and other recommendations in relation to equity securities, managed funds and other managed investment schemes and other financial advice products. The recommendations and opinions in this report and on Kalkine website do not take into account any of your investment objectives, financial situation or needs. Before you make a decision about whether to acquire a financial product, you should obtain the Product Disclosure Statement from the product issuer. You should consider the appropriateness of advice taking into account your own objectives, financial situation and needs and seek independent financial advice before making any financial decisions. If you act on the advice in the research reports, you may have to pay fees, expenses or other amounts (but not to Kalkine). Further information about the complaints and dispute resolution process, as well as information about Kalkine’s duties are available on Kalkine’s website. Please read our Financial Advice Provider (FAP) disclosure statement and Complaints Handling Guide, which are available on the website.
Past performance is not a reliable indicator of future performance.
 Please wait processing your request...