
This report is an updated version of the report published on 18 June 2025 at 11:30 AM AEST.
Section 1: Company Overview and Fundamental Insights
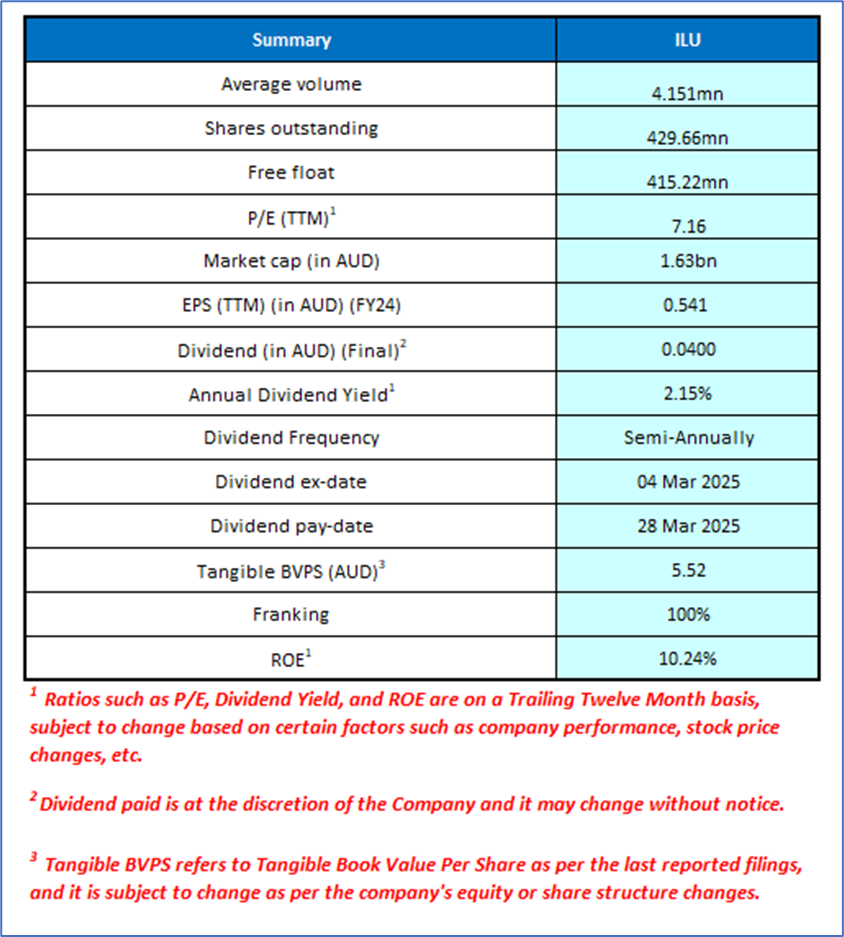
1.1 Company Overview: Iluka Resources Ltd (ASX: ILU) is an Australian-based international mineral sands entity. It specializes in the exploration, project development, mining, processing, and marketing of high-quality zircon and titanium dioxide feedstocks, which are essential for ceramics, paints, plastics, and paper production. Iluka is also expanding into the rare earths sector, positioning itself as a critical supplier of materials essential for electric vehicles, wind turbines, and defense technologies. Kalkine’s Resources Report covers the Investment Highlights, Management Insights, Key Financial Metrics, Risks, Technical Analysis along with the Valuation, Target Price, and Recommendation on the stock.
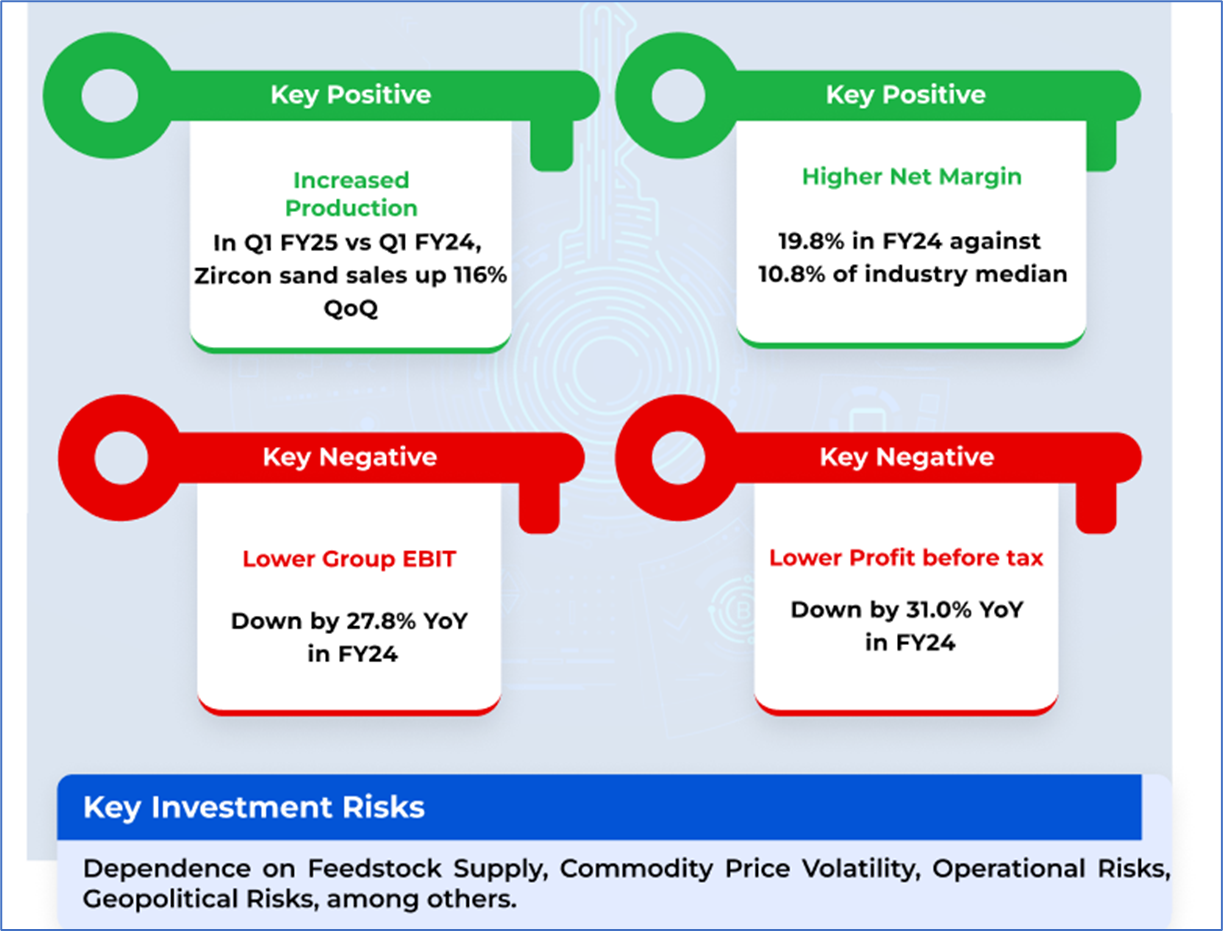
1.2 The Key Positives, Negatives, Investment Highlights, and Management Insights
1.3 Top 10 Shareholders:
The top 10 shareholders together form 48.10% of the total shareholding. Yarra Funds Management Limited and Aware Super hold maximum stakes in the company at 7.33% and 6.10%, respectively.

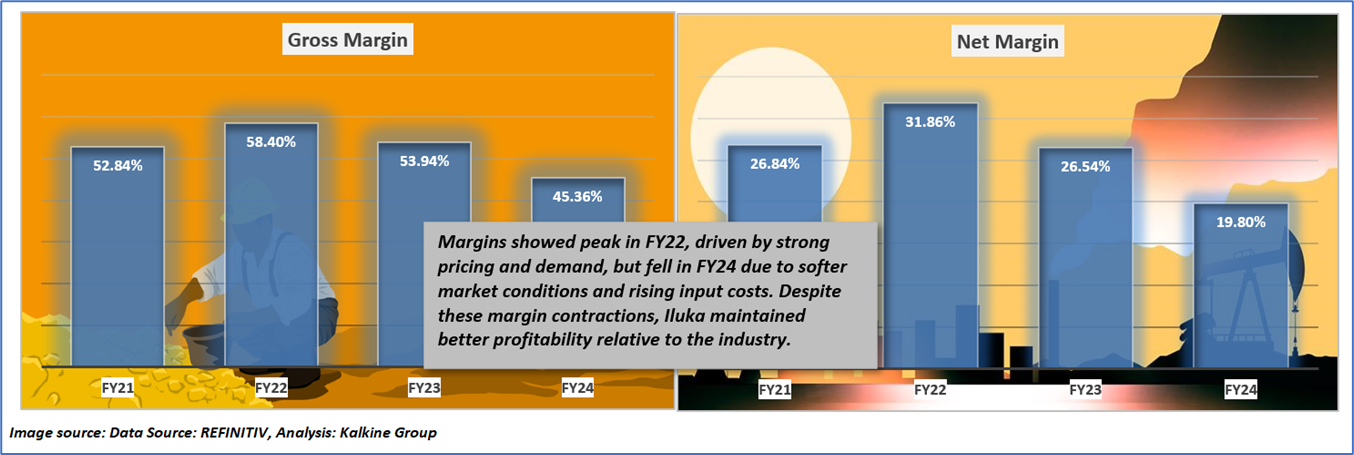
1.4 Key Metrics: Between FY21 and FY24, Iluka Resources’ gross margin reached its highest point in FY22 at around 58.40%, supported by favorable pricing and steady demand, before gradually easing to about 45.36% in FY24 due to softer market conditions and increased operating expenses. The net margin showed a similar pattern, rising to approximately 31.86% in FY22 and then declining to near 19.80% in FY24, influenced by lower sales volumes, higher costs, and ongoing investments in projects such as Balranald and Eneabba. While margins have decreased over this period, the company has maintained consistent profitability. Below are captured some key metrics:
Section 2: Business Updates, Financial and Operational Highlights
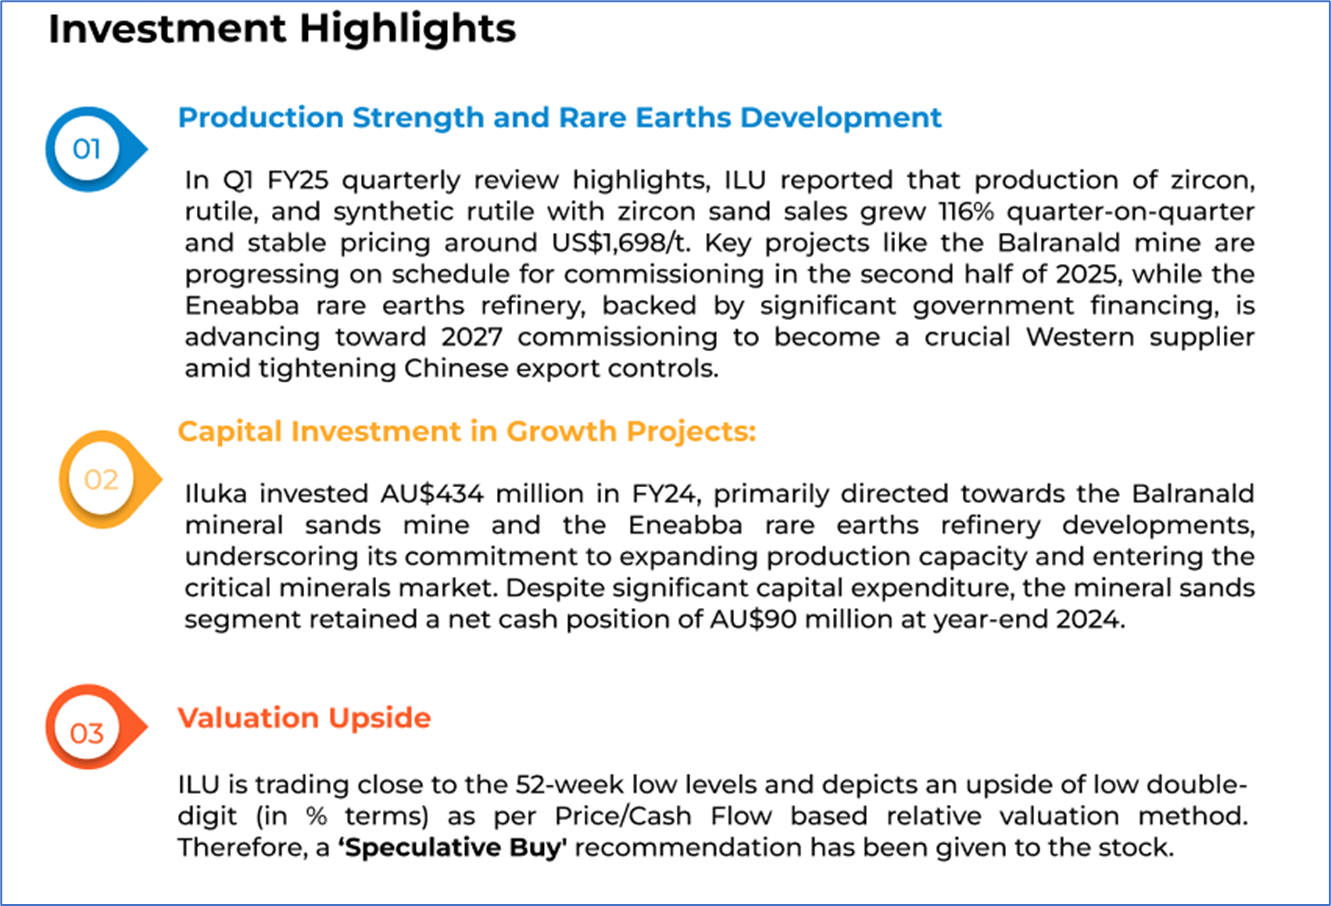
2.1 Recent Business Updates:

2.2 Financial Highlights: Below mentioned are some key financial highlights:

2.3 Historical Financial Trend

Section 3: Key Risks and Outlook:


Section 4: Stock Recommendation Summary
4.1 Price Performance and Technical Summary
The stock price has declined by approximately 3.12% over the past month and has corrected around 26.92% over the last six months. The stock has a 52-week low and 52-week high of AUD 3.140 and AUD 7.200, respectively, and is currently trading close to its 52-week low level. ILU was previously covered in a report dated ’21 May 2025’.

(Source: REFINITIV; Analysis by Kalkine Group)

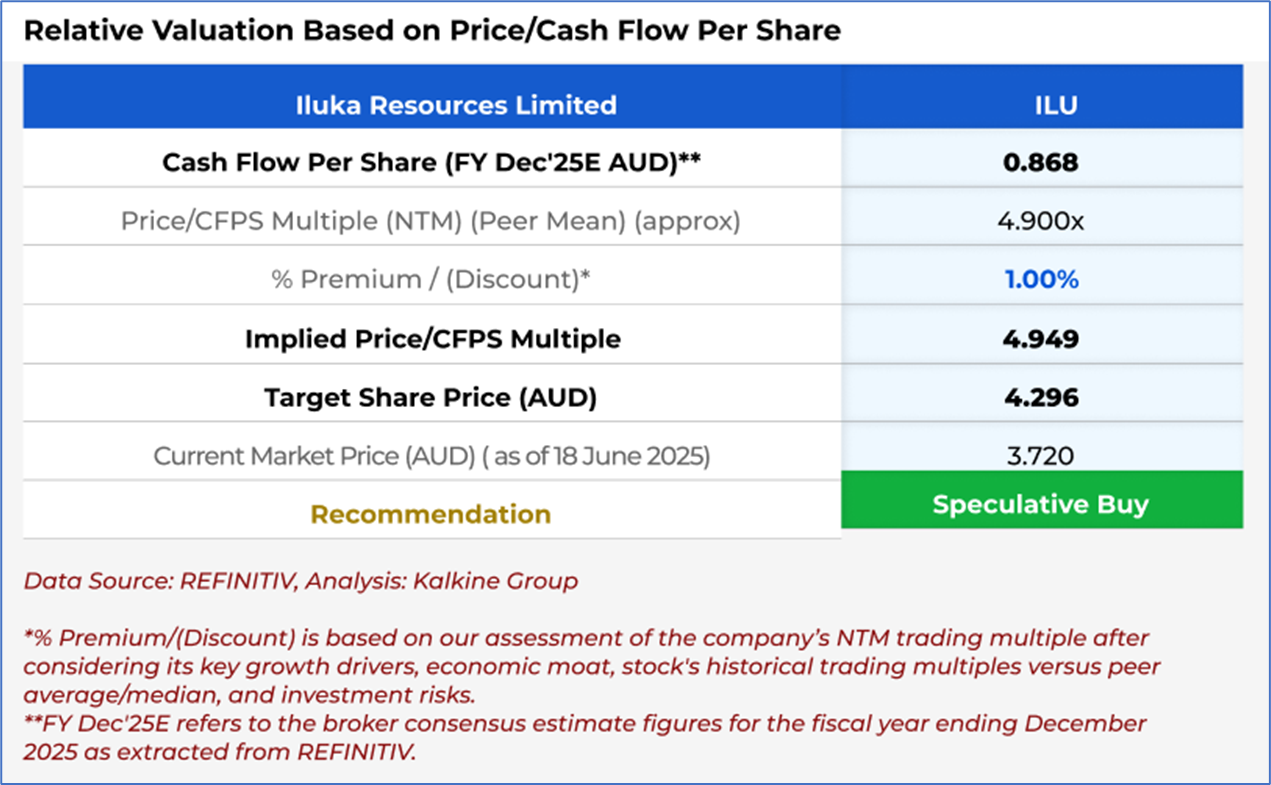
4.2 Fundamental Valuation
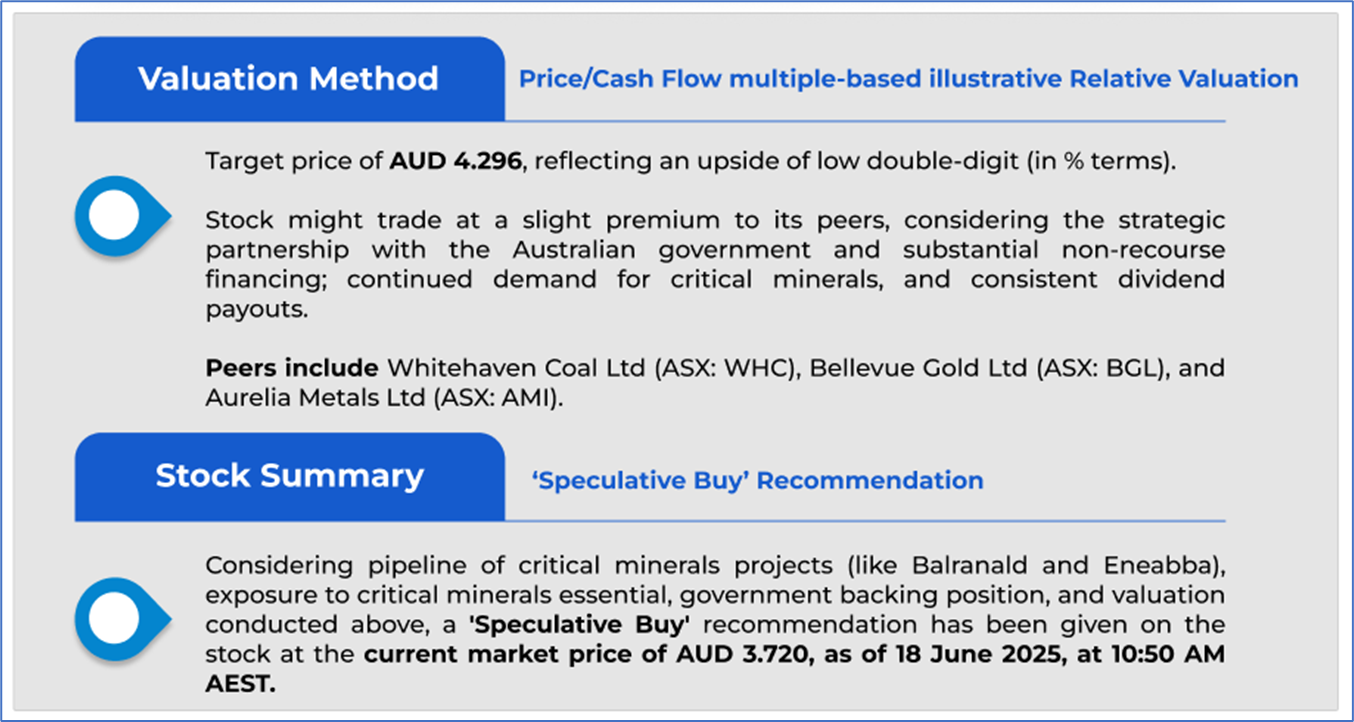
Valuation Methodology: Price/Cash Flow Multiple Based Relative Valuation (Illustrative)
Markets are trading in a highly volatile zone currently due to certain macro-economic issues and geopolitical tensions prevailing. Therefore, it is prudent to follow a cautious approach while investing.
Note 1: Past performance is neither an indicator nor a guarantee of future performance.
Note 2: The reference date for all price data, currency, technical indicators, support, and resistance levels is 18 June 2025. The reference data in this report has been partly sourced from REFINITIV.
Note 3: Investment decisions should be made depending on an individual's appetite for upside potential, risks, holding duration, and any previous holdings. An 'Exit' from the stock can be considered if the Target Price mentioned as per the Valuation and or the technical levels provided has been achieved and is subject to the factors discussed above.
Note 4: Dividend Yield may vary as per the stock price movement.
Note 5: Kalkine reports are prepared based on the stock prices captured either from REFINITIV or Trading View. Typically, REFINITIV or Trading View may reflect stock prices with a delay which could be a lag of 25-30 minutes. There can be no assurance that future results or events will be consistent with the information provided in the report. The information is subject to change without any prior notice.
Technical Indicators Defined: -
Support: A level at which the stock prices tend to find support if they are falling, and a downtrend may take a pause backed by demand or buying interest. Support 1 refers to the nearby support level for the stock and if the price breaches the level, then Support 2 may act as the crucial support level for the stock.
Resistance: A level at which the stock prices tend to find resistance when they are rising, and an uptrend may take a pause due to profit booking or selling interest. Resistance 1 refers to the nearby resistance level for the stock and if the price surpasses the level, then Resistance 2 may act as the crucial resistance level for the stock.
Stop-loss: It is a level to protect further losses in case of unfavourable movement in the stock prices.
Disclaimer This report has been issued by Kalkine New Zealand Limited (FSP691351) (NZBN:9429047678101) (“Kalkine”). Kalkine is a Financial Advice Provider (“FAP”) and is authorised by a Class 1 Financial Advice Provider Licence issued by Financial Markets Authority (“FMA”) to provide financial advice. Kalkine provides only general financial advice through its research reports following a person becoming a member. The reports contain buy/sell/hold and other recommendations in relation to equity securities, managed funds and other managed investment schemes and other financial advice products. The recommendations and opinions in this report and on Kalkine website do not take into account any of your investment objectives, financial situation or needs. Before you make a decision about whether to acquire a financial product, you should obtain the Product Disclosure Statement from the product issuer. You should consider the appropriateness of advice taking into account your own objectives, financial situation and needs and seek independent financial advice before making any financial decisions. If you act on the advice in the research reports, you may have to pay fees, expenses or other amounts (but not to Kalkine). Further information about the complaints and dispute resolution process, as well as information about Kalkine’s duties are available on Kalkine’s website. Please read our Financial Advice Provider (FAP) disclosure statement and Complaints Handling Guide, which are available on the website.
Past performance is not a reliable indicator of future performance.
 Please wait processing your request...