
1. Sector Landscape and Outlook
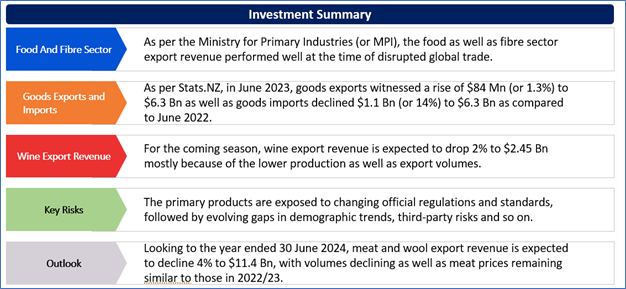
As per the Ministry for Primary Industries (or MPI), the food as well as fibre sector export revenue performed well at the time of disrupted global trade. Food and fibre sector exports might increase 6% to $56.2 billion for the year ended 30 June 2023. Looking forward to the year ended 30 June 2024, food and fibre sector export revenue has been forecasted to remain flat at $56.2 billion, with strengthening export revenue in dairy, forestry, horticulture and seafood sectors offsetting lower export revenue in meat and wool and processed food and other products sectors.
Amidst the challenges, the food and fibre sector has been showing resilience and resourcefulness. Notably, farmers, growers and fishers managed to navigate production, harvest, processing as well as freight challenges, allowing market opportunities and increased export prices early in the season to be capitalised on. The dairy, seafood and processed food and other products sectors witnessed increased revenues because of weaker NZD against the USD, which finally created favourable conditions for the exporters.
Dairy Extended its Lead in Export Values in October 2022
As per Stats.NZ, in June 2023, goods exports witnessed a rise of $84 Mn (or 1.3%) to $6.3 Bn as well as goods imports declined $1.1 Bn (or 14%) to $6.3 Bn as compared to June 2022. Notably, the monthly trade balance was the surplus of $8.8 Mn. Milk powder, butter, and cheese (the largest export commodity group) increased $170 Mn (or 11%) to $1.8 Bn. With respect to imports, the petroleum and products were the largest contributor to the decline in imports in the month of June 2023.
In June 2023 quarter, goods exports increased $757 Mn (or 4.3%) after the 3.8% decline in the March 2023 quarter. Notably, goods imports declined $1.6 Bn (or 6.9%) after little change in the quarter ended March 2023.
Exhibit 1: Merchandise trade values ($ Bn), Exports and Imports, June months, 2015–2023
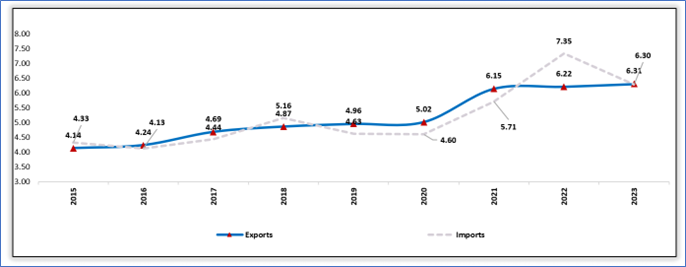
Data Source: This work is based on/includes Stats NZ’s data which are licensed by Stats NZ for reuse under the Creative Commons Attribution 4.0 International Licence; Chart Created by Kalkine Group
Robust Consumer Demand Are Supporting the Wine Pricing
For the coming season, wine export revenue is expected to drop 2% to $2.45 Bn mostly because of the lower production as well as export volumes. Some production was lost because of Cyclone Gabrielle, and yields in Marlborough declined back towards long-run averages.
The prices are being supported by robust consumer demand as well as the inflationary environment in the critical destination markets. Also, there is the marginal shift away from the lower-priced bulk exports and towards bottling in NZ prior to export. The US remained the leading export market with robust growth YoY. The US market made up ~36% of wine exports and $868 Mn in the year ended March 2023. This market alone could surpass $1 Bn within the time span of next few years.
Exhibit 2: Trend in Wine Export Revenue (Year to 30 June, NZ$ million)
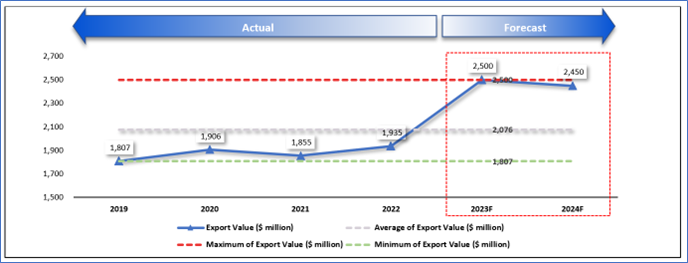
Data Source: This work is based on/includes the Ministry for Primary Industries data which are licensed under Crown for reuse under the Creative Commons Attribution 4.0 International Licence; Chart Created by Kalkine Group
Higher Seafood Exports
Seafood exports have witnessed a rise with food service reopening as well as demand rebounding and have been supported by the tight supplies. Growth was because of export revenue increases for rock lobster, hoki as well as squid categories, although ongoing freight issues and uncertainty around the accessibility of key markets are some challenges in the short term.
The long-term outlook for the seafood industry remained positive and revenue forecast is expected to be supported by the increased demand and prices. The recovery from the COVID-19 pandemic as well as key deployments towards aquaculture are anticipated to support growth by slowly contributing to higher export volumes.
Exhibit 3: Trend in Seafood Export Value 2019–26Forecast (F) (Year to 30 June, NZ$ Mn)
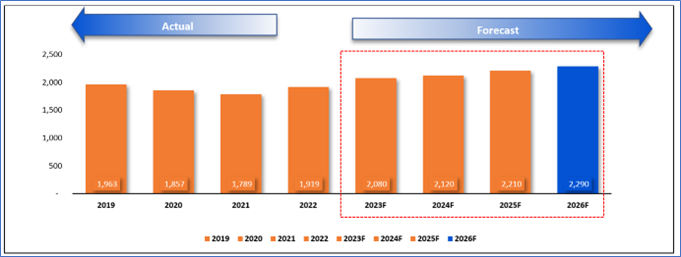
Data Source: This work is based on/includes the Ministry for Primary Industries data which are licensed under Crown for reuse under the Creative Commons Attribution 4.0 International Licence; Chart Created by Kalkine Group
Key Risks and Challenges:
Farmers, growers, and fishers have been challenged by rapid changes in climate in the past years, disrupting the operations and the quality of output. Despite increased seafood prices, a significant rise in input costs, specifically higher than average fuel prices, is impacting the profitability of businesses. Moreover, ongoing freight issues as well as uncertainty around the accessibility of key markets are some challenges. Notably, the future growth of the seafood industry would be facing challenges from climate change as well as the ongoing transformation of aquaculture is important for the future expansion.
Exhibit 5. Key Risks in Consumer Staples Sector:
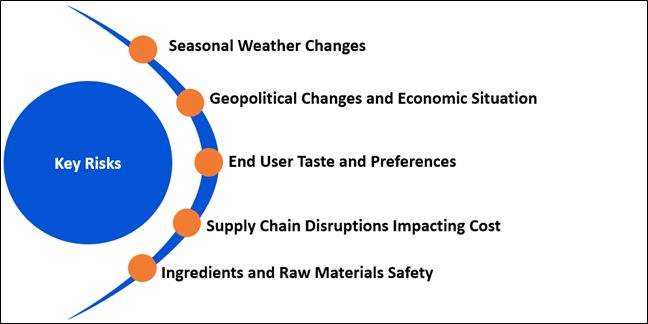
Source: Analysis by Kalkine Group
Outlook:
Looking to the year ended 30 June 2024, meat and wool export revenue is expected to decline 4% to $11.4 Bn, with volumes declining as well as meat prices remaining similar to those in 2022/23. As per MPI, horticulture export revenue is expected to surpass $7 Bn in 2023/24 because of anticipated recovery in kiwifruit crop volumes in 2024. Production as well as exports of apples and pears, the sector which was significantly impacted by Cyclone Gabrielle, are expected to increase gradually. For the year ended 30 June 2024, little change is anticipated in the arable export revenue, with increases in export clover seed volumes as well as vegetable seed prices offsetting the decline in ryegrass seed revenue.
Generally, there are expectations that global inflation would be decreasing but at the slower pace than originally anticipated. In particular, the IMF anticipates that it would decline from 8.7% in 2022 to 7.0% this year and 4.9% in 2024. However, it is unlikely that inflation would be returning to its target level before 2025 in most of the countries.
Apart from the sector-specific factors, an analysis on three NZX-listed companies is provided. This report covers their insights, outlook, performance and potential as expected to be delivered in the near to medium term.
1) New Zealand King Salmon Investments Limited (Recommendation: Speculative Buy, Potential Upside: Low Double-Digit) (M-Cap: NZD108.2 million)
Business Description:
New Zealand King Salmon Investments Limited (NZX: NZK) is the world's largest aquaculture producer of King salmon, supplying salmon under 3 key brands: Ora King, Regal and Southern Ocean.
Outlook:
NZK is expecting pro-forma EBITDA guidance of $21 Mn - $25 Mn (NZK is no longer reversing out NZ IFRS 16 costs resulting in ~$1.4 Mn increase in guidance range). Notably, harvest in FY 2024 is expected to be ~6,600 MT.
Valuation Methodology: Price/Earnings Per Share Based Relative Valuation (Illustrative)
.png)
Technical Overview:
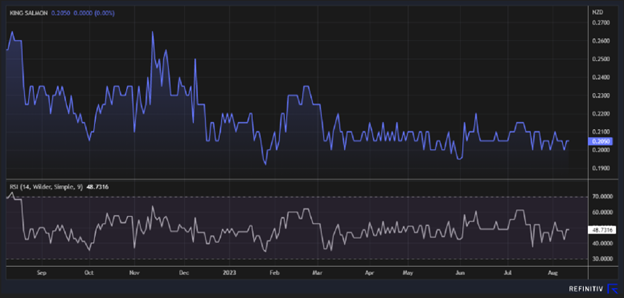
Source: REFINITIV, Note: Purple color line reflects Relative Strength Index (14-Period)
Technical Commentary
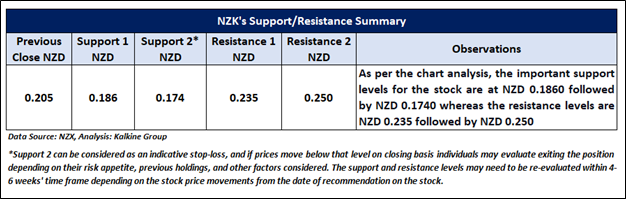
On the daily chart, NZK prices are trading near the rising trendline support zone. Moreover, the momentum oscillator RSI (14-period) is showing a reading of ~48.7316 level. However, the prices are trading below the trend-following indicators 21-period SMA, which may act as a resistance zone. An important support level for the stock is placed at NZD 0.186 while the key resistance level is placed at NZD 0.235.
Stock Recommendation
The stock has been valued using P/E multiple-based illustrative relative valuation, and the target price so arrived reflects a rise of low double-digit (in % terms).
Considering the facts above, a ‘Speculative Buy’ recommendation on the stock has been provided at the closing market price of NZD 0.205 per share as on 10 August 2023.
2) Foley Wines Limited (Recommendation: Speculative Buy, Potential Upside: Low Double-Digit) (M-Cap: NZD 85.45 Mn)
Business Description:
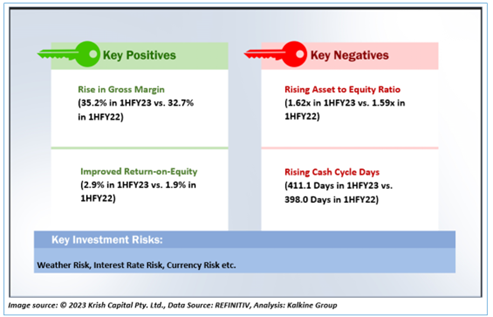
Outlook:
The company is focusing towards finding new routes to market for the brands globally, and in particular those partners who can sell a premium portfolio. It has established some robust global partnerships that would certainly help in navigating its way through the headwinds in the global economy.
Technical Overview:
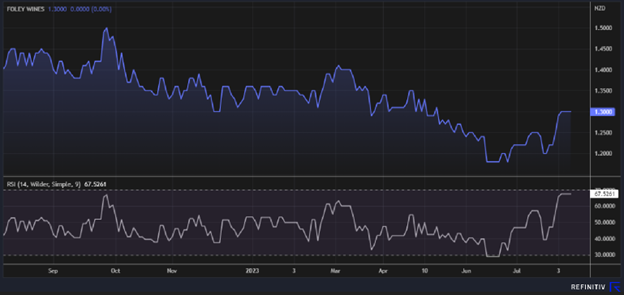
Source: REFINITIV, Note: Purple color line reflects Relative Strength Index (14-Period)
Technical Commentary:
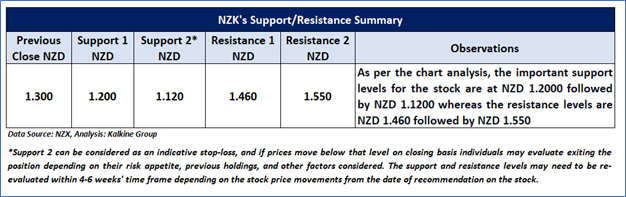
On the daily chart, FWL prices are sustaining above the falling trendline support level and taking support from the trendline. Moreover, the momentum oscillator RSI (14-period) is showing a reading of ~67.5261 level. Further, the prices are trading above the trend-following indicators 21-period SMA, which may act as a support zone. An important support level for the stock is placed at NZD 1.20 while the key resistance level is placed at NZD 1.46.
Stock Recommendation
Considering the facts above, a ‘Speculative Buy’ recommendation on the stock has been provided at the closing market price of NZD 1.30 per share as on 9 August 2023.
Note 1: Past performance is not a reliable indicator of future performance.
Note 2: The reference data in this report has been partly sourced from REFINITIV.
Note 3: Investment decisions should be made depending on an individual's appetite for upside potential, risks, holding duration, and any previous holdings. An 'Exit' from the stock can be considered if the Target Price mentioned as per the Valuation and or the technical levels provided has been achieved and is subject to the factors discussed above.
Note 4: Annual Dividend Yield is on a Trailing Twelve Month (TTM1) basis and are subject to change based on factors such as company performance, stock price changes, etc.
Technical Indicators Defined: -
Support: A level at which the stock prices tend to find support if they are falling, and a downtrend may take a pause backed by demand or buying interest. Support 1 refers to the nearby support level for the stock and if the price breaches the level, then Support 2 may act as the crucial support level for the stock.
Resistance: A level at which the stock prices tend to find resistance when they are rising, and an uptrend may take a pause due to profit booking or selling interest. Resistance 1 refers to the nearby resistance level for the stock and if the price surpasses the level, then Resistance 2 may act as the crucial resistance level for the stock.
Stop-loss: It is a level to protect further losses in case of unfavourable movement in the stock prices.
Disclaimer
Kalkine New Zealand Limited is a Financial Advice Provider (“FAP”) and is authorised by a Class 1 Financial Advice Provider Licence issued by Financial Markets Authority (“FMA”) to provide financial advice. Kalkine provides only general financial advice through its research reports following a person becoming a member. The reports contain buy/sell/hold and other recommendations in relation to equity financial products. The recommendations and opinions [on this website] / [in this report] do not take into account any of your investment objectives, financial situation or needs. Before you make a decision about whether to acquire a financial product, you should obtain the Product Disclosure Statement from the product issuer. You should consider the appropriateness of advice taking into account your own objectives, financial situation and needs and seek independent financial advice before making any financial decisions. If you act on the advice in the research reports, you may have to pay fees, expenses or other amounts (but not to Kalkine). Further information about the complaints and dispute resolution process, as well as information about Kalkine’s duties are available on Kalkine’s website. Please read our Financial Advice Provider (FAP) disclosure statement and Complaints Handling Guide, which are available on the website.
Past performance is not a reliable indicator of future performance.
 Please wait processing your request...