
Company Overview:
Scales Corporation Limited (NZX: SCL) is a diversified agribusiness portfolio. It comprises 3 operating divisions: Horticulture, Storage & Logistics and Food Ingredients. Foley Wines Limited (NZX: FWL) is an integrated wine company producing table wines with the marketing and sales of premium wines in New Zealand and various export markets.
Kalkine’s Sector Report covers the Key Financial Metrics, Risks, Outlook, Technical Analysis along with the Valuation, Target Price, and Recommendation on the stock.
As per SOPI (Situation and Outlook for Primary Industries) December 2024, the food and fibre sector made up 81.1% of NZ’s goods exports in the year ended 30 June 2024. Over the previous 10 years, food and fibre exports have grown on average by 3.2% per year whereas other goods exports have grown by 1.5%. The food and fibre sector made up 10.0% of NZ’s GDP in the year ended 31 March 2023. This figure presents only the direct contribution to GDP as well as includes both the production of primary products like dairy cattle farming and the subsequent processing and commercialisation industries including dairy product manufacturing.
As per SOPI December 2024, the dairy export revenue is expected to increase 10% to $25.5 Bn in the year ended 30 June 2025. This increase would be supported by a drop in export revenue in 2023/24. Global dairy prices are anticipated to be higher in 2024/25. This is because of a tight global supply from key dairy exporting regions like the US and the EU and strengthening global import demand.
Exhibit 1: Meat and Dairy Product Manufacturing Sales ($ Bn), Volumes, March 2024 – December 2024 Quarters
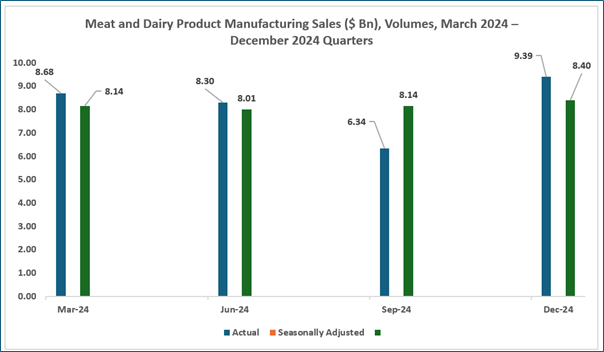
Data Source: This work is based on/includes Stats NZ’s data which are licensed by Stats NZ for reuse under the Creative Commons Attribution 4.0 International Licence; Chart Created by Kalkine Group
Trends in Wine Production
SOPI December 2024 revealed that wine export revenue declined 13% to $2.1 Bn in the year ended 30 June 2024 as global wine retailers underwent a destocking process. During the COVID-19 pandemic, the retailers decided to hold increased levels of inventory to build resilience against the supply chain disruptions. Now, these global retailers continue to destock inventories, resulting in a short-term reduction in demand for NZ wine.
While the short-term challenges have been constraining the export volumes and profitability, the outlook for the medium to long term remains positive, with underlying consumer demand for NZ wine remaining strong. Notably, NZ wine sales are growing in key markets amidst challenges like constrained disposable income as well as changes in consumer preferences.
Exhibit 2: Grape Production and Wine Production (2022 - 2026) (Year Ended June 30)
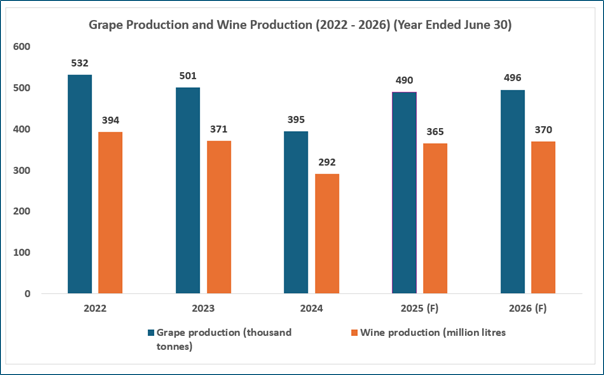
Data Source: This work is based on/includes MPI data which is licensed by Ministry for Primary Industries (MPI) for reuse under the Creative Commons Attribution 4.0 International Licence; Chart Created by Kalkine Group, 2025 (F) and 2026 (F) represent forecasted figures
NZ Farm Input Costs
The NZ farm expenses price index fell by 0.1% from the September quarter of 2023 to the September quarter of 2024. While the decline reflects a shift from the steep 15.0% increase witnessed in the 12 months ended September 2022 and 4.5% increase in the 12 months to September 2023, farm expenses have remained elevated. In the 12 months ended September 2024, the biggest increases in expenses were witnessed in the insurance premiums, freight, animal health and breeding, lime, as well as local and central government rates and fees. However, the increase in expenses for some items was offset by decline in expenses for others.
Key Risks and Challenges:
RBNZ recently stated that the announced increases in global trade barriers weaken the outlook for the broader global economic activity. On balance, such developments result in creating downside risks to the outlook for economic activity and inflation in NZ. Notably, the household spending as well as residential investment have been weaker than anticipated. As per the release by RBNZ, numerous factors resulting from tariff increases can put upward pressure on global prices in the medium term. Notably, the prices would rise in tariff-imposing countries, implying the higher cost of imports.
Exhibit 3. Key Risks in Consumer Staples Sector:
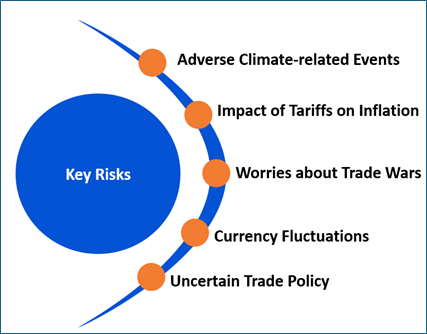
Source: Analysis by Kalkine Group
Outlook:
As per SOPI December 2024, the fresh and processed vegetable export revenue is expected to increase 7%, reaching $770 Mn. Notably, the fresh vegetable exports are projected to fuel growth, with revenue forecast to increase 17%, while processed vegetable exports are anticipated to remain unchanged. Notably, high yields as well as quality are projected to increase exports of onions, squash, and other fresh vegetables, aided by healthy demand, recent trade agreements with key markets (EU, Indonesia, and East and West Asia) as well as expanded access to China and Vietnam.
The Kiwifruit export revenue is expected to rise by 38% in the 2024/25 season (ending 31 March) to $3.5 Bn, as per SOPI December 2024. The 2024/25 season would mark the first time kiwifruit exports surpass $3 billion. The export volumes are expected to grow by 38% YoY, increasing from 141 Mn trays in 2023/24 to 194 Mn in 2024/25. The gold kiwifruit exports are projected to increase from 97 Mn to 128 Mn trays, a rise of 32%, while green kiwifruit exports are expected to increase from 44 Mn to 64 Mn trays, up by 46%. The strong demand, mainly in European markets, helped prices throughout the first 2 quarters of the 2024/25 season (March through September).
Apart from the sector-specific factors, an analysis on 2 NZX-listed companies is provided. This report covers their insights, outlook, performance and potential as expected to be delivered in the near to medium term.
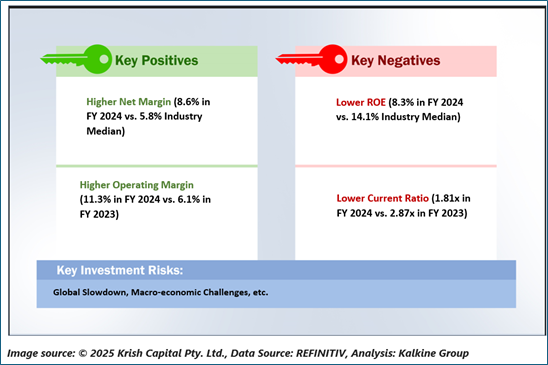
1) Scales Corporation Limited (Recommendation: Hold, Potential Upside: Low Double-Digit) (M-Cap: NZD 600.12 Mn, Annual Dividend Yield: 3.82%)
Business Description:
Scales Corporation Limited (NZX: SCL) is a diversified agribusiness portfolio. It comprises 3 operating divisions: Horticulture, Storage & Logistics and Food Ingredients.
Outlook:
Scales Group sales from exports to the US in FY2024 were less than 10% of Group revenue and are anticipated to be lower than this in FY 2025. The impact on earnings is currently expected to be minimal. Also, there is no change to current earnings guidance for FY 2025. The company continues to have a robust financial position, with net cash of $12.5 Mn as at 31 December 2024. Notably, a continuation of FY 2024’s robust financial performance is expected within the Global Proteins.
Technical Overview:
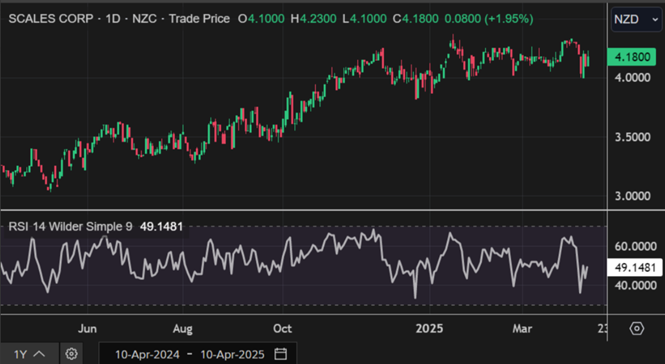
SCL Daily Technical Chart, Data Source: REFINITIV
Technical Commentary
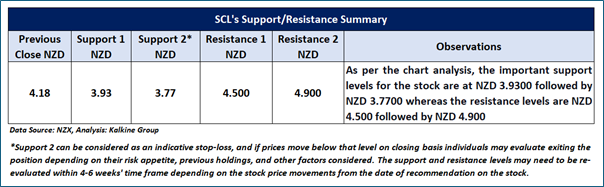
On the daily chart, SCL’s stock prices are from a trading range during an uptrend, indicating a positive bias. Moreover, the momentum oscillator RSI (14-period) is rebounding near its oversold region, providing further support to the previous observation. Prices are trading between its previous peak and trough, which might function as resistance and support levels for the stock, respectively. A significant support level for the stock is positioned at NZD 3.93, while critical resistance level is located at NZD 4.50.
Fundamental Valuation
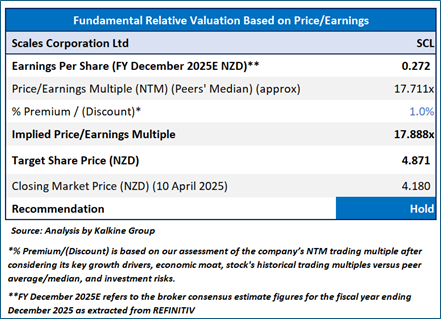
P/E Based Valuation
Stock Recommendation
Considering the facts above, a ‘Hold’ recommendation on the stock has been provided at the closing market price of NZD 4.18 per share, up by 1.95% as on 10 April 2025
2) Foley Wines Limited (Recommendation: Speculative Buy, Potential Upside: Low Double-Digit) (M-Cap: NZD 40.7 Mn)
Business Description:
Foley Wines Limited (NZX: FWL) is an integrated wine company producing table wines with the marketing and sales of premium wines in New Zealand and various export markets.
Outlook:
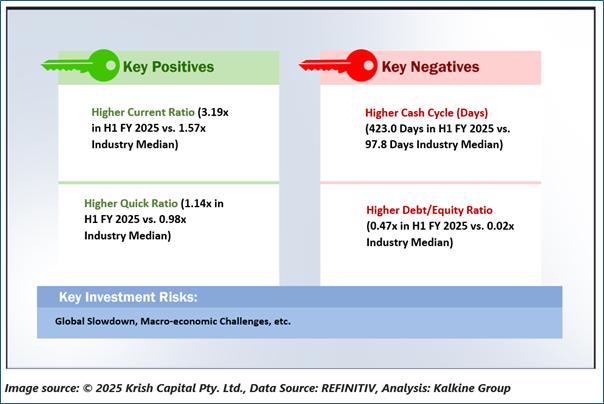
FWL is expecting a higher yield from the 2025 harvest in the Marlborough as well as Martinborough regions and slightly lower yield in Central Otago, which is still more than the long-term average, with the market price for Sauvignon Blanc grapes anticipated to be ~15% lower than the 2024 vintage. The company has worked to establish strong routes to market for its branded products. Notably, its inventory remains in good shape.
Technical Overview:
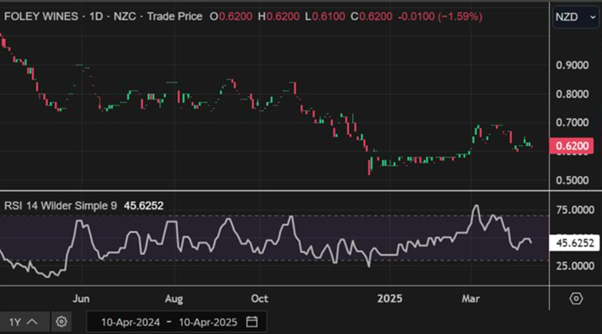
FWL Daily Technical Chart, Data Source: REFINITIV
Technical Commentary
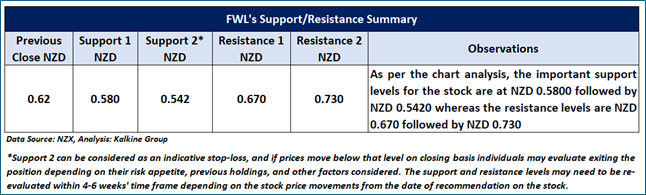
On the daily chart, FWL’s stock prices are forming a downtrend characterized by lower lows and lower highs, indicating a negative bias. Additionally, the momentum oscillator RSI (14-period) is trading below its midpoint, adding more support to the mentioned recommendation. Prices are trading between its previous peak and trough, which might function as a resistance and support levels for the stock, respectively. An important support level for the stock is situated at NZD 0.58, while crucial resistance level is placed at NZD 0.67
Stock Recommendation
Considering the facts above, a ‘Speculative Buy’ recommendation on the stock has been provided at the closing market price of NZD 0.62 per share, down by 1.59% as on 10 April 2025
Markets are trading in a highly volatile zone currently due to certain macro-economic issues and geopolitical tensions prevailing. Therefore, it is prudent to follow a cautious approach while investing.
Note 1: Past performance is not a reliable indicator of future performance.
Note 2: The reference date for all price data, currency, technical indicators, support, and resistance levels is April 10, 2025. The reference data in this report has been partly sourced from REFINITIV.
Note 3: Investment decisions should be made depending on an individual's appetite for upside potential, risks, holding duration, and any previous holdings. An 'Exit' from the stock can be considered if the Target Price mentioned as per the Valuation and or the technical levels provided has been achieved and is subject to the factors discussed above.
Note 4: Annual Dividend Yield is on a Trailing Twelve Month (TTM1) basis and are subject to change based on factors such as company performance, stock price changes, etc.
Note 5: Kalkine reports are prepared based on the stock prices captured either from REFINITIV or Trading View. Typically, REFINITIV or Trading View may reflect stock prices with a delay which could be a lag of 25-30 minutes. There can be no assurance that future results or events will be consistent with the information provided in the report. The information is subject to change without any prior notice.
Technical Indicators Defined: -
Support: A level at which the stock prices tend to find support if they are falling, and a downtrend may take a pause backed by demand or buying interest. Support 1 refers to the nearby support level for the stock and if the price breaches the level, then Support 2 may act as the crucial support level for the stock.
Resistance: A level at which the stock prices tend to find resistance when they are rising, and an uptrend may take a pause due to profit booking or selling interest. Resistance 1 refers to the nearby resistance level for the stock and if the price surpasses the level, then Resistance 2 may act as the crucial resistance level for the stock.
Stop-loss: It is a level to protect further losses in case of unfavourable movement in the stock prices.
Disclaimer This report has been issued by Kalkine New Zealand Limited (FSP691351) (NZBN:9429047678101) (“Kalkine”). Kalkine is a Financial Advice Provider (“FAP”) and is authorised by a Class 1 Financial Advice Provider Licence issued by Financial Markets Authority (“FMA”) to provide financial advice. Kalkine provides only general financial advice through its research reports following a person becoming a member. The reports contain buy/sell/hold and other recommendations in relation to equity securities, managed funds and other managed investment schemes and other financial advice products. The recommendations and opinions in this report and on Kalkine website do not take into account any of your investment objectives, financial situation or needs. Before you make a decision about whether to acquire a financial product, you should obtain the Product Disclosure Statement from the product issuer. You should consider the appropriateness of advice taking into account your own objectives, financial situation and needs and seek independent financial advice before making any financial decisions. If you act on the advice in the research reports, you may have to pay fees, expenses or other amounts (but not to Kalkine). Further information about the complaints and dispute resolution process, as well as information about Kalkine’s duties are available on Kalkine’s website. Please read our Financial Advice Provider (FAP) disclosure statement and Complaints Handling Guide, which are available on the website.
Past performance is not a reliable indicator of future performance.
 Please wait processing your request...