
Overview:
ANZ Group Holdings Limited (NZX: ANZ) is a non-operating holding company. Its divisions include Australia Retail, Australia Commercial, Institutional, New Zealand, Suncorp Bank, Pacific, and Group Center. Marlin Global Limited (NZX: MLN) is a listed investment company that invests in growing companies based outside of NZ and Australia.
Kalkine’s Sector Report covers the Key Financial Metrics, Risks, Outlook, Technical Analysis along with the Valuation, Target Price, and Recommendation on the stock.
Sector Landscape and Outlook
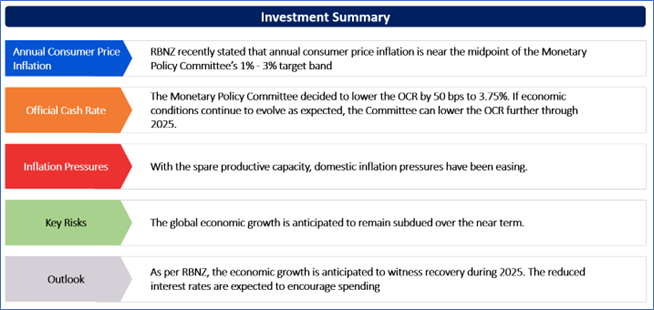
RBNZ recently stated that annual consumer price inflation is near the midpoint of the Monetary Policy Committee’s 1% - 3% target band. The firms’ inflation anticipations are at target as well as core inflation has been falling towards the target midpoint. Notably, the economic outlook is consistent with inflation remaining in the band over the medium term, providing confidence to continue lowering the OCR. The economic activity in NZ is subdued. With the spare productive capacity, domestic inflation pressures have been easing. Furthermore, the price as well as wage setting behaviours have been adapting to the low-inflation environment. Also, the price of imports has declined, contributing to lower headline inflation.
The Monetary Policy Committee decided to lower the OCR by 50 bps to 3.75%. If economic conditions continue to evolve as expected, the Committee can lower the OCR further through 2025.
Exhibit 1: OCR (%)
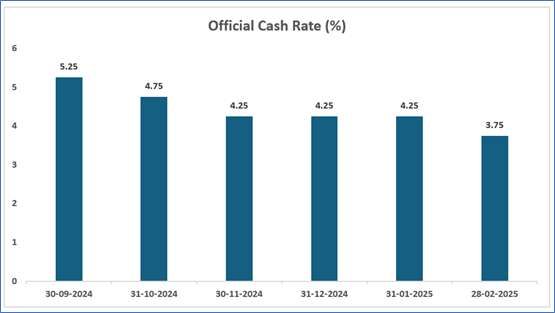
Data Source: This work is based on/includes rbnz data which are licensed by rbnz.govt.nz for reuse under the Creative Commons Attribution 4.0 International Licence; Chart Created by Kalkine Group
Sector Lending Summary – Banks & NBLIs (January 2025)
RBNZ released data about sector lending summary (Banks & NBLIs). The housing lending stock rose by $1.3 Bn (0.4%) in January 2025, down on the $1.7 Bn (0.4%) increase witnessed last month. The annual growth rate increased from 3.8% to 4.0%, demonstrating the highest point since January 2023. The personal consumer lending stock fell by $43 Mn (-0.3%) in January 2025. The monthly decrease was mainly because of a $72 Mn (-0.9%) decrease from registered banks. The annual growth rate was unchanged at 0.4%.
The business lending stock rose by $890 Mn (0.6%) in January 2025, up on $353 Mn (0.3%) rise witnessed last month.
Exhibit 2: Sector Lending - Annual Growth Rate) (%)
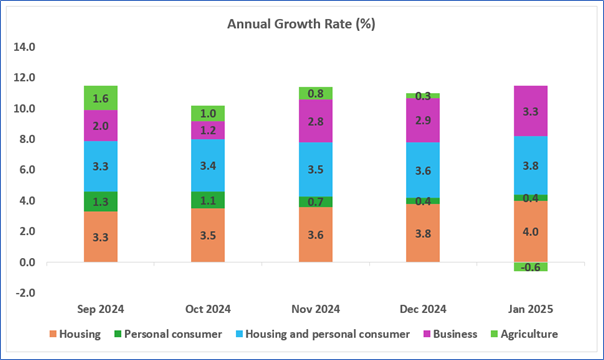
Data Source: This work is based on/includes rbnz data which are licensed by rbnz.govt.nz for reuse under the Creative Commons Attribution 4.0 International Licence; Chart Created by Kalkine Group
Credit Card Summary (June 2024)
As per credit card summary release dated 24 February 2025, the seasonally adjusted total billings in NZ rose to $4.5 Bn (up 1.3% m-m) in January 2025. Annually, this reflects an increase of 1.3% from January-24. The seasonally adjusted domestic billings on New Zealand issued cards amounted to $3.8 Bn in January 2025, up 1.4% from December 2024 as well as 0.4% from January 2024. The overseas billings on New Zealand issued cards stood at $655 Mn in January-25, down by 1.3% from December 2024. Annually, there was an increase of 12.6% from January 2024.
The credit limit utilisation (the ratio of total advances outstanding to total allowable credit limits) fell to 29.4% at the end of January 2025.
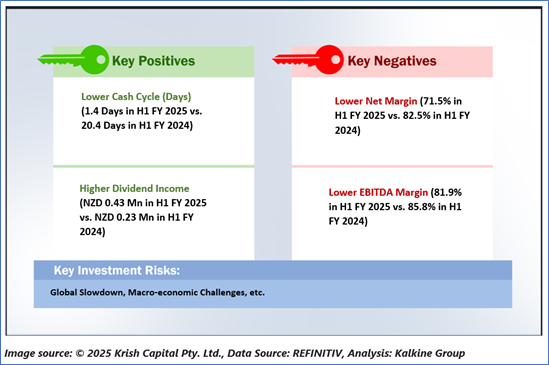
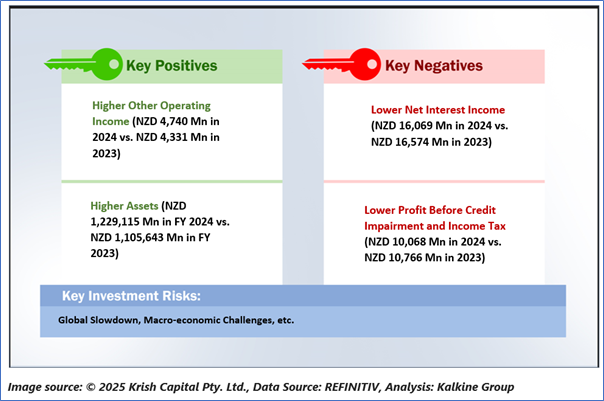
Key Risks and Challenges:
RBNZ stated that the net effect of future changes in trade policy on inflation in NZ remains unclear. The global economic growth is anticipated to remain subdued over the near term. Geopolitics, such as uncertainty related to trade barriers, might weaken the global growth. Also, the economic activity in NZ remains subdued. Considering the spare productive capacity, domestic inflation pressures have been easing.
Exhibit 3. Key Risks in Financial Sector:
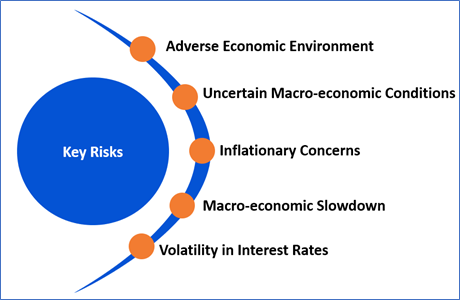
Source: Analysis by Kalkine Group
Outlook:
As per RBNZ, the economic growth is anticipated to witness recovery during 2025. The reduced interest rates are expected to encourage spending, although increased global economic uncertainty is anticipated to weigh on business investment decisions. Notably, the higher prices for some of the critical commodities as well as a lower exchange rate would be increasing the export revenues. Employment growth is projected to pick up in H2 of the year as the domestic economy recovers.
However, the global economic growth is anticipated to remain subdued over the near term. Geopolitics, which includes uncertainty related to the trade barriers, might weaken the global growth. The global economic activity is also likely to remain fragile in the medium term considering the increased geoeconomic fragmentation. Notably, the consumer price inflation in NZ is expected to be volatile over the near term, because of a lower exchange rate and increased petrol prices. The Committee remains well-positioned to maintain price stability in the medium term.
Apart from the sector-specific factors, an analysis on 2 NZX-listed companies is provided. This report covers their insights, outlook, performance and potential as expected to be delivered in the near to medium term.
1) Marlin Global Limited (Recommendation: Buy, Potential Upside: Low Double-Digit) (M-Cap: NZD 194.9 million, Annual Dividend Yield (TTM)1: 9.71%)
Business Description:
Marlin Global Limited (NZX: MLN) is a listed investment company that invests in growing companies based outside of NZ and Australia.
Outlook:
The company’s portfolio management team remained disciplined through the period, focussing towards the well-managed, quality businesses as well as adhering to the investment process. Despite the ongoing global inflationary concerns, increased interest rates and geo-political conflicts, most of the international equity markets witnessed a period of growth.
Technical Overview:
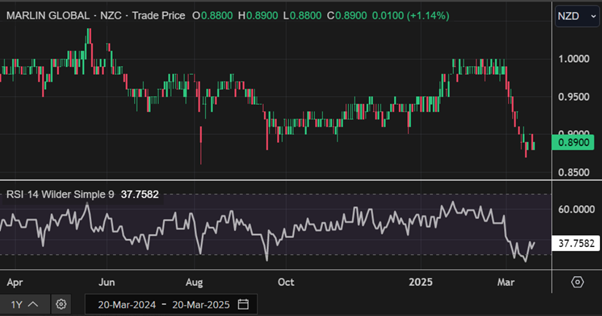
MLN Daily Technical Chart, Data Source: REFINITIV
Technical Commentary
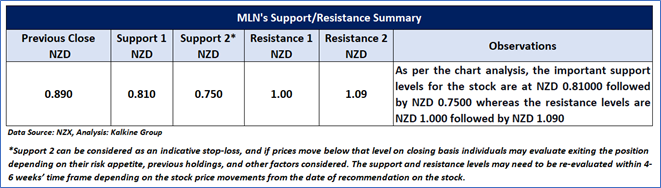
On the daily chart, MLN’s stock prices are rebounding from the lower boundary of a trading range, anticipating a potential minor rally. Moreover, the momentum oscillator RSI (14-period) is bouncing back from its oversold region, providing further support to the previous observation. Prices are trading below both 21-day and 50-day SMAs, which might function as dynamic resistance levels for the stock; in contrast, the stock’s previous trough may act as a sentimental support. A significant support level for the stock is positioned at NZD 0.81, while critical resistance level is located at NZD 1.0
Stock Recommendation
Considering the facts above, a ‘Buy’ recommendation on the stock has been provided at the closing market price of NZD 0.89 per share, up by 1.14% as on 20th March 2025.
2) ANZ Group Holdings Limited (Recommendation: Buy, Potential Upside: Low Double-Digit) (M-Cap: NZD 95.1 Bn, Annual Dividend Yield (TTM)1: 6.45%)
Business Description:
ANZ Group Holdings Limited (NZX: ANZ) is a non-operating holding company. Its divisions include Australia Retail, Australia Commercial, Institutional, New Zealand, Suncorp Bank, Pacific, and Group Center.
Outlook:
ANZ has completed the purchase of Suncorp Bank. The bank it purchased has been performing even better than when it announced 2 years ago, and ANZ remains confident that the synergies would be larger as well as earlier than anticipated. Furthermore, ANZ Plus emerged as a key competitive strength. Moving forward into 2025, ANZ is focused on delivering robust financials, driving value from the Suncorp Bank acquisition, etc.
Technical Overview:
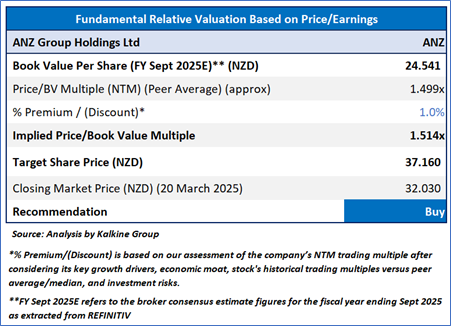
Fundamental Valuation
P/BV Based Relative Valuation
Technical Commentary
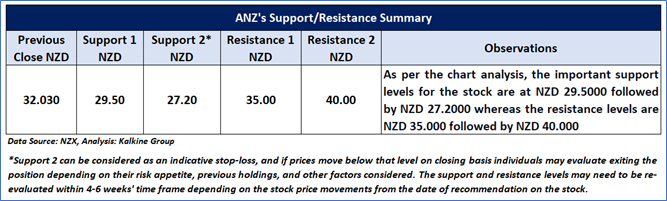
On the daily chart, ANZ’s stock prices are forming a symmetrical triangle pattern, suggesting that the sideway period in the stock might continue to persist in the near future. Moreover, the momentum oscillator RSI (14-period) is trading near its midpoint, providing further support to the previous observation. Prices are trading between its previous peak and trough, which might function as resistance and support levels for the stock, respectively. A significant support level for the stock is positioned at NZD 29.5, while critical resistance level is located at NZD 35.
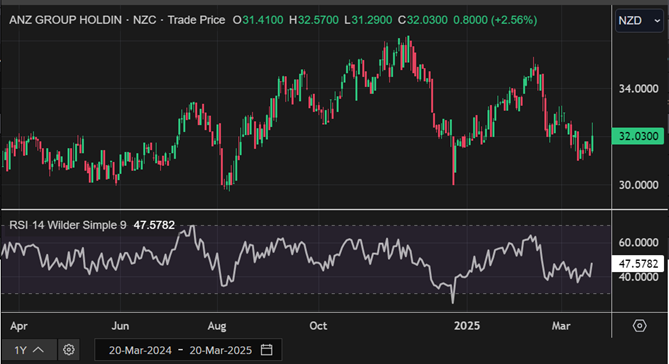
ANZ Daily Technical Chart, Data Source: REFINITIV
Stock Recommendation
Considering the facts above, a ‘Buy’ recommendation on the stock has been provided at the closing market price of NZD 32.03 per share, up by 2.56% as on 20 March 2025
Note 1: Past performance is not a reliable indicator of future performance.
Note 2: The reference date for all price data, currency, technical indicators, support, and resistance levels is March 20, 2025. The reference data in this report has been partly sourced from REFINITIV.
Note 3: Investment decisions should be made depending on an individual's appetite for upside potential, risks, holding duration, and any previous holdings. An 'Exit' from the stock can be considered if the Target Price mentioned as per the Valuation and or the technical levels provided has been achieved and is subject to the factors discussed above.
Note 4: Annual Dividend Yield is on a Trailing Twelve Month (TTM1) basis and are subject to change based on factors such as company performance, stock price changes, etc.
Note 5: Kalkine reports are prepared based on the stock prices captured either from REFINITIV or Trading View. Typically, REFINITIV or Trading View may reflect stock prices with a delay which could be a lag of 25-30 minutes. There can be no assurance that future results or events will be consistent with the information provided in the report. The information is subject to change without any prior notice.
Technical Indicators Defined: -
Support: A level at which the stock prices tend to find support if they are falling, and a downtrend may take a pause backed by demand or buying interest. Support 1 refers to the nearby support level for the stock and if the price breaches the level, then Support 2 may act as the crucial support level for the stock.
Resistance: A level at which the stock prices tend to find resistance when they are rising, and an uptrend may take a pause due to profit booking or selling interest. Resistance 1 refers to the nearby resistance level for the stock and if the price surpasses the level, then Resistance 2 may act as the crucial resistance level for the stock.
Stop-loss: It is a level to protect further losses in case of unfavourable movement in the stock prices.
Disclaimer This report has been issued by Kalkine New Zealand Limited (FSP691351) (NZBN:9429047678101) (“Kalkine”). Kalkine is a Financial Advice Provider (“FAP”) and is authorised by a Class 1 Financial Advice Provider Licence issued by Financial Markets Authority (“FMA”) to provide financial advice. Kalkine provides only general financial advice through its research reports following a person becoming a member. The reports contain buy/sell/hold and other recommendations in relation to equity securities, managed funds and other managed investment schemes and other financial advice products. The recommendations and opinions in this report and on Kalkine website do not take into account any of your investment objectives, financial situation or needs. Before you make a decision about whether to acquire a financial product, you should obtain the Product Disclosure Statement from the product issuer. You should consider the appropriateness of advice taking into account your own objectives, financial situation and needs and seek independent financial advice before making any financial decisions. If you act on the advice in the research reports, you may have to pay fees, expenses or other amounts (but not to Kalkine). Further information about the complaints and dispute resolution process, as well as information about Kalkine’s duties are available on Kalkine’s website. Please read our Financial Advice Provider (FAP) disclosure statement and Complaints Handling Guide, which are available on the website.
Past performance is not a reliable indicator of future performance.
 Please wait processing your request...