

1. Sector Landscape and Outlook
As per the Ministry of Business, Innovation and Employment (MBIE)’s quarterly updates released in March 2023, New Zealand’s renewable share of the electricity generation for the December 2022 quarter was reported as ~94%, the highest since 1980. On the one hand, Hydro generation was up ~38.9% as compared to December 2021 quarter; on the other, wind generation was also up ~1.1% for the same period.
The increasing generation from renewable sources is leading NZ to a declined reliance on fossil fuels for electricity generation. Electricity generated from coal and natural gas dropped by ~16.5% and ~47.6%, respectively, compared to the December 2021 quarter. Coal imports were also down ~90.8% compared to the December quarter of 2021, becoming the lowest since 2013.
According to the treasury.govt.NZ, the government has identified over 300 actions that will contribute to delivering the Strategy’s recommendations for Infrastructure. Almost 74% of actions identified are already underway, and 56 are expected to begin in 2023. The action plan covers sectors like transport, Building & Construction, Building & Construction, Energy, Waste, Housing & Urban Growth, and others.
Usage of Coal Over the Years
Coal production in NZ is centred in the Waikato, mainly for several major industrial users, and the Huntly power station, the West Coast, usually for export and Otago/Southland for local industrial markets. Coal production in 2021 increased compared to 2020, mainly driven by an increase in bituminous coal for exports which outweighed a decline in the production of sub-bituminous coal, and there were fewer production constraints due to COVID-19.
During 2022, 2.6 Mn tonnes of coal were produced in NZ, 0.72 Mn tonnes were imported, and 1.27 Mn tonnes were exported from NZ. On the consumption side, the maximum was from Industrial consumption, which was 0.88 Mn tonnes, a decline from 0.92 Mn tonnes in 2021.
Exhibit 1: Coal’s Annual Consumption & Supply Trend (Tonnes)
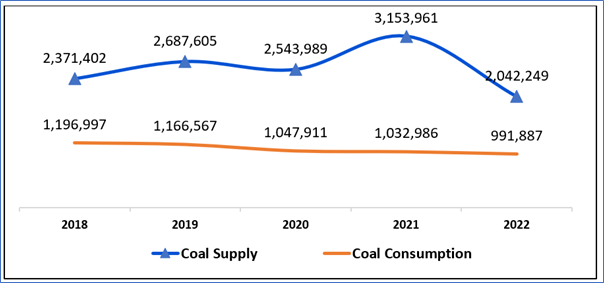
Data Source: This work is owned by the Ministry of Business, Innovation and Employment on behalf of the Crown which are licensed for reuse under the Creative Commons Attribution 4.0 International Licence; Chart Created by Kalkine Group
Annual Trend of Major Electricity Consumers
As per MBIE, NZ’s highest share of primary energy sources comes from renewable sources, as showed by 40.7% in 2021, materially higher than the average of the Organisation for Economic Co-operation and Development (OECD) of ~11%. The most significant contributors are hydro and geothermal resources.
On the demand side, around one-third of New Zealand’s electricity demand arises from households and over one-third is from industrial sectors. Most of the industrial electricity demand is from the wood, pulp, paper and printing sectors and the basic metals sectors, with the Tiwai Point aluminium smelter being the country's largest single electricity user. Where the commercial sectors consume around a quarter, the remaining demand comes from the transport and agriculture, forestry, and fishing sectors, which consume only a tiny amount.
Exhibit 2: Annual Electricity Consumption (GWh) ̶ based on actual sales
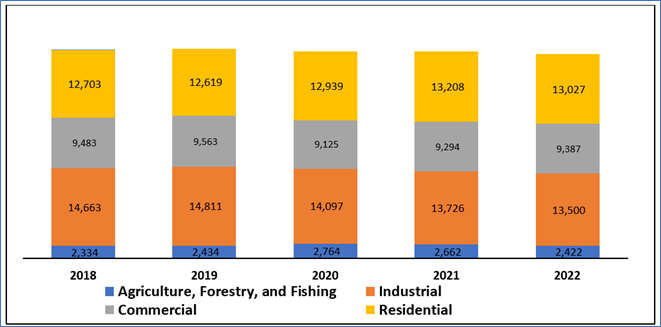
Data Source: This work is owned by the Ministry of Business, Innovation and Employment on behalf of the Crown which are licensed for reuse under the Creative Commons Attribution 4.0 International Licence; Chart Created by Kalkine Group
Index Performance:
The S&P/NZX All Utilities (Sector) Index generated a 6-month return of ~9.10% versus ~2.34% by the S&P/NZX 50 Index. Therefore, NZX All Utilities Index overperformed NZX50 Index by ~6.76% in 6 months.
Exhibit 3: S&P/NZX All Utilities (Sector) vs S&P/NZX50 Index
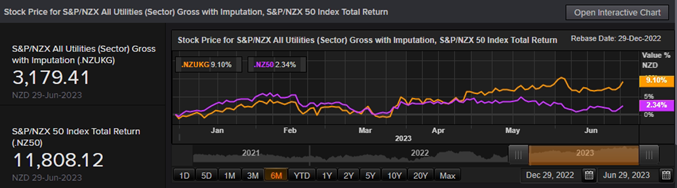
Source: REFINITIV
Key Risks and Challenges:
The economy is facing multiple challenges. With the growing population, the demand for housing, transport, schools, hospitals, and other essential services is also increasing. NZ not only need to build more and better infrastructure but also prepare to mitigate the impacts of climate change on the built environment. For example, weather conditions like Cyclone Gabrielle have presented an earlier-than-expected challenge to rebuild and strengthen the infrastructure.
The government and private players are working to support low-carbon electricity systems, a complex collaboration of multiple technologies with strategic functions to maximize output. Further, the uncertainty over the availability of raw materials used in renewable electricity generation implies an option value associated with the choice between future non-fossil-fuel generation and fossil-fuel technologies. In line with this, the power sector is also susceptible to drastic changes in the climate suitable for energy generation. Rising water temperature, air temperature, and frequency/intensity of droughts are prospective circumstances that could impact the generation efficiency of hydropower generation and nuclear power plants.
New Zealand’s energy production arises from both renewable and non-renewable sources. As it imports and exports fossil fuels that generate export revenue, it also makes NZ dependent and vulnerable to energy commodity prices and hence susceptible to the risks related to international supply and demand fluctuations.
Exhibit 4. Key Risks in Utilities Sector:
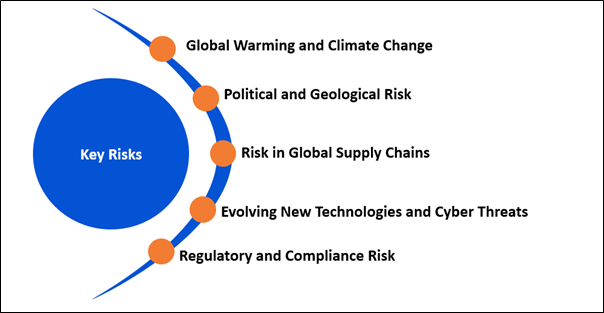
Source:- Analysis: Kalkine Group
Outlook:
The Infrastructure Action Plan as stated by Treseaury.NZ confirms the government’s commitment to the transformation required to create the efficient, equitable, resilient, and sustainable infrastructure system New Zealanders need now and into the future. The investments through Budget 2023 support the implementation of the Infrastructure Action Plan, where the government will invest NZD 71 billion majorly in transport, housing, health, defence, and education facilities in the next five years.
Out of the total actions, 49 actions are due to be completed by the end of 2023, 137 actions will be finished between 2024 and 2026, 65 actions are expected to be completed between 2027-2035, and 80 actions are ongoing.
The NZ government is focusing on renewable energy sources to reach the target of 50% of total energy consumption coming from renewable sources by 2035. Growing NZ’s hydrogen industry can support NZ in achieving its commitments to reduce net emissions of all greenhouse gases (except biogenic methane) to zero by the year 2050 and has the potential to help the government’s goal of touching 100% renewable electricity by the year 2030.
Moreover, apart from investment in renewable generation and hydrogen production plants, on the infrastructure front, the country is expected to build school space for 100,000 additional students in high-growth areas by 2030, as Housing affordability remains a key challenge to New Zealanders’ well-being, particularly for first home buyers.
Te Waihanga - a key advisor to government on infrastructure - estimates that New Zealand needs to spend NZD 60 on renewals for every NZD 40 spent on new infrastructure. To help meet this, the government is investing billions in maintenance and renewals.
Apart from the sector-specific factors, an analysis on two NZX-listed companies is provided. This report covers their insights, outlook, performance and potential as expected to be delivered in the near to medium term.
1 ) NZ Windfarms Limited (Recommendation: Speculative Buy, Potential Upside: Low Double-Digit) (M-Cap: NZD 37.448 million, Annual Dividend Yield (TTM)1: 3.906%)
Business Description:
NZ Windfarms Limited (NZX: NWF) is one of Aotearoa NZ’s largest independent renewable electricity generators.
Outlook:
The recent grant marked the Te Rere Hau (TRH) wind farm as one of the first operational wind farms in New Zealand, which gained consent for a repowering of its initial Wind Farm. NWF’s recent application for the Aokautere Expansion Project has been granted. The project could have a capacity of 37.8MW and comprises up to 9 x 4.2MW modern three-bladed wind turbines producing approximately 170 GWh per annum. That is enough renewable energy to power 23,000 average kiwi households or to charge 75,800 electric vehicles. NWF is progressing satisfactorily on the critical commercial elements required to deliver the repower. The company expects FY23 EBITDAF to be between NZD 4.1-5.2 Mn.
Technical Overview:
Daily Price Chart
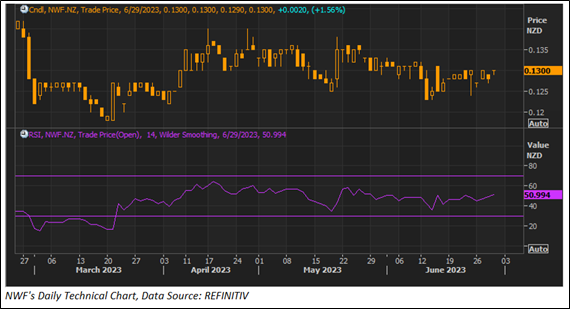
Technical Commentary:
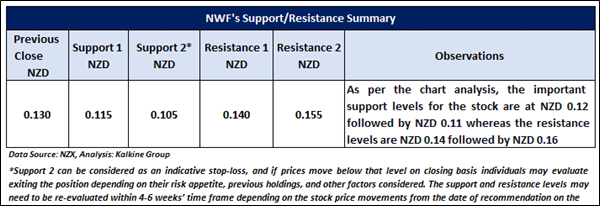
On the daily chart, NWF prices are trading above the horizontal trendline support zone. Moreover, the momentum oscillator RSI (14-period) is showing a reading of ~50.994 level. Further, the prices are trading above the trend-following indicators 21-period SMA, which may act as a support zone. An important support level for the stock is placed at NZD 0.115 while the key resistance level is placed at NZD 0.140.
Stock Recommendation
Considering the facts above, a ‘Speculative Buy’ recommendation on the stock has been provided at the closing market price of NZD 0.130 per share, up by 1.560% as of 29 June 2023.
2 ) Vital Limited (Recommendation: Speculative Buy, Potential Upside: Low Double-Digit) (M-Cap: NZD 8.51 million)
Business Description:
Vital Limited (NZX: VTL) is a New Zealand-based company which provides fundamental nationwide infrastructure and communication services. It operates through three segments: Wireless Networks, Wired Networks and Others and caters sectors such as government, civil defence, emergency services, health, utilities, public transport, education, logistics & freight, agriculture, and channel partners.
Outlook:
VTL’s banking facility with the Bank of New Zealand (BNZ) has been renewed for a further one-year term to January 2025. The renewal follows a net debt reduction of ~8% or NZD 1.1mn during FY22 and reflects a part of the company’s ongoing performance reset to deliver a more sustainable financial foundation for shareholders. With a modest recovery in mind, the company re-affirmed the guidance and anticipates revenue and EBITDA (adjusted) to be between NZD 27.5-28.5mn and NZD 5.8-6.5mn, respectively, for FY23. And for FY24, the revenue and EBITDA (adjusted) are anticipated to be between NZD 28.0-29.0mn and NZD 6.6-7.1mn, respectively.
Technical Overview:
Daily Price Chart
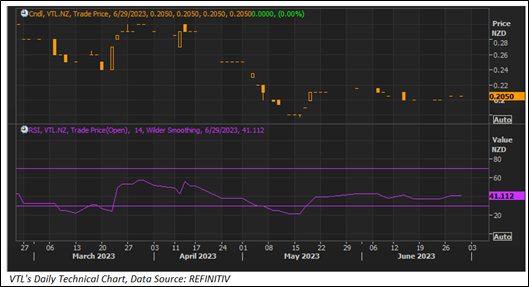
Technical Commentary
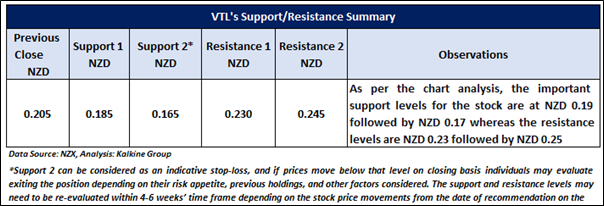
On the daily chart, VTL prices are trading above the downward sloping trendline support level and taking support from the trendline. Moreover, the momentum oscillator RSI (14-period) is showing a reading of ~41.112 level. However, the prices are trading below the trend-following indicators 21-period SMA, which may act as a resistance zone. An important support level for the stock is placed at NZD 0.185 while the key resistance level is placed at NZD 0.230.
Stock Recommendation
On a TTM basis, the stock of VTL is trading at an EV/Sales multiple of 1.7x compared to the industry (Telecommunications Services) median of 2.0x, and thus seems undervalued.
Considering the outlook and undervaluation as indicated by the TTM valuation, a ‘Speculative Buy’ recommendation on the stock has been provided at the closing market price of NZD 0.205 per share, as of 29 June 2023.
Markets are trading in a highly volatile zone currently due to certain macro-economic issues and geopolitical tensions prevailing. Therefore, it is prudent to follow a cautious approach while investing.
Note 1: Past performance is neither an indicator nor a guarantee of future performance.
Note 2: The reference date for all price data, currency, technical indicators, support, and resistance levels is June 29, 2023. The reference data in this report has been partly sourced from REFINITIV.
Note 3: Investment decisions should be made depending on an individual's appetite for upside potential, risks, holding duration, and any previous holdings. An 'Exit' from the stock can be considered if the Target Price mentioned as per the Valuation and or the technical levels provided has been achieved and is subject to the factors discussed above.
Note 4: Annual Dividend Yield is on a Trailing Twelve Month (TTM1) basis and are subject to change based on factors such as company performance, stock price changes, etc.
Technical Indicators Defined: -
Support: A level at which the stock prices tend to find support if they are falling, and a downtrend may take a pause backed by demand or buying interest. Support 1 refers to the nearby support level for the stock and if the price breaches the level, then Support 2 may act as the crucial support level for the stock.
Resistance: A level at which the stock prices tend to find resistance when they are rising, and an uptrend may take a pause due to profit booking or selling interest. Resistance 1 refers to the nearby resistance level for the stock and if the price surpasses the level, then Resistance 2 may act as the crucial resistance level for the stock.
Stop-loss: It is a level to protect further losses in case of unfavourable movement in the stock prices.
PJ: Petajoules
Disclaimer
Kalkine New Zealand Limited is a Financial Advice Provider (“FAP”) and is authorised by a Class 1 Financial Advice Provider Licence issued by Financial Markets Authority (“FMA”) to provide financial advice. Kalkine provides only general financial advice through its research reports following a person becoming a member. The reports contain buy/sell/hold and other recommendations in relation to equity financial products. The recommendations and opinions [on this website] / [in this report] do not take into account any of your investment objectives, financial situation or needs. Before you make a decision about whether to acquire a financial product, you should obtain the Product Disclosure Statement from the product issuer. You should consider the appropriateness of advice taking into account your own objectives, financial situation and needs and seek independent financial advice before making any financial decisions. If you act on the advice in the research reports, you may have to pay fees, expenses or other amounts (but not to Kalkine). Further information about the complaints and dispute resolution process, as well as information about Kalkine’s duties are available on Kalkine’s website. Please read our Financial Advice Provider (FAP) disclosure statement and Complaints Handling Guide, which are available on the website.
Past performance is not a reliable indicator of future performance.
 Please wait processing your request...