
I. Sector Landscape and Outlook
According to the Fortnightly Economic Update dated 3rd February 2023 released by Treasury.NZ, inflationary pressures as well as the labour market are showing some early signs of easing. The global growth outlook has witnessed an improvement as activity has been holding up in the US and Europe as well as rebound continues in China. Consumer price inflation reflected signs of moderation in the quarter ended December and employment growth has witnessed a slowdown. Notably, the international outlook encountered an improvement as IMF upgraded its global growth forecast for 2023 by 0.2 percentage-points to 2.9%. This was on the back of resilient demand in the US and Europe, improvements in energy markets and reopening of China. Even though global inflation has peaked, core rates are elevated and central banks are raising interest rates. However, guidance has suggested that an end to the tightening cycle is near.
Total Housing Lending Stock Witnessed an Increase
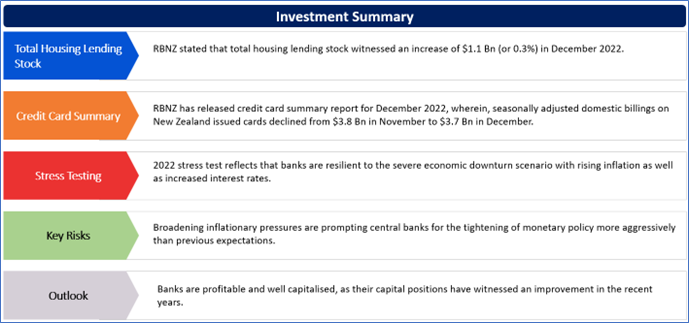
As per RBNZ, total housing lending stock witnessed an increase of $1.1 Bn (or 0.3%) in December 2022. As per the release, the annual growth rate has been trending downwards from 4.8% reported last month to 4.4%. Notably, this was the lowest annual growth rate since February 2013. Total personal consumer lending stock witnessed an increase of $125 Mn (or 0.9%) in December 2022. This reflects that its positive trend has continued since September 2022.
Total business lending stock witnessed a fall of $385 Mn (or 0.3%), which reflects the significant decline on the $1.5 Bn increase reported previous month. Annual growth witnessed a fall from 8.3% to 7.9% in December 2022. It needs to be noted that total agriculture lending stock fell $15 Mn.
Exhibit 1: Lending Pattern– Banks and NBLIs
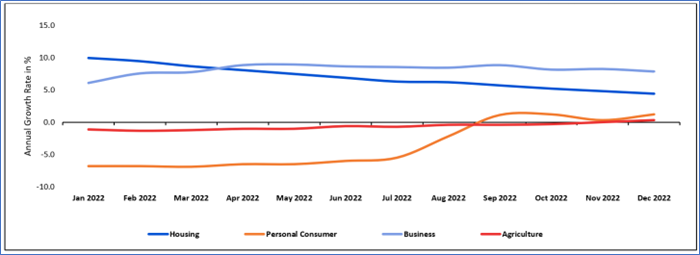
Data Source: This work is based on/includes rbnz data which are licensed by rbnz.govt.nz for reuse under the Creative Commons Attribution 4.0 International Licence; Chart Created by Kalkine Group
Stress Testing
As per RBNZ’s report titled “2022 Bank Solvency Stress Test” dated 31 October 2022, 2022 stress test reflects that banks are resilient to the severe economic downturn scenario with rising inflation as well as increased interest rates. Banks are well positioned in order to support the economy by addressing any demand for lending during the period of stress because of large capital buffers which have been built up since global financial crisis.
The aggregate CET1 ratio in the stress test witnessed a fall of 3.3 percentage points to the minimum of 8.9% before mitigants. This was well above the regulatory minimum requirement. The aggregate total capital ratio witnessed a fall of 4.3 percentage points to the trough of 10.3%. At the end of the stress scenario in 2026, banks proved their resilience to the shock. By comparison, the aggregate base case capital ratios are above the capital requirements.
Credit Card Summary- December 2022
RBNZ has released credit card summary report for December 2022, wherein, seasonally adjusted domestic billings on New Zealand issued cards declined from $3.8 Bn in November to $3.7 Bn in December. The seasonally adjusted total billings in NZ amounted to $4.3 Bn in December 2022, reflecting a fall of 1.6% from November. However, billings in NZ on overseas issued cards (actual) witnessed a rise to $0.7 Bn, up from $0.6 Bn in November. Notably, total billings on overseas issued cards continued to rise.
The total credit limits stood at $21.3 Bn (not seasonally adjusted), a level similar to November.
Solvency Capital Ratio of The General Insurance Sector
RBNZ, in their Financial Stability Report (November 2022), stated that the solvency capital ratio of the general insurance sector continued to decline in recent quarters from the peak which was witnessed in the month of March 2021. However, it remained above the level witnessed before COVID-19 pandemic.
Overall, NZ insurance sector remained resilient as well as has coped well with the issues related to COVID-19. The Omicron variant infected a significant proportion of people of New Zealand as well as led to higher deaths. Since people of NZ are less likely to have life insurance as compared to peer countries, direct financial impact on life insurers was minimal.
The solvency ratio for the life insurance sector increased slightly over the previous year and remained near the long-run average level. Notably, the solvency ratio for the health insurance sector has been fluctuating around previous levels at 3-4 times the minimum requirement.
Exhibit 2: Trend in Insurer Revenue in NZ ($ Mn)
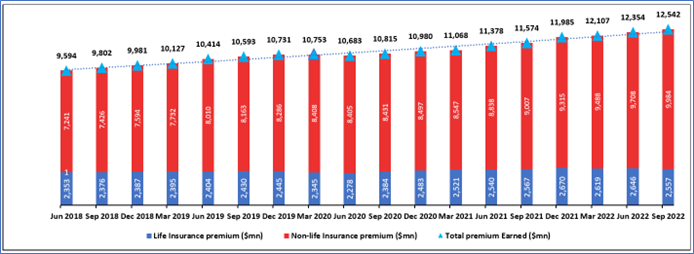
Data Source: This work is based on/includes rbnz data which are licensed by rbnz.govt.nz for reuse under the Creative Commons Attribution 4.0 International Licence; Chart Analysis by Kalkine Group
Key Risks and Challenges:
As per RBNZ, increased number of downside risks to the global economic outlook are present. The financial markets are volatile, and there has been increasing uncertainty regarding the extent to which economic activity could slow down due to the tightening of monetary policy. Therefore, financial stability risks have increased.
The factors impacting the financial market are primarily driven by elevated inflation, higher interest-rate policy, a strong dollar as well as geopolitical tensions.
Exhibit 3. Key Risks in Financial Sector:
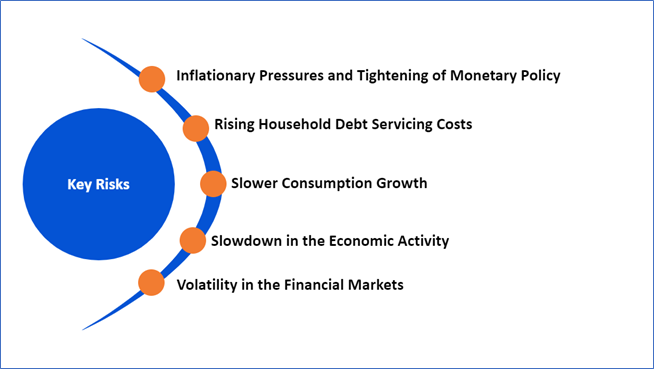
Source: Analysis by Kalkine Group
Outlook:
As per RBNZ’s annual report 2022, Reserve Bank of New Zealand played a critical supporting role in the economic recovery of NZ through the pandemic. The financial system remained robust. Notably, the policy actions have contributed to the robust labour market as well as resilient household balance sheets.
Amidst challenges, Reserve Bank of New Zealand assisted in delivering a sound as well as efficient financial system, robust and fit-for-purpose payment and settlement systems and money and cash availability for NZ’s needs. The objectives were delivered despite unexpected challenges as well as rapidly evolving operating environment.
Banks as well as insurers are in the robust position and they can support the broader NZ economy. The banks are profitable and well-capitalised, and their capital positions have witnessed an improvement in past years.
Apart from the sector-specific factors, an analysis on 2 NZX-listed companies is provided. This report covers their insights, outlook, performance and potential as expected to be delivered in the near to medium term.
1) Westpac Banking Corporation (Recommendation: Buy, Potential Upside: Low Double-Digit) (M-Cap: NZD87.8 billion, Annual Dividend Yield (TTM)1: 6.11%)
Outlook
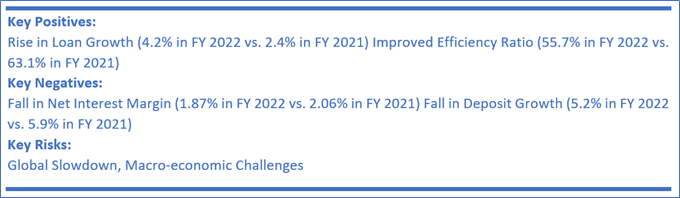
With WBC’s robust balance sheet, sharper strategy as well as committed team, it is focused towards strengthening the franchise as well as accelerating the performance. WBC witnessed core earnings growth throughout all the banking segments in H2 FY 2022. WBC has well-advanced its "Fix and Simplify" strategic priorities.
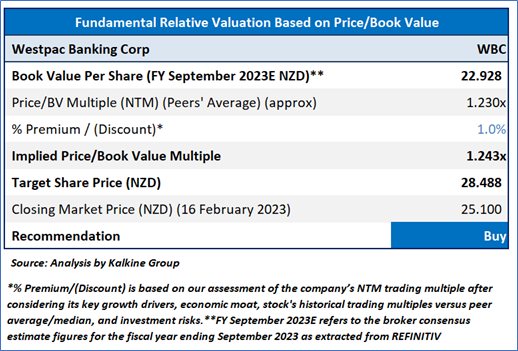
Fundamental Valuation:
P/BV Multiple Based Relative Valuation
Technical Overview:
Technical Commentary
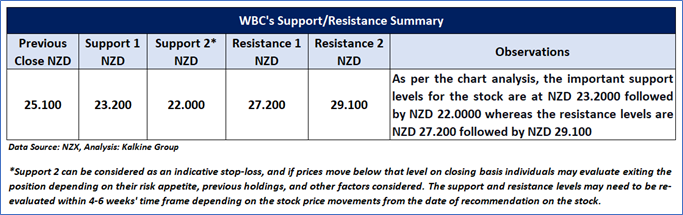
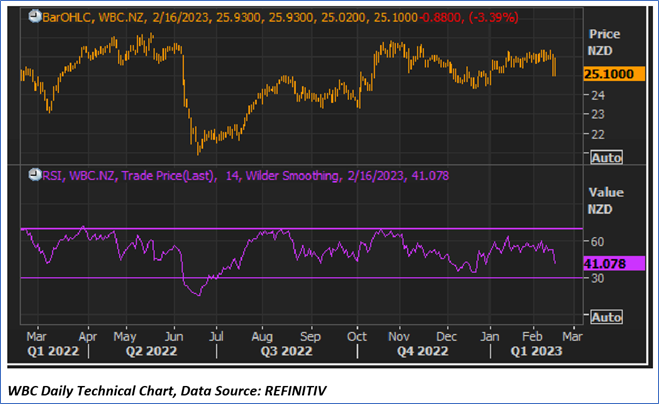
On the daily chart, WBC prices are sustaining above the horizontal trendline support level and taking the support from the trendline. Moreover, the momentum oscillator RSI (14-period) is showing a reading of ~41.078 level. However, the prices are trading below the trend-following indicators 21- period SMA, which may act as a resistance level. An important support level for the stock is placed at NZD23.2 while the key resistance level is placed at NZD27.2.
Stock Recommendation
Considering the facts above, a ‘Buy’ recommendation on the stock has been provided at the closing price of NZD25.100 per share, down by 3.39% as on 16 February 2023.
2) NZX Limited (Recommendation: Hold, Potential Upside: Low Double-Digit) (M-Cap: NZD409.12 million, Annual Dividend Yield (TTM)1: 6.52%)
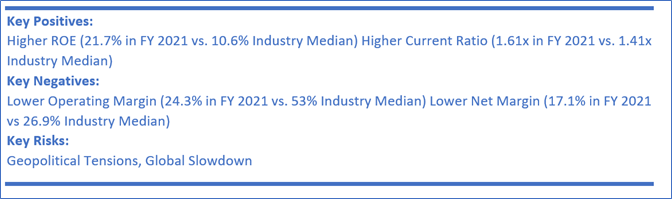
Outlook
NZX has stated that there are long-term structural market tailwinds which could support growth in the managed funds as well as platform businesses. It would continue to explore M&A activity in order to help drive as well as accelerate growth wherever appropriate. NZX is still making deployments towards growth and is also focusing towards efficiencies as well as driving operating leverage.
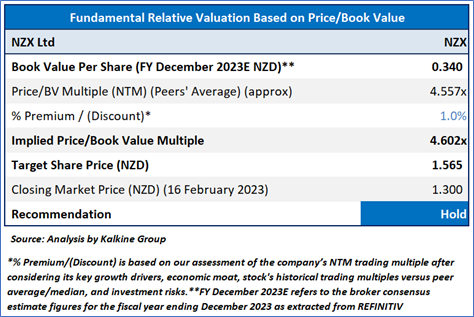
Fundamental Valuation:
P/BV Multiple Based Relative Valuation
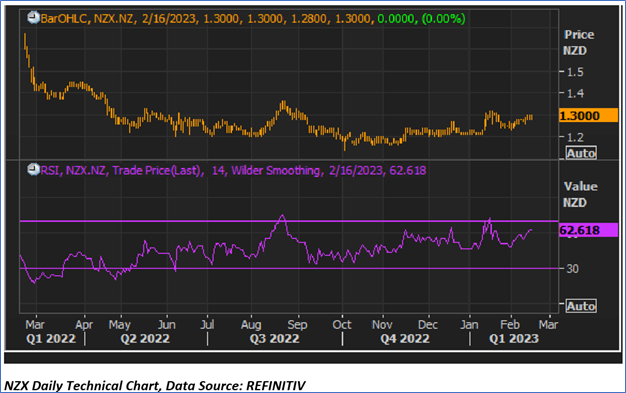
Technical Overview:
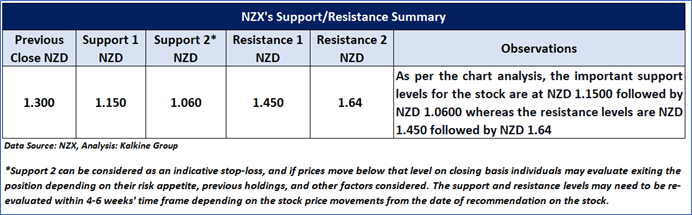
Technical Commentary
On the daily chart, NZX stock price witnessed a breakout of the falling trendline resistance zone and prices are trading above the trendline support. Moreover, the momentum oscillator RSI (14-period) is showing a reading of ~62.618 level. Further, the prices are trading above the trend-following indicator 50-period SMA, which may act as a support level. An important support level for the stock is placed at NZD 1.15 while the key resistance level is placed at NZD1.45.
Stock Recommendation
Considering the facts above, a ‘Hold’ recommendation on the stock has been provided at the closing price of NZD1.300 per share as on 16 February 2023.
Disclosure: Kalkine New Zealand Limited’s (Kalkine) Director Kunal Sawhney owns shares of Westpac Banking Corporation since December 2021. Kalkine has recommended Westpac Banking Corporation in its report as general advice only (under FSP Number FSP691351).
Markets are trading in a highly volatile zone currently due to certain macro-economic issues and geopolitical tensions prevailing. Therefore, it is prudent to follow a cautious approach while investing.
Note 1: Past performance is neither an indicator nor a guarantee of future performance.
Note 2: The reference date for all price data, currency, technical indicators, support, and resistance levels is February 16, 2023. The reference data in this report has been partly sourced from REFINITIV.
Note 3: Investment decisions should be made depending on an individual's appetite for upside potential, risks, holding duration, and any previous holdings. An 'Exit' from the stock can be considered if the Target Price mentioned as per the Valuation and or the technical levels provided has been achieved and is subject to the factors discussed above.
Note 4: Annual Dividend Yield is on a Trailing Twelve Month (TTM1) basis and are subject to change based on factors such as company performance, stock price changes, etc.
Technical Indicators Defined: -
Support: A level at which the stock prices tend to find support if they are falling, and a downtrend may take a pause backed by demand or buying interest. Support 1 refers to the nearby support level for the stock and if the price breaches the level, then Support 2 may act as the crucial support level for the stock.
Resistance: A level at which the stock prices tend to find resistance when they are rising, and an uptrend may take a pause due to profit booking or selling interest. Resistance 1 refers to the nearby resistance level for the stock and if the price surpasses the level, then Resistance 2 may act as the crucial resistance level for the stock.
Stop-loss: It is a level to protect further losses in case of unfavourable movement in the stock prices.
Disclaimer
Kalkine New Zealand Limited is a Financial Advice Provider (“FAP”) and is authorised by a Transitional FAP license issued by Financial Markets Authority (“FMA”) to provide financial advice. Kalkine provides only general financial advice through its research reports following a person becoming a member. The reports contain buy/sell/hold and other recommendations in relation to equity financial products. The recommendations and opinions [on this website] / [in this report] do not take into account any of your investment objectives, financial situation or needs. Before you make a decision about whether to acquire a financial product, you should obtain the Product Disclosure Statement from the product issuer. You should consider the appropriateness of advice taking into account your own objectives, financial situation and needs and seek independent financial advice before making any financial decisions. If you act on the advice in the research reports, you may have to pay fees, expenses or other amounts (but not to Kalkine). Further information about the complaints and dispute resolution process, as well as information about Kalkine’s duties are available on Kalkine’s website. Please read our Financial Advice Provider (FAP) disclosure statement and Complaints Handling Guide, which are available on the website.
Past performance is not a reliable indicator of future performance.
 Please wait processing your request...