
Company Overview:
Genesis Energy Limited (NZX: GNE) is a NZ-based diversified energy company. Contact Energy Limited (NZX: CEN) is a NZ-based energy generators and retailers.
Kalkine’s Sector Report covers the Investment Highlights, Key Financial Metrics, Risks, Outlook, Technical Analysis along with the Valuation, Target Price, and Recommendation on the stock.
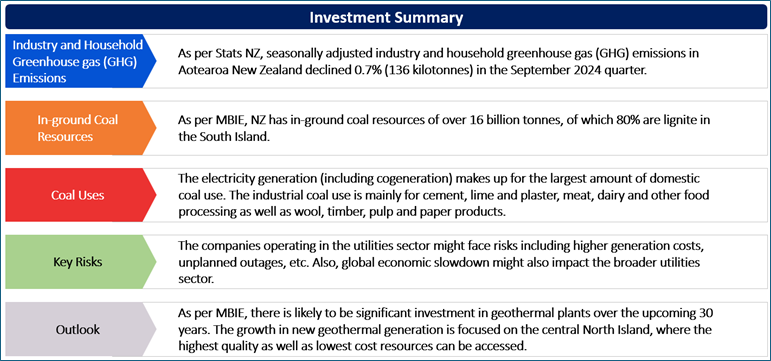
As per Stats NZ, seasonally adjusted industry and household greenhouse gas (GHG) emissions in Aotearoa New Zealand declined 0.7% (136 kilotonnes) in the September 2024 quarter. The decline in emissions this quarter came mainly from manufacturing, with falls in emissions witnessed in most other industries. Over the quarter, industry emissions (excluding households) fell by 1.2% (204 kilotonnes). By comparison, GDP decreased 1.0% in the same period. Notably, emissions attributed to households increased 0.3% (6 kilotonnes) in the September 2024 quarter. The largest decline in emissions came from manufacturing, down 6.2% (120 kilotonnes). This decrease was larger than the 2.6% fall in GDP from manufacturing over the same period.
This quarter’s decline was driven by the petroleum, chemical, polymer as well as rubber product manufacturing and metal product manufacturing industries. The emissions from transport, postal, and warehousing were also down by 2.8% (46 kilotonnes), while agriculture, forestry, and fishing emissions decreased by 0.1% (13 kilotonnes). Mining was the only industry to show an increase in emissions, reflecting a rise of 2.3% (7 kilotonnes). In the year ended September 2024, NZ industry and households emitted 78,925 kilotonnes of GHGs. This was 0.5% higher than the 78,509 kilotonnes emitted in the previous September year.
Exhibit 1: Change in Emissions by Industry and Household (kilotonnes CO₂-e), seasonally adjusted, June 2024–September 2024 Quarters
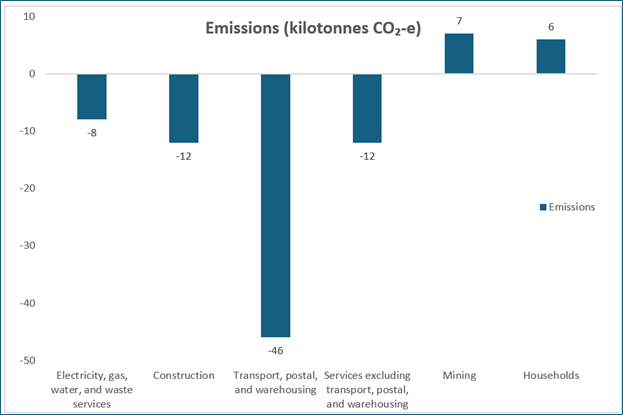
Data Source: This work is based on/includes Stats NZ’s data which are licensed by Stats NZ for reuse under the Creative Commons Attribution 4.0 International Licence; Chart Created by Kalkine Group
Coal Overview
As per MBIE, NZ has in-ground coal resources of over 16 billion tonnes, of which 80% are lignite in the South Island. There are also significant resources of sub-bituminous coal in both islands as well as a lesser amount of high-quality bituminous coal, mainly on the West Coast of the South Island. The commercial coal use is primarily for heating accommodation as well as service buildings in central and local government, hospitals, rest homes and educational institutions. A small amount of coal is utilised by the agricultural (mainly horticulture), transport and residential sectors.
The electricity generation (including cogeneration) makes up for the largest amount of domestic coal use. The industrial coal use is mainly for cement, lime and plaster, meat, dairy and other food processing as well as wool, timber, pulp and paper products.
The commercial coal use is primarily for heating accommodation and service buildings in central and local government, hospitals, rest homes and educational institutions.
Exhibit 2: Quarterly Coal Supply (Production) (Tonnes)
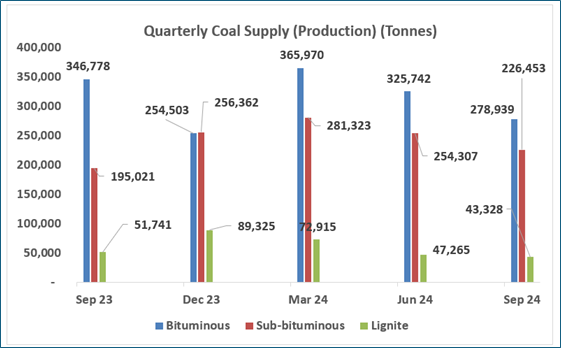
Data Source: This work is owned by the Ministry of Business, Innovation and Employment on behalf of the Crown which are licensed for reuse under the Creative Commons Attribution 4.0 International Licence; Chart Created by Kalkine Group
Key Risks and Challenges:
The companies operating in the utilities sector might face risks including higher generation costs, unplanned outages, etc. Also, global economic slowdown might also impact the broader utilities sector. RBNZ recently stated that global economic growth is expected to remain subdued in the near term. Notably, geopolitics, such as uncertainty related to trade barriers, might weaken global growth. The global economic activity is also likely to remain fragile over the medium term considering the increased geoeconomic fragmentation.
Exhibit 3. Key Risks in Utilities Sector:
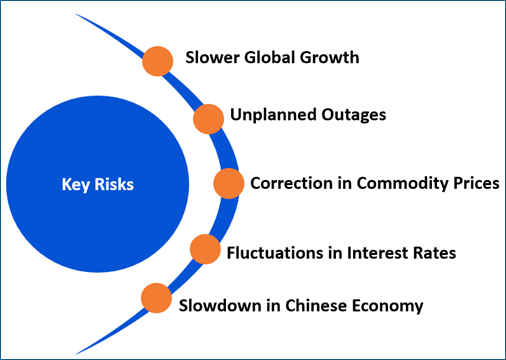
Source:- Analysis: Kalkine Group
Outlook:
As per MBIE, there is likely to be significant investment in geothermal plants over the upcoming 30 years. The growth in new geothermal generation is focused towards the central North Island, where the highest quality as well as lowest cost resources can be accessed. Hydro generation would continue to make up around half of all generation in 2040. The electricity generation using hydro resources are naturally variable depending on rainfall. In low rainfall years, the shortfall of hydro generation would continue to be made up by flexible thermal generation with high running costs. The total electricity demand is expected to grow between 35.3% and 82.0% by 2050, reaching 62.1 TWh (terawatt hours). In the short term, the commercial and industrial sectors are the critical sectors aiding this growth. From the late 2030s, electrification of transport will be playing a larger role with higher uptake of electric vehicles (EVs).
Contributing to increased demand is the level of switching of existing fossil fuel use to electricity, which remains a key uncertainty. Alternative electrical heating technologies might become more attractive over time. With the same heating demand, users might convert to electrical heating, depending on investment and running costs. The increase in total demand can result an increase in peak demand to between 9.1 GW and 12.5 GW by 2050. A key contributor is increased residential demand for heating, which would drive higher winter demand peaks.
Apart from the sector-specific factors, an analysis on two NZX-listed companies is provided. This report covers their insights, outlook, performance and potential as expected to be delivered in the near to medium term.
1) Contact Energy Limited (Recommendation: Buy, Potential Upside: Low Double-Digit) (M-Cap: NZD 7.18 billion, Annual Dividend Yield (TTM)1: 5.84%)
Business Description:
Contact Energy Limited (NZX: CEN) is a New Zealand-based energy generators and retailers.
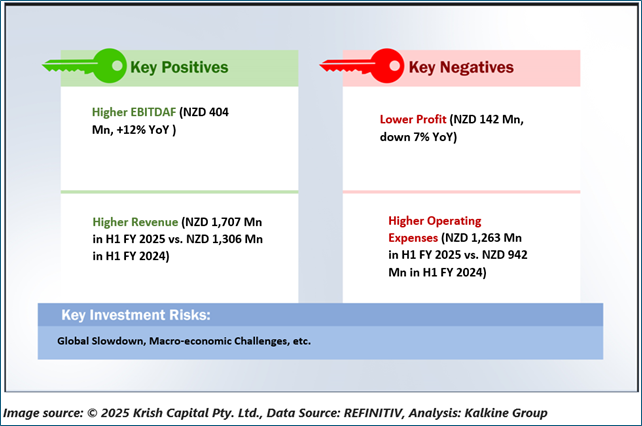
Outlook:
Over the next 6 months, CEN would be preparing for its proposed combination with Manawa while continuing to deliver key milestones under its strategy to lead the decarbonisation of NZ. It would continue to deliver the new renewable electricity projects as well as innovative supply arrangements that are required to support the energy transition in NZ.
Technical Overview:
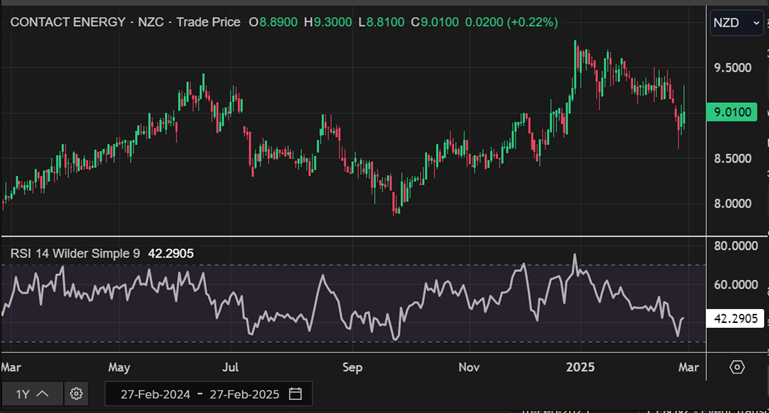
CEN Daily Technical Chart, Data Source: REFINITIV
Technical Commentary:
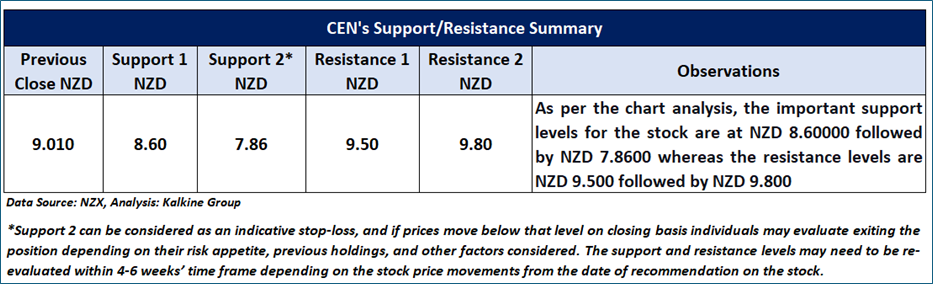
On the daily chart, CEN’s stock prices are undergoing an uptrend characterized by higher highs and higher lows, indicating a positive bias. Moreover, the momentum oscillator RSI (14-period) is rebounding near its oversold region, adding further evidence for the mentioned recommendation. Prices are trading between its previous peak and trough, which might function as resistance and support levels for the stock, respectively. A significant support level for the stock is positioned at NZD 8.60, while critical resistance level is located at NZD 9.50.
Fundamental Valuation:
Price/EPS Based Relative Valuation
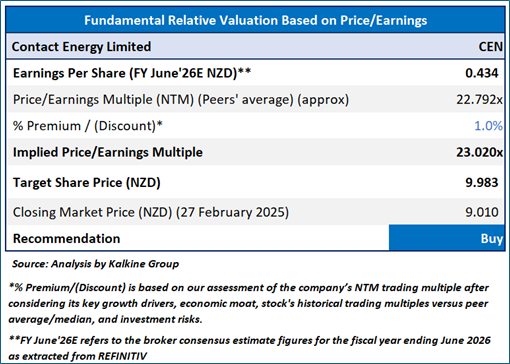
Stock Recommendation
Considering the facts above, a ‘Buy’ recommendation on the stock has been provided at the closing market price of NZD 9.01 per share, up by 0.22% as on 27 February 2025.
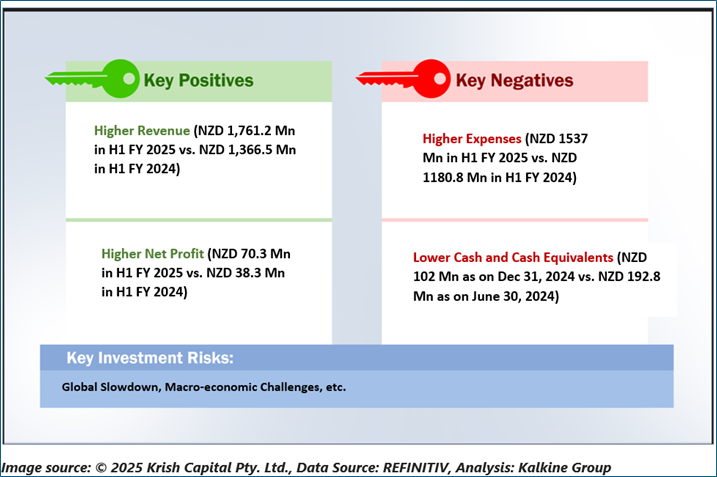
2) Genesis Energy Limited (Recommendation: Hold, Potential Upside: Low Double-Digit) (M-Cap: NZD 2.40 Bn, Annual Dividend Yield: 5.84%)
Business Description:
Genesis Energy Limited (NZX: GNE) is a New Zealand-based diversified energy company.
Outlook:
GNE’s guidance for FY 2025 EBITDAF remains at ~$460 Mn. It is expecting FY 2025 capital expenditure of between $130 Mn - $140 Mn, with spend profile adjusted for select projects to manage affordability. The company’s renewable generation pathway is focused on solar development because of speed to market, lower capital costs as well as overall improving economics.
Technical Overview:
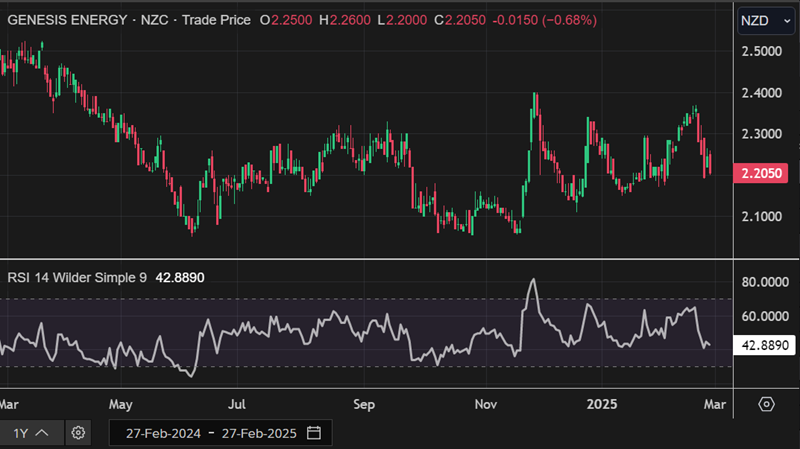
GNE Daily Technical Chart, Data Source: REFINITIV
Technical Commentary
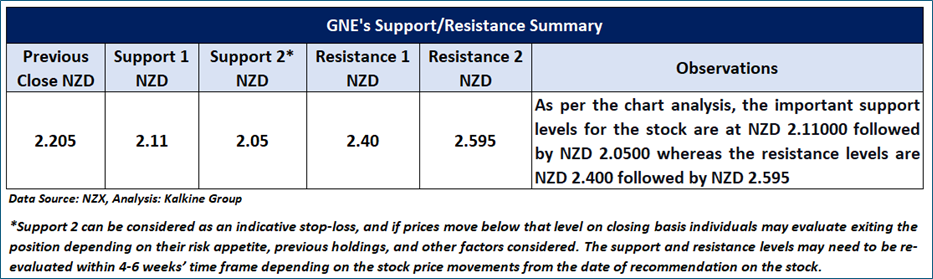
On the daily chart, GNE’s stock prices are forming a trading range characterized by identical highs and lows, suggesting that the sideways period in the stock might continue to persist in the near future. Additionally, the momentum oscillator RSI (14-period) is hovering around its midpoint, providing more support to the previous observation. Prices are trading between its previous peak and trough, which might serve as resistance and support levels for the stock, respectively. An important support level for the stock is placed at NZD 2.110, while key resistance level is situated at NZD 2.400.
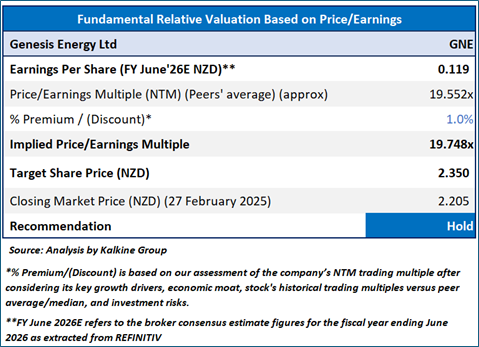
P/E Based Relative Valuation
Stock Recommendation
Considering the aforementioned factors, a “Hold” rating is given on the stock at the closing market price of NZD 2.205 per share, down by 0.68% as on 27th February 2025.
Markets are trading in a highly volatile zone currently due to certain macro-economic issues and geopolitical tensions prevailing. Therefore, it is prudent to follow a cautious approach while investing.
Note 1: Past performance is neither an indicator nor a guarantee of future performance.
Note 2: The reference date for all price data, currency, technical indicators, support, and resistance levels is 27 February 2025. The reference data in this report has been partly sourced from REFINITIV.
Note 3: Investment decisions should be made depending on an individual's appetite for upside potential, risks, holding duration, and any previous holdings. An 'Exit' from the stock can be considered if the Target Price mentioned as per the Valuation and or the technical levels provided has been achieved and is subject to the factors discussed above.
Note 4: Kalkine reports are prepared based on the stock prices captured either from REFINITIV or Trading View. Typically, REFINITIV or Trading View may reflect stock prices with a delay which could be a lag of 25-30 minutes. There can be no assurance that future results or events will be consistent with the information provided in the report. The information is subject to change without any prior notice.
Technical Indicators Defined: -
Support: A level at which the stock prices tend to find support if they are falling, and a downtrend may take a pause backed by demand or buying interest. Support 1 refers to the nearby support level for the stock and if the price breaches the level, then Support 2 may act as the crucial support level for the stock.
Resistance: A level at which the stock prices tend to find resistance when they are rising, and an uptrend may take a pause due to profit booking or selling interest. Resistance 1 refers to the nearby resistance level for the stock and if the price surpasses the level, then Resistance 2 may act as the crucial resistance level for the stock.
Stop-loss: It is a level to protect further losses in case of unfavourable movement in the stock prices.
Disclaimer This report has been issued by Kalkine New Zealand Limited (FSP691351) (NZBN:9429047678101) (“Kalkine”). Kalkine is a Financial Advice Provider (“FAP”) and is authorised by a Class 1 Financial Advice Provider Licence issued by Financial Markets Authority (“FMA”) to provide financial advice. Kalkine provides only general financial advice through its research reports following a person becoming a member. The reports contain buy/sell/hold and other recommendations in relation to equity securities, managed funds and other managed investment schemes and other financial advice products. The recommendations and opinions in this report and on Kalkine website do not take into account any of your investment objectives, financial situation or needs. Before you make a decision about whether to acquire a financial product, you should obtain the Product Disclosure Statement from the product issuer. You should consider the appropriateness of advice taking into account your own objectives, financial situation and needs and seek independent financial advice before making any financial decisions. If you act on the advice in the research reports, you may have to pay fees, expenses or other amounts (but not to Kalkine). Further information about the complaints and dispute resolution process, as well as information about Kalkine’s duties are available on Kalkine’s website. Please read our Financial Advice Provider (FAP) disclosure statement and Complaints Handling Guide, which are available on the website.
Past performance is not a reliable indicator of future performance.
 Please wait processing your request...