
Company Overview:
Manawa Energy Limited (NZX: MNW) is one of Aotearoa New Zealand’s largest renewable electricity generators. Chatham Rock Phosphate Limited (NZX: CRP) is an exploration and development company which is focused towards becoming a diversified phosphate developer and trader.
Kalkine’s Sector Report covers the Investment Highlights, Key Financial Metrics, Risks, Outlook, Technical Analysis along with the Valuation, Target Price, and Recommendation on the stock.
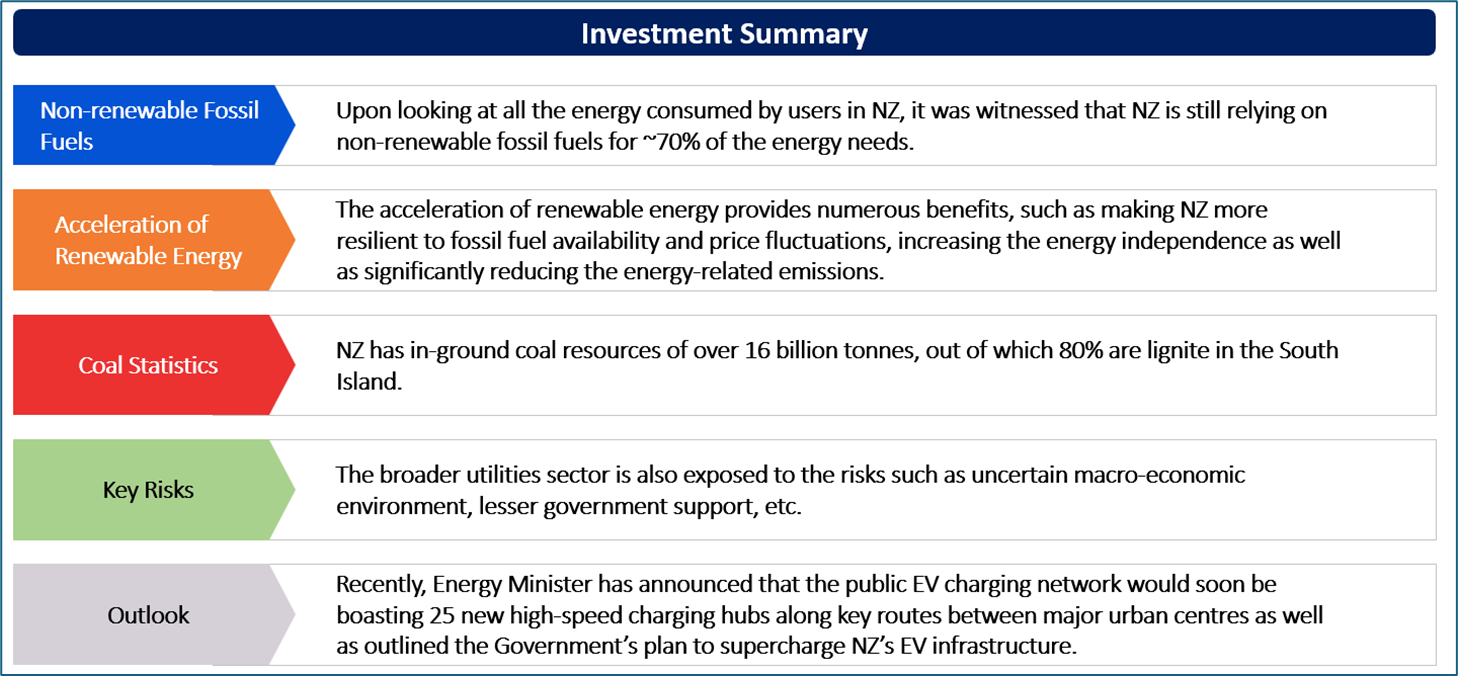
As per EECA, while NZ’s electricity system is powered by highly renewable energy sources, the electricity only forms part of the picture. Upon looking at all the energy consumed by users in NZ, it was witnessed that NZ is still relying on non-renewable fossil fuels for ~70% of the energy needs. These fossil fuels produce large quantities of greenhouse gas emissions when burned, with energy use responsible for more than 40% of NZ’s total greenhouse gas emissions.
The acceleration of renewable energy provides numerous benefits, such as making NZ more resilient to fossil fuel availability and price fluctuations, increasing the energy independence as well as significantly reducing the energy-related emissions. EECA’s refreshed strategic direction for 2024– 2028 would deliver on the legislative purpose to encourage, promote as well as support energy efficiency, energy conservation and the use of renewable sources of energy.
As per the Statement of Intent (1 July 2024 — 30 June 2028) released by EECA, there are 3 strategic objectives which are expected to guide NZ’s decision-making over the next 4 years. Firstly, energy efficiency focuses towards helping New Zealanders and businesses seize every opportunity to utilise energy as efficiently as possible to optimise the energy system, increase energy security as well as unlock cost savings. Secondly, empowering energy users helps New Zealanders and businesses to understand and manage the use of energy. Thirdly, accelerating the renewable energy drives the electrification of energy system with the support of other renewable fuels.
New Zealand’s Energy Emissions
NZ’s energy emissions are dominated by 3 main sectors — national transport, manufacturing industries as well as electricity generation. As per MBIE, the emissions from national transport make up for the largest share of total energy sector emissions. The emissions from manufacturing have witnessed an increase over recent years. The level can vary significantly depending on the level of methanol production, which has historically been the large source of emissions.
The electricity generation emissions have witnessed a significant increase since 1990, although there are large annual variations within this sector. These reflect the cost as well as availability of hydro generation, which NZ relies heavily on.
Exhibit 1: Electricity generation emissions (Kilotonnes carbon dioxide equivalent (kt CO2-e)), Calendar year quarters
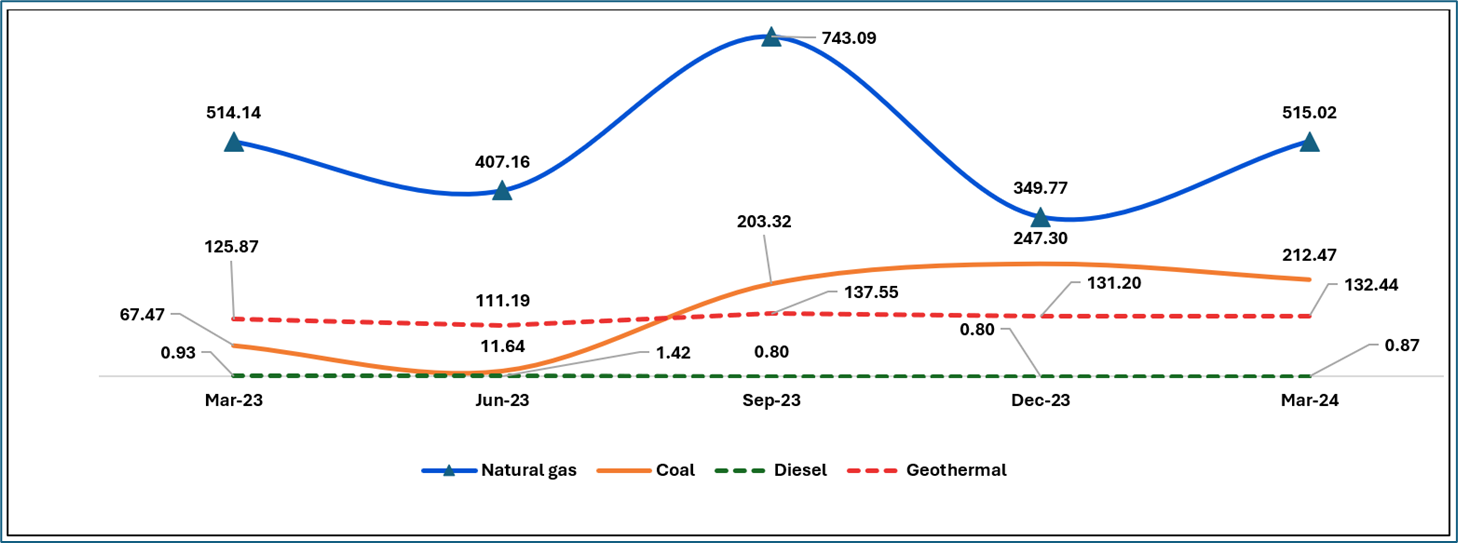
Data Source: This work is owned by the Ministry of Business, Innovation and Employment on behalf of the Crown which are licensed for reuse under the Creative Commons Attribution 4.0 International Licence; Chart Created by Kalkine Group
Coal Statistics
NZ has in-ground coal resources of over 16 billion tonnes, out of which 80% are lignite in the South Island. There are also significant resources of sub-bituminous coal in both islands, and the lesser amount of high-quality bituminous coal, mainly on the West Coast of the South Island. Most of NZ’s premium bituminous coal gets exported. It's valued internationally for low ash and sulphur content and characteristics like high swelling, fluidity and reactivity, which allow blending with other coals for usage in the steel industry.
With respect to domestic use, electricity generation (including cogeneration) accounts for the largest amount of domestic coal use.
Exhibit 2: Quarterly Coal Supply (Production) Petajoules (PJ)
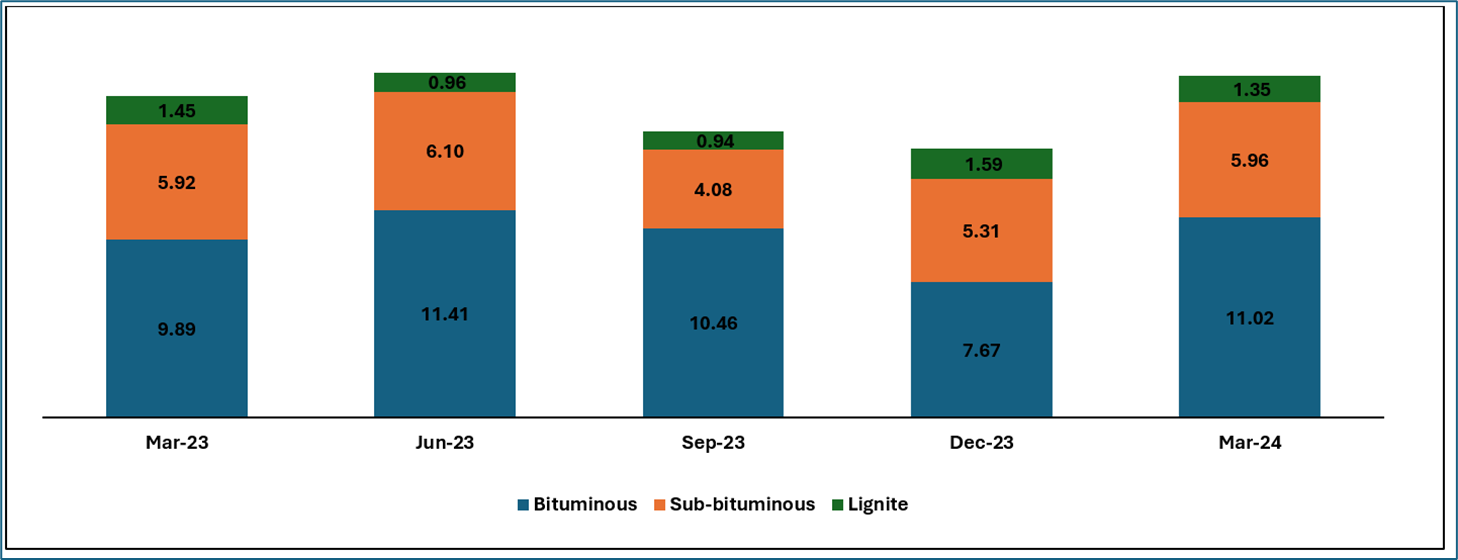
Data Source: This work is owned by the Ministry of Business, Innovation and Employment on behalf of the Crown which are licensed for reuse under the Creative Commons Attribution 4.0 International Licence; Chart Created by Kalkine Group
Key Risks and Challenges:
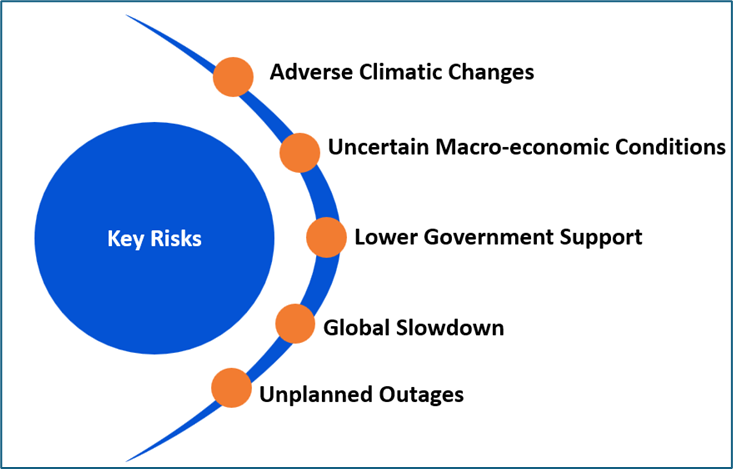
The companies operating in the energy sector are exposed to risks such as higher generation costs, reduced hydro inflows as well as unplanned outages. Apart from these risks, the higher fuel costs and emissions are other additional risks. Notably, fluctuation in the fuel costs might also pose a challenge for the broader utilities sector. The sector could get adversely impacted because of climate-related risks.
The broader utilities sector is also exposed to the risks such as uncertain macro-economic environment, lesser government support, etc.
Exhibit 3. Key Risks in Utilities Sector:
Source:- Analysis: Kalkine Group
Outlook:
With diverse renewable energy options, NZ is well-placed to transition to a sustainable, low-emissions energy system. Electricity would be playing a significant role in the low-cost transition away from fossil fuels, alongside other renewable fuels where electrification is not viable. NZ possesses the real opportunity to build an energy system which meets the needs of energy users while maintaining affordability, balancing reliability and resilience, increasing productivity, and achieving positive environmental outcomes.
Recently, Energy Minister has announced that the public EV charging network would soon be boasting 25 new high-speed charging hubs along key routes between major urban centres as well as outlined the Government’s plan to supercharge NZ’s EV infrastructure. The Government has the plan to significantly increase the number of public EV chargers throughout NZ with the goal of 10,000 charging points by 2030. This is part of the ambitious target to reduce net greenhouse gas emissions, aligned with NZ’s Net Zero 2050 goal.
Apart from the sector-specific factors, an analysis on two NZX-listed companies is provided. This report covers their insights, outlook, performance and potential as expected to be delivered in the near to medium term.
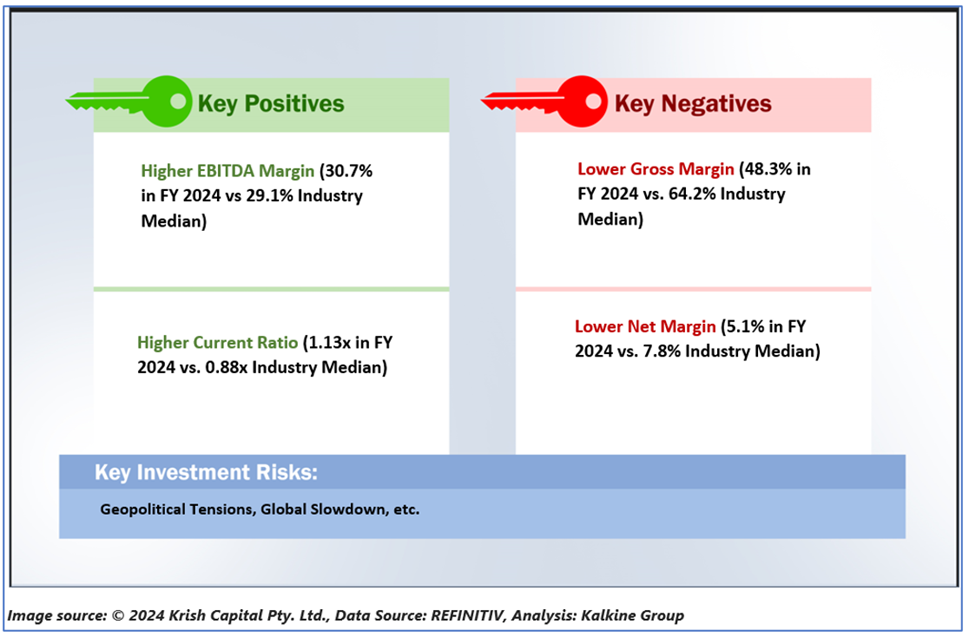
1) Manawa Energy Limited (Recommendation: Buy, Potential Upside: Low Double-Digit) (M-Cap: NZD 1.25 billion, Annual Dividend Yield (TTM)1: 6.56%)
Business Description:
Manawa Energy Limited (NZX: MNW) is one of Aotearoa New Zealand’s largest renewable electricity generators.
Outlook:
MNW is expecting EBITDAF for the year ended 31 March 2025 to be in the range of $95 Mn - $115 Mn. At the time of releasing FY 2024 results, the company mentioned about high quality development pipeline of over 1,200MW of secured solar as well as wind development options.
MNW has reset the business as an independent power producer (or IPP) focused on delivering for shareholders via strong asset management, a clear focus on value creation, and progressing the competitive new development pipeline.
Technical Overview:

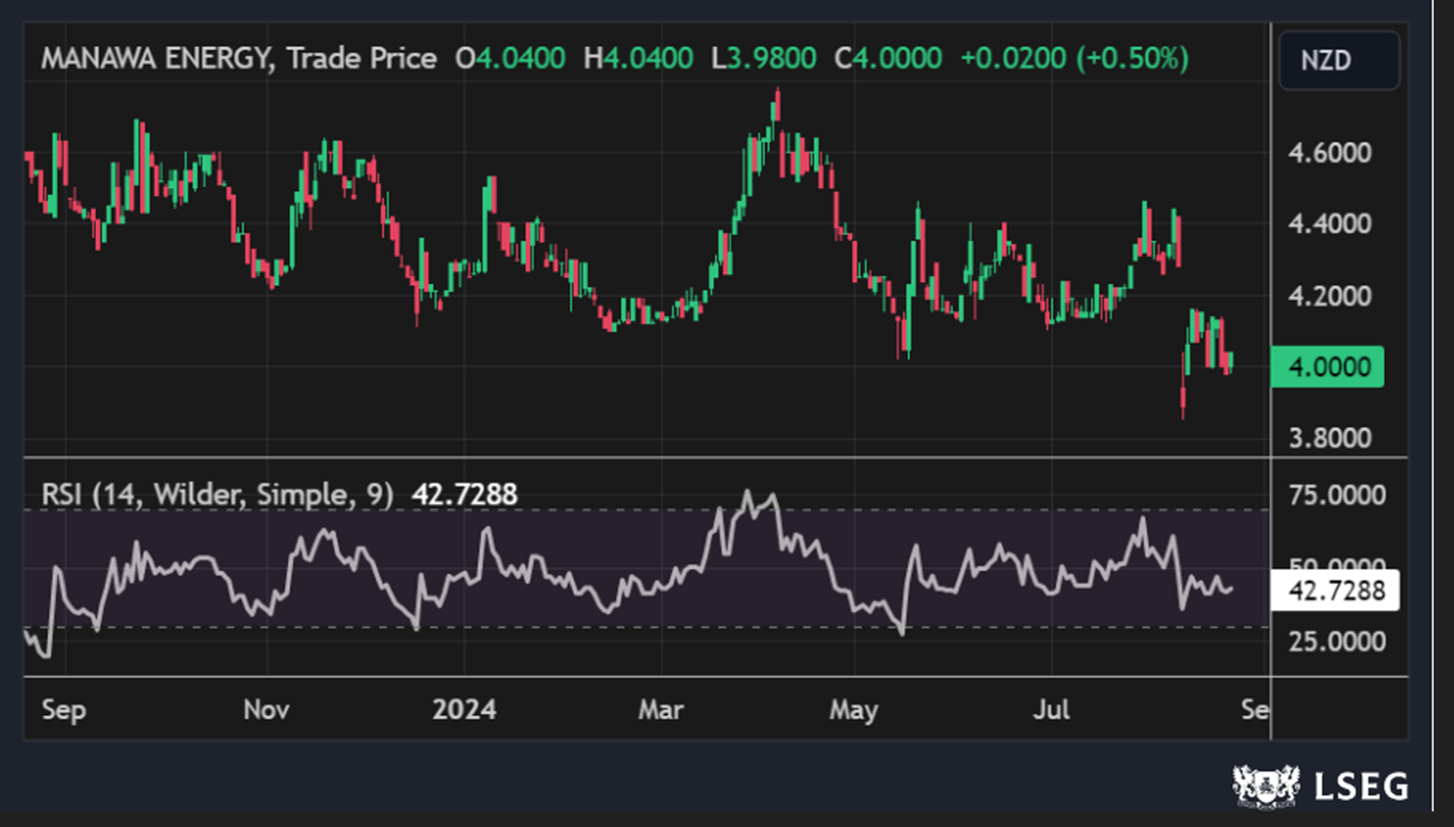
MNW Daily Technical Chart, Data Source: REFINITIV
Technical Commentary:
On the daily chart, while developing a trading range during a downtrend, MNW’s stock prices are forming a Head and shoulders pattern, suggesting the mentioned downtrend might resume soon. Moreover, the momentum oscillator RSI (14-period) is trading below the midpoint, adding further evidence to the mentioned recommendation. Prices are trading between its previous peak and trough, which might function as resistance and support levels for the stock, respectively. A significant support level for the stock is positioned at NZD 3.6, while critical resistance level is located at NZD 4.6.
Fundamental Valuation:
Price/EPS Based Relative Valuation
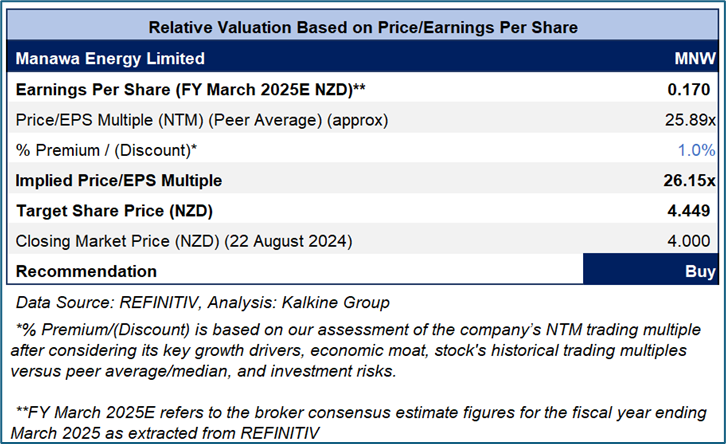
Stock Recommendation
Considering the facts above, a ‘Buy’ recommendation on the stock has been provided at the closing market price of NZD 4.00 per share, up by 0.50% as on 22 August 2024.
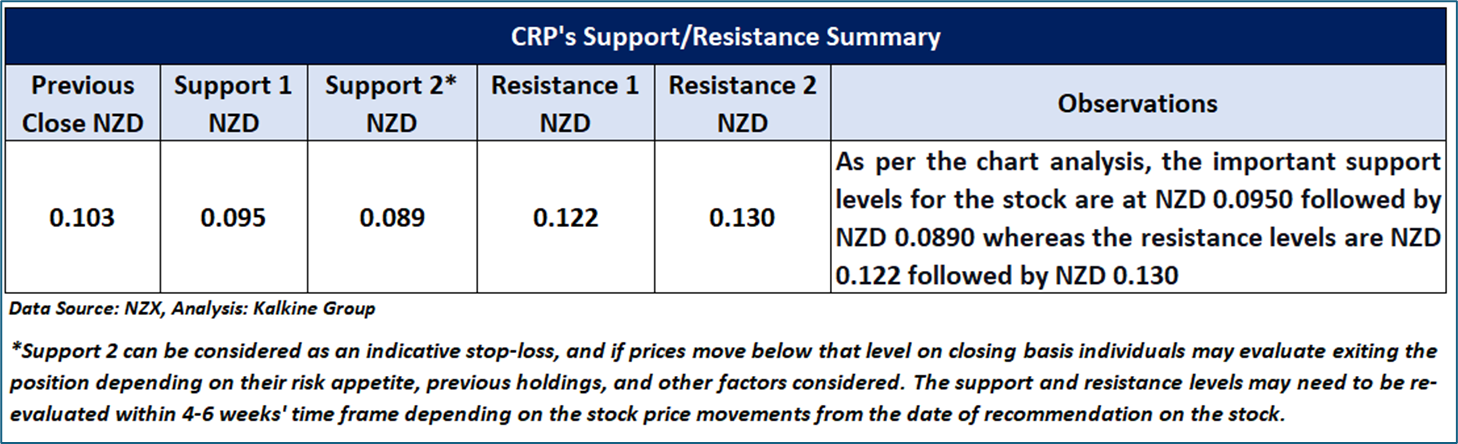
2) Chatham Rock Phosphate Limited (Recommendation: Speculative Buy, Potential Upside: Low Double-Digit) (M-Cap: NZD 10.6 million)
Business Description:
Chatham Rock Phosphate Limited (NZX: CRP) is an exploration and development company focused towards becoming diversified phosphate developer and trader.
Outlook:
CRP advised that the Korella North Mine ML100379 permitting process takes another major move forward with signing of the Road Use Agreement with Cloncurry Shire Council. At the same time, the work continues with traffic engineers Premise Australia in order to prepare an application to Council to increase annual road haul tonnage to 100,000 tonnes per annum which would also require the additional consent of the Queensland Department of Transport and Main Roads to transport phosphate on State controlled roads.
Technical Overview:
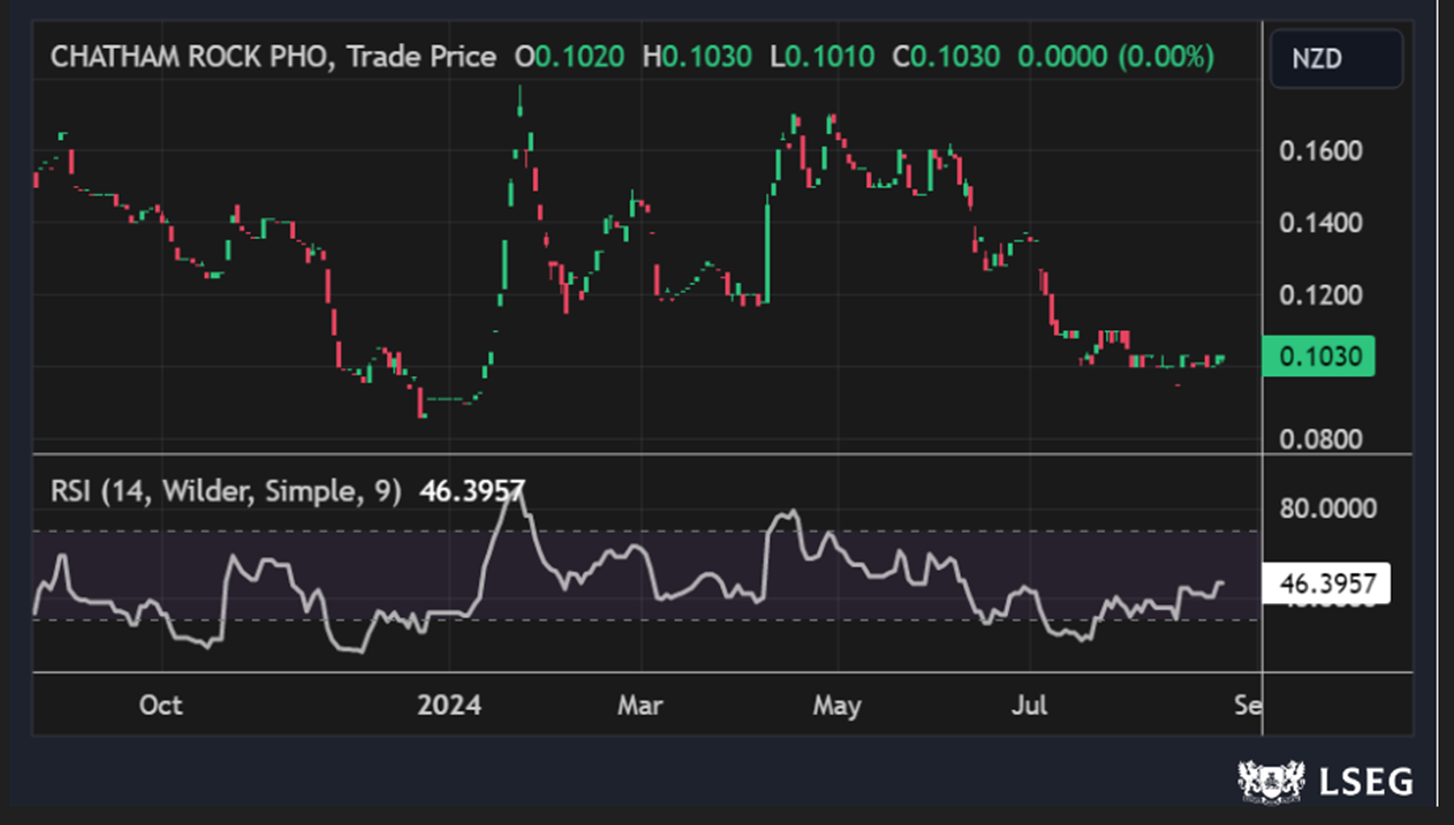
CRP Daily Technical Chart, Data Source: REFINITIV
Technical Commentary
On the daily chart, CRP’s stock prices are establishing a trading range characterized by lower highs and higher lows, suggesting that the current sideways period in the stock might continue to remain in place in the near future. Moreover, the momentum oscillator RSI (14-period) is trading near the midpoint, providing more support to the previous observation. Prices fluctuating between its previous peak and trough, which might function as dynamic resistance and support levels for the stock, respectively. A significant support level for the stock is positioned at NZD 0.095, while critical resistance level is located at NZD 0.122.
Stock Recommendation
Considering the aforementioned factors, a “Speculative Buy” rating is given on the stock at the closing market price of NZD 0.103 per share as on 22nd August 2024.
Markets are trading in a highly volatile zone currently due to certain macro-economic issues and geopolitical tensions prevailing. Therefore, it is prudent to follow a cautious approach while investing.
Note 1: Past performance is neither an indicator nor a guarantee of future performance.
Note 2: The reference date for all price data, currency, technical indicators, support, and resistance levels is 22 August 2024. The reference data in this report has been partly sourced from REFINITIV.
Note 3: Investment decisions should be made depending on an individual's appetite for upside potential, risks, holding duration, and any previous holdings. An 'Exit' from the stock can be considered if the Target Price mentioned as per the Valuation and or the technical levels provided has been achieved and is subject to the factors discussed above.
Technical Indicators Defined: -
Support: A level at which the stock prices tend to find support if they are falling, and a downtrend may take a pause backed by demand or buying interest. Support 1 refers to the nearby support level for the stock and if the price breaches the level, then Support 2 may act as the crucial support level for the stock.
Resistance: A level at which the stock prices tend to find resistance when they are rising, and an uptrend may take a pause due to profit booking or selling interest. Resistance 1 refers to the nearby resistance level for the stock and if the price surpasses the level, then Resistance 2 may act as the crucial resistance level for the stock.
Stop-loss: It is a level to protect further losses in case of unfavourable movement in the stock prices.
Disclaimer This report has been issued by Kalkine New Zealand Limited (FSP691351) (NZBN:9429047678101) (“Kalkine”). Kalkine is a Financial Advice Provider (“FAP”) and is authorised by a Class 1 Financial Advice Provider Licence issued by Financial Markets Authority (“FMA”) to provide financial advice. Kalkine provides only general financial advice through its research reports following a person becoming a member. The reports contain buy/sell/hold and other recommendations in relation to equity securities, managed funds and other managed investment schemes and other financial advice products. The recommendations and opinions in this report and on Kalkine website do not take into account any of your investment objectives, financial situation or needs. Before you make a decision about whether to acquire a financial product, you should obtain the Product Disclosure Statement from the product issuer. You should consider the appropriateness of advice taking into account your own objectives, financial situation and needs and seek independent financial advice before making any financial decisions. If you act on the advice in the research reports, you may have to pay fees, expenses or other amounts (but not to Kalkine). Further information about the complaints and dispute resolution process, as well as information about Kalkine’s duties are available on Kalkine’s website. Please read our Financial Advice Provider (FAP) disclosure statement and Complaints Handling Guide, which are available on the website.
Past performance is not a reliable indicator of future performance.
 Please wait processing your request...