
Overview:
Marlin Global Limited (NZX: MLN) is a listed investment company that invests in growing companies based outside of New Zealand and Australia. General Capital Limited (NZX: GEN) is a New Zealand-based financial services company. The principal activities are financial services, and research and advisory services.
Kalkine’s Daily Report covers the Investment Highlights, Key Financial Metrics, Risks, Outlook, Technical Analysis, Key Support and Resistance Levels, and Recommendation on the stock.
Sector Landscape and Outlook
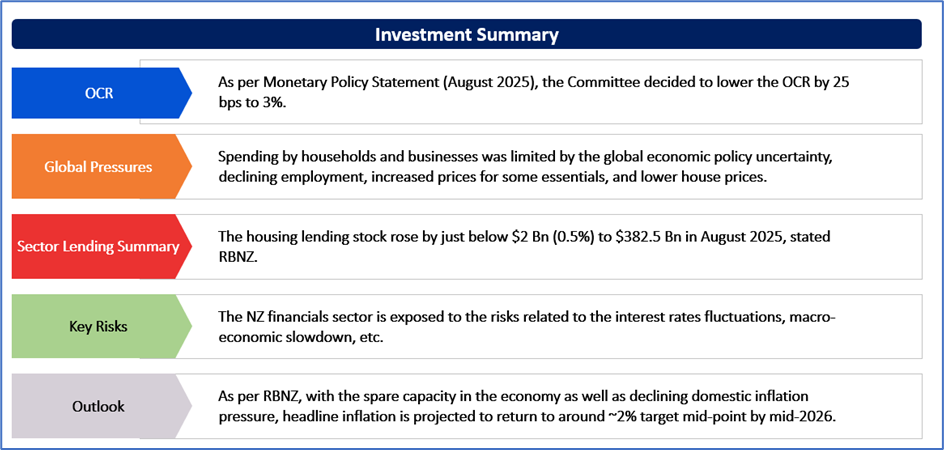
As per Monetary Policy Statement (August 2025), the Committee decided to lower the OCR by 25 bps to 3%. The annual consumers price index inflation is presently around the top of the Monetary Policy Committee’s 1% - 3% target band. NZ’s economic recovery stalled in Q2 of this year. Spending by households and businesses was limited by the global economic policy uncertainty, declining employment, increased prices for some essentials, and lower house prices. Notably, the cautious behaviour by households and businesses can further impact the economic growth.
RBNZ also stated that the subdued demand as well as low profitability have been contributing to financial stress for some businesses. Non-performing loans for households and businesses increased but are low compared to the previous cycle peaks.
Exhibit 1: OCR (%)
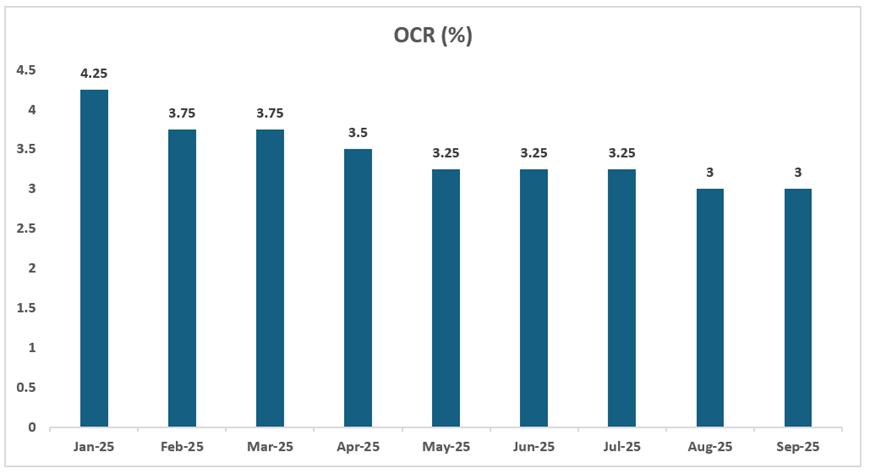
Data Source: This work is based on/includes rbnz data which are licensed by rbnz.govt.nz for reuse under the Creative Commons Attribution 4.0 International Licence; Chart Created by Kalkine Group
Sector Lending Summary – Banks & NBLIs (August 2025)
RBNZ released data about sector lending (Banks & NBLIs) for August 2025. The housing lending stock rose by just below $2 Bn (0.5%) to $382.5 Bn in August 2025. The annual growth rate increased from 5.1% to 5.3%, reflecting the highest rate since the month of September 2022. The personal consumer lending stock rose $100 Mn (or 0.7%), with the annual growth rate rising from 1.1% to 1.5% in August 2025. This monthly rise was because of the increases for Banks and Non-Bank Lending Institutions (NBLIs) of $61 Mn (or 0.8%) and $39 Mn (or 0.6%), respectively. The business lending stock rose by $1.1 Bn (or 0.8%). This was the largest monthly rise since November 2024. The total business lending stock increased to $137.9 Bn in August 2025, nearing the high of $138.5 Bn which was recorded in January 2025.
Exhibit 2: Sector Lending Annual Growth Rates (%)
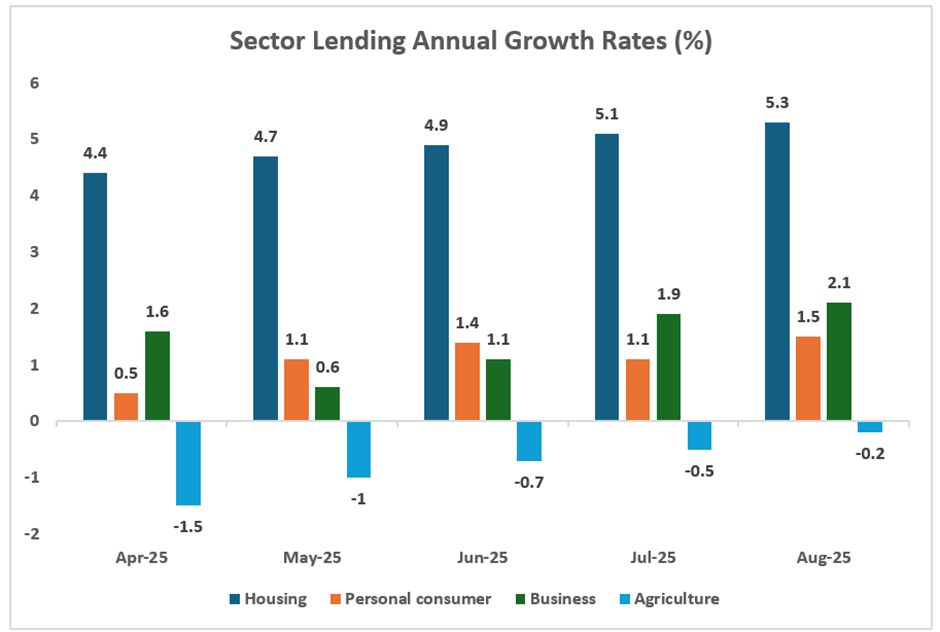
Data Source: This work is based on/includes rbnz data which are licensed by rbnz.govt.nz for reuse under the Creative Commons Attribution 4.0 International Licence; Chart Created by Kalkine Group
Annual Seasonally Adjusted Total Billings in NZ Witnessed a Rise
RBNZ recently released data about credit card summary (August 2025). The seasonally adjusted total billings in NZ amounted to $4.5 Bn in August 2025. Annually, this was an increase of 3.5% from August 2024. Notably, the seasonally adjusted domestic billings on NZ issued cards amounted to $3.9 Bn in August 2025, reflecting a rise of 1.9% from July 2025, and up 4.8% from August 2024.
Furthermore, overseas billings on NZ issued cards stood at $699.3 Mn in August-25, down by 8.6% from July 2025. Annually, there was a decline of 0.3% from August 2024. The credit limit utilisation rose to 28.6% at August 2025 end.
Key Risks and Challenges:
As per RBNZ, the household consumption growth has witnessed an increase, but remains subdued. Also, consumption rose by 1% in the year to March 2025 quarter, broadly in line with the population growth. The weakness in household spending demonstrates previously restrictive interest rates, a weak labour market, subdued house price growth as well as below‑average population growth. Overall, the NZ financials sector is exposed to the risks related to the interest rates fluctuations, macro-economic slowdown, etc.
Exhibit 3. Key Risks in Financial Sector:
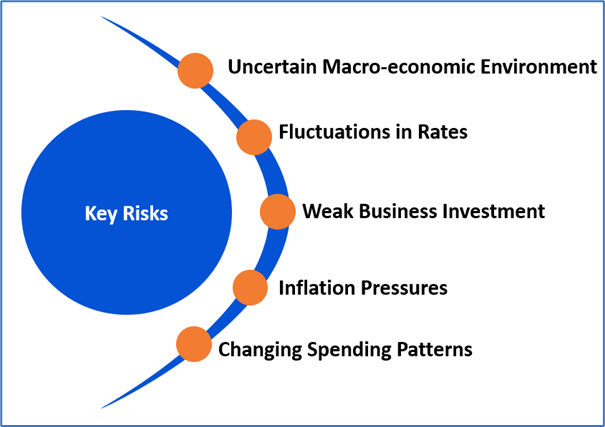
Source: Analysis by Kalkine Group
Outlook:
As per RBNZ, with the spare capacity in the economy as well as declining domestic inflation pressure, headline inflation is projected to return to around ~2% target mid-point by mid-2026. The increased provisions and strong capital buffers demonstrate that the banks remain well-prepared to absorb any sort of losses. The Committee highlighted that the monetary policy settings which help growth in the economy would also be contributing to the financial stability.
RBNZ stated that the household consumption growth is assumed to increase due to the lower interest rates as well as higher population growth. Notably, inflation is projected to increase in the September 2025 quarter, before it returns to near the MPC’s 2% target mid‑point.
Apart from the sector-specific factors, an analysis on 2 NZX-listed companies is provided. This report covers their insights, outlook, performance and potential as expected to be delivered in the near to medium term.
1) Marlin Global Limited (Recommendation: Hold, Potential Upside: Low Double-Digit) (M-Cap: NZD 215.9 million, Annual Dividend Yield (TTM)1: 8.92%)
Business Description:
Marlin Global Limited (NZX: MLN) is a listed investment company which invests in growing companies based outside of NZ and Australia.
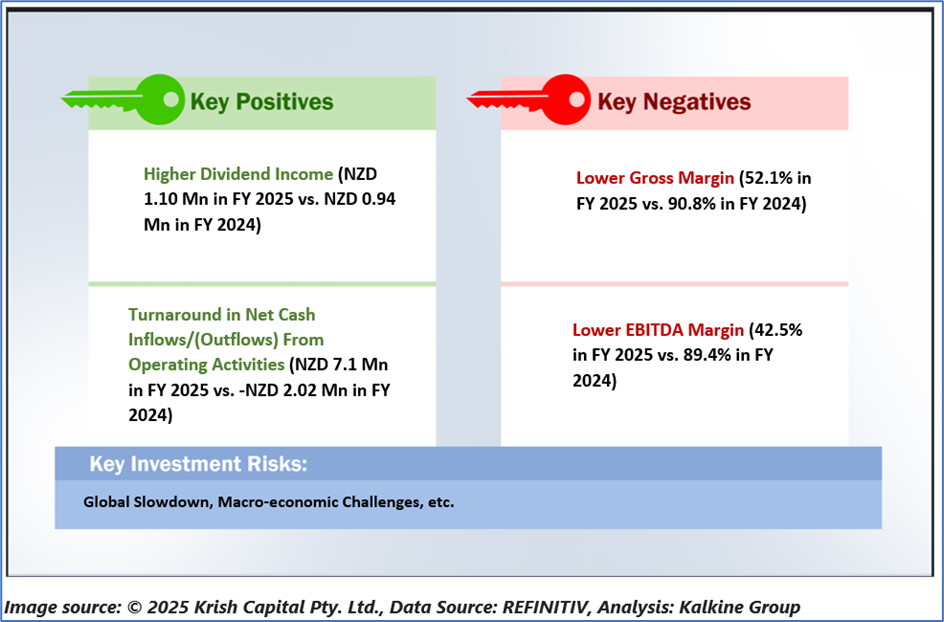
Outlook:
The portfolio’s emphasis towards quality, growth-oriented businesses is the cornerstone of its investment strategy, making sure that the portfolio is made up of companies possessing clearly identified competitive advantages. Therefore, these are expected to perform moving forward as and when market sentiment recognises their robust fundamentals. The board remains confident in MLN’s medium to long-term prospects.
Technical Overview:
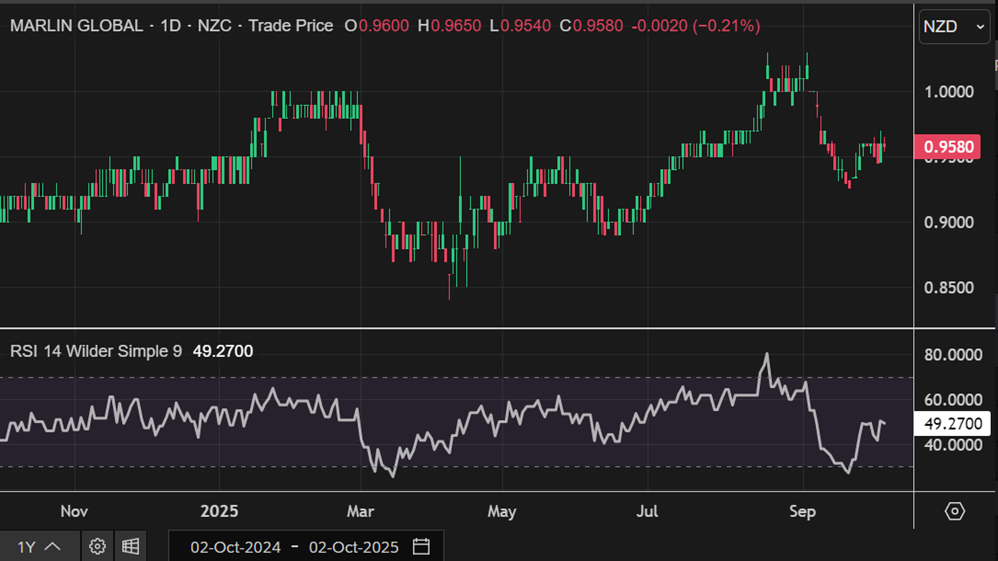
MLN Daily Technical Chart, Data Source: REFINITIV
Technical Commentary
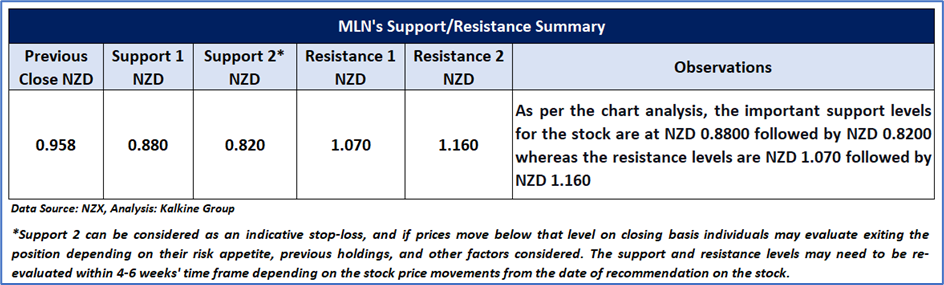
On the daily chart, MLN is holding above its rising trendline support, reinforcing the prevailing bullish structure. The 14-period RSI stands at ~49.27, reflecting ongoing bullish momentum. The stock also remains above its 21-period SMA, which is expected to serve as immediate support. Key levels to watch include support at NZD 0.88 and resistance at NZD 1.07. Sustaining above support will be crucial for preserving the positive outlook, while a breakout above resistance could open the door to further upside.
Stock Recommendation
Considering the facts above, a ‘Hold’ recommendation on the stock has been provided at the closing market price of NZD 0.958 per share, down by 0.21% as on 2 October 2025.
2) General Capital Limited (Recommendation: Hold, Potential Upside: Low Double-Digit) (M-Cap: NZD 24.3 Mn, Annual Dividend Yield (TTM)1: ~5.17%)
Business Description:
General Capital Limited (NZX: GEN) is a New Zealand-based financial services company. The principal activities are financial services, and research and advisory services.
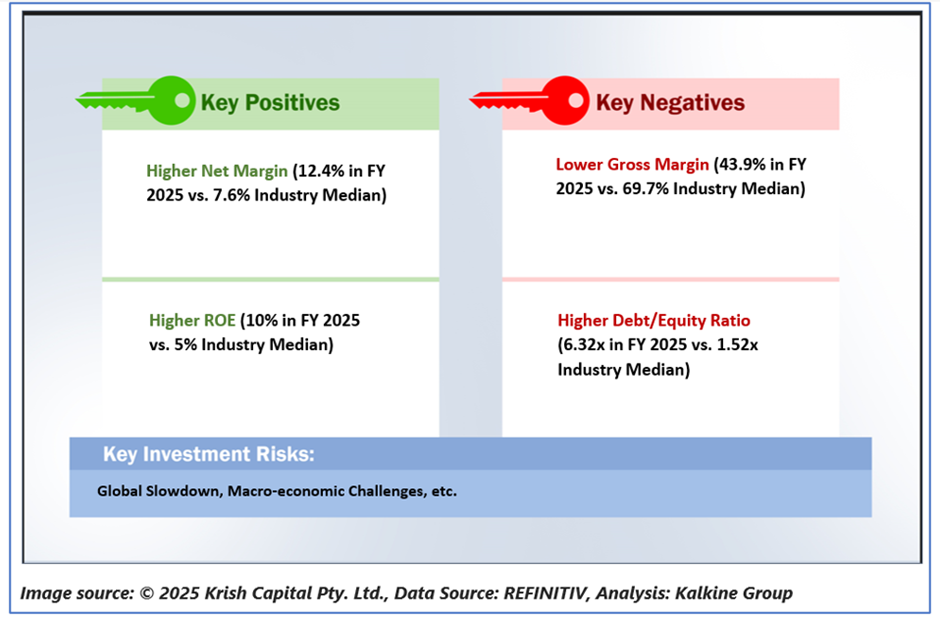
Outlook:
GEN remains resilient and remains focused on opportunities amidst challenges. The company remains well-capitalised and is in a robust position to pursue the earnings-accretive acquisitions. Over the upcoming year, the company will focus on acquisitions, mergers, and takeovers in a bid to further strengthen and expand its business. The company remains well-positioned to leverage growth opportunities as well as focus towards delivering an increased lending book.
Technical Overview:
Technical Commentary
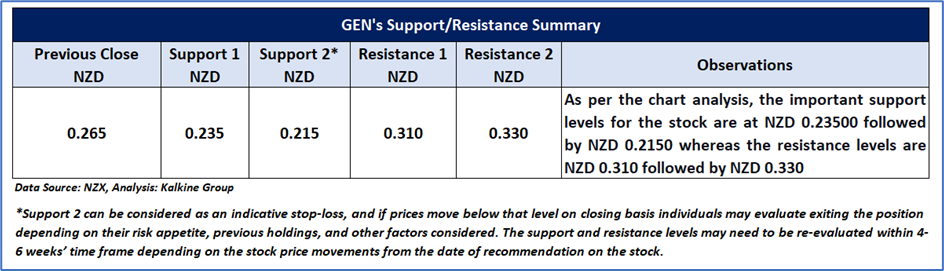
On the daily chart, GEN is holding above its horizontal trendline support, reinforcing the prevailing bullish structure. The 14-period RSI is at ~48.48, showing signs of recovery from lower levels. The stock also trades above its 21-period SMA, which is likely to act as immediate support. Key levels to monitor are support at NZD 0.235 and resistance at NZD 0.31. Maintaining support will be essential to preserving the positive outlook, while a breakout above resistance could pave the way for further upside.
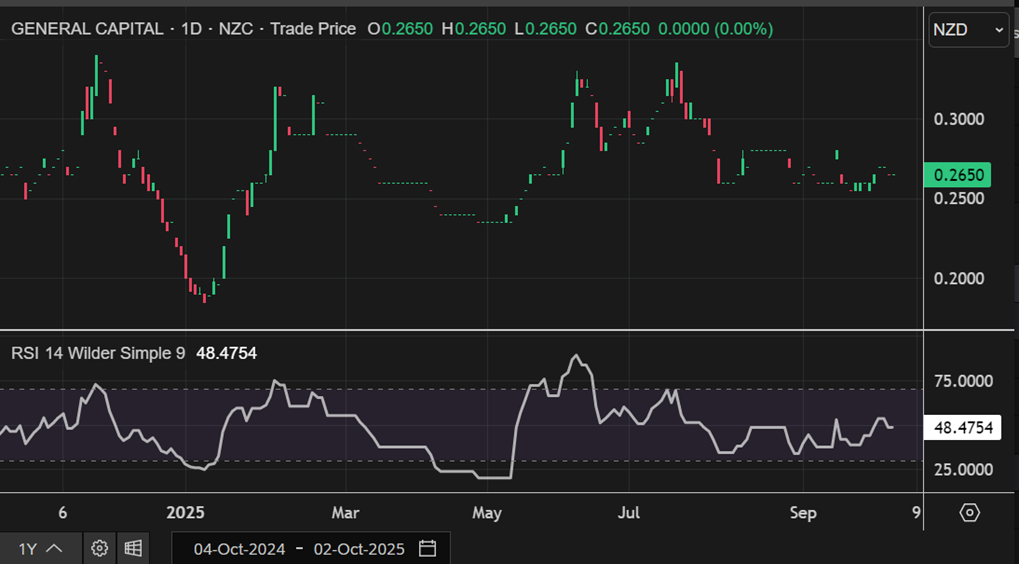
GEN Daily Technical Chart, Data Source: REFINITIV
Stock Recommendation
Considering the facts above, a ‘Hold’ recommendation on the stock has been provided at the closing market price of NZD 0.265 per share as on 2 October 2025
Note 1: Past performance is not a reliable indicator of future performance.
Note 2: The reference date for all price data, currency, technical indicators, support, and resistance levels is October 2, 2025. The reference data in this report has been partly sourced from REFINITIV.
Note 3: Investment decisions should be made depending on an individual's appetite for upside potential, risks, holding duration, and any previous holdings. An 'Exit' from the stock can be considered if the Target Price mentioned as per the Valuation and or the technical levels provided has been achieved and is subject to the factors discussed above.
Note 4: Annual Dividend Yield is on a Trailing Twelve Month (TTM1) basis and are subject to change based on factors such as company performance, stock price changes, etc.
Note 5: Kalkine reports are prepared based on the stock prices captured either from REFINITIV or Trading View. Typically, REFINITIV or Trading View may reflect stock prices with a delay which could be a lag of 25-30 minutes. There can be no assurance that future results or events will be consistent with the information provided in the report. The information is subject to change without any prior notice.
Technical Indicators Defined: -
Support: A level at which the stock prices tend to find support if they are falling, and a downtrend may take a pause backed by demand or buying interest. Support 1 refers to the nearby support level for the stock and if the price breaches the level, then Support 2 may act as the crucial support level for the stock.
Resistance: A level at which the stock prices tend to find resistance when they are rising, and an uptrend may take a pause due to profit booking or selling interest. Resistance 1 refers to the nearby resistance level for the stock and if the price surpasses the level, then Resistance 2 may act as the crucial resistance level for the stock.
Stop-loss: It is a level to protect further losses in case of unfavourable movement in the stock prices.
This report (“Report”) has been issued by Kalkine New Zealand Limited (FSP691351) (NZBN:9429047678101) (“Kalkine”). Kalkine is a Financial Advice Provider (“FAP”) and is authorised by a Class 1 Financial Advice Provider Licence issued by Financial Markets Authority (“FMA”) to provide financial advice. Kalkine provides only general financial advice through its research reports following a person becoming a member. The reports contain buy/sell/hold and other recommendations in relation to equity securities, managed funds and other managed investment schemes and other financial advice products. The recommendations and opinions in this Report and on Kalkine website do not take into account any of your investment objectives, financial situation or needs. Before you make a decision about whether to acquire a financial product, you should obtain the Product Disclosure Statement from the product issuer. You should consider the appropriateness of advice taking into account your own objectives, financial situation and needs and seek independent financial advice before making any financial decisions. If you act on the advice in the research reports, you may have to pay fees, expenses or other amounts (but not to Kalkine).
The information in this Report and on the Kalkine website has been prepared from a wide variety of sources, which Kalkine, to the best of its knowledge and belief, considers accurate. Kalkine has made every effort to ensure the reliability of the information contained in its reports (including this Report), newsletters and websites. All information represents our views at the date of publication and may change without notice.
Kalkine does not issue, sell or deal in any financial products. The information in this Report does not constitute an offer to sell securities or other financial products or a solicitation of an offer to buy securities or other financial products. Our reports contain general recommendations to invest in securities and other financial products. Kalkine is not responsible for, and does not guarantee, the performance of, or returns on, any investments mentioned in this Report.
This Report may contain information on past performance of particular investments. Past performance is not a reliable indicator of future performance. Returns stated do not take into account transaction costs and taxes.
Further information about the complaints and dispute resolution process, as well as information about Kalkine’s duties are available on Kalkine’s website. Please read our Financial Advice Provider (FAP) disclosure statement and Complaints Handling Guide, which are available on the website.
Copyright 2025 Krish Capital Pty. Ltd. (ABN 61629651510). All Rights Reserved. No part of this Report, or its content, may be reproduced in any form without our prior consent.
Past performance is not a reliable indicator of future performance.
 Please wait processing your request...