
Section 1: Company Fundamentals
1.1 Company Overview and Performance summary
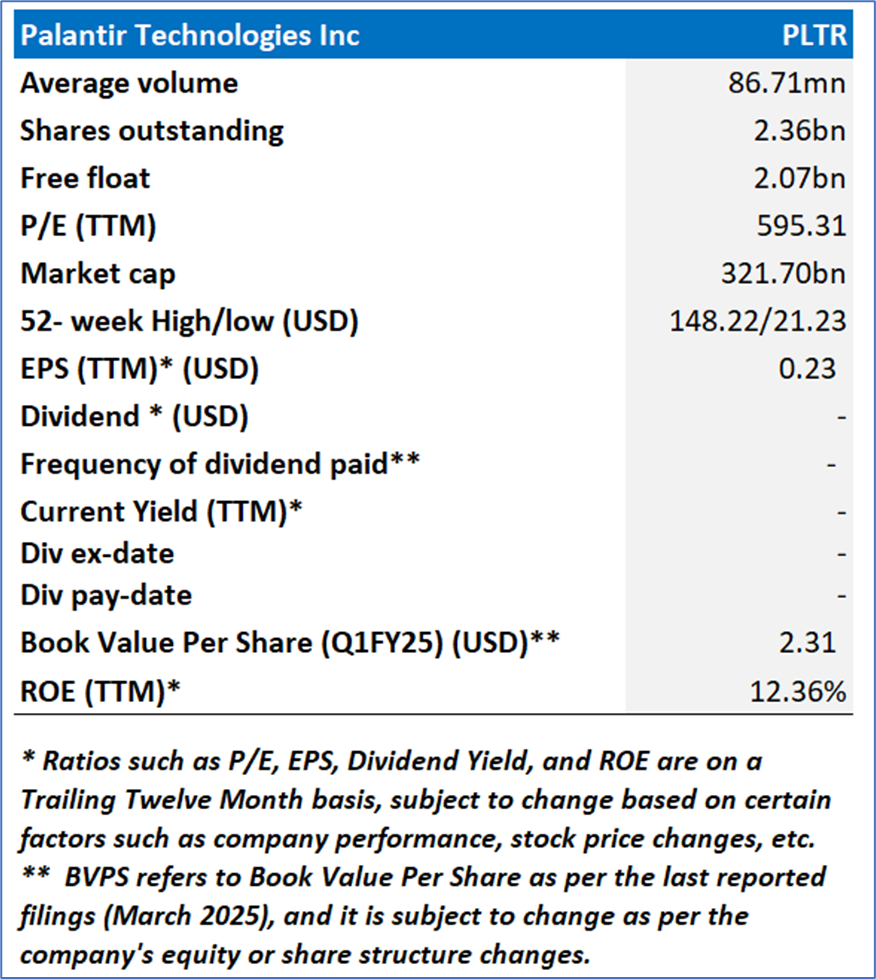
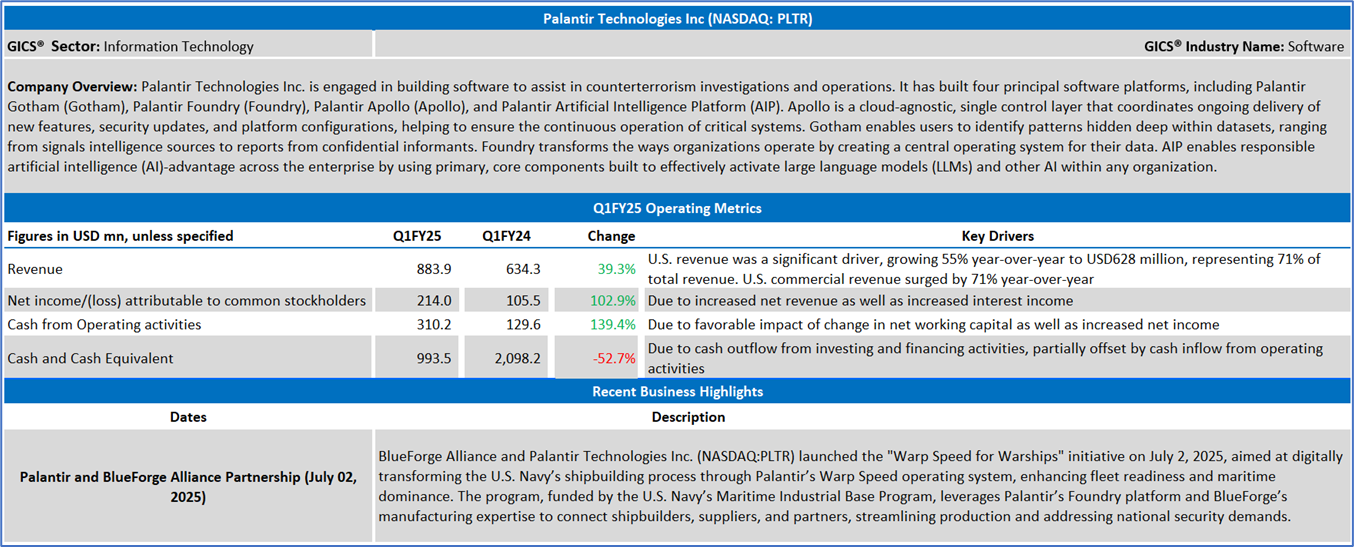
Company Overview:
Palantir Technologies Inc. (NASDAQ: PLTR) is engaged in building software to assist in counterterrorism investigations and operations. It has built four principal software platforms, including Palantir Gotham (Gotham), Palantir Foundry (Foundry), Palantir Apollo (Apollo), and Palantir Artificial Intelligence Platform (AIP). Apollo is a cloud-agnostic, single control layer that coordinates ongoing delivery of new features, security updates, and platform configurations, helping to ensure the continuous operation of critical systems. Gotham enables users to identify patterns hidden deep within datasets, ranging from signals intelligence sources to reports from confidential informants. Foundry transforms the ways organizations operate by creating a central operating system for their data. AIP enables responsible artificial intelligence (AI)-advantage across the enterprise by using primary, core components built to effectively activate large language models (LLMs) and other AI within any organization.
This Global AI and Emerging Market Report covers the Company Overview & Price performance, Summary table, Key positives & negatives, Key metrics, Company details, technical guidance & Stock recommendation, and Price chart.
1.2 Summary Table
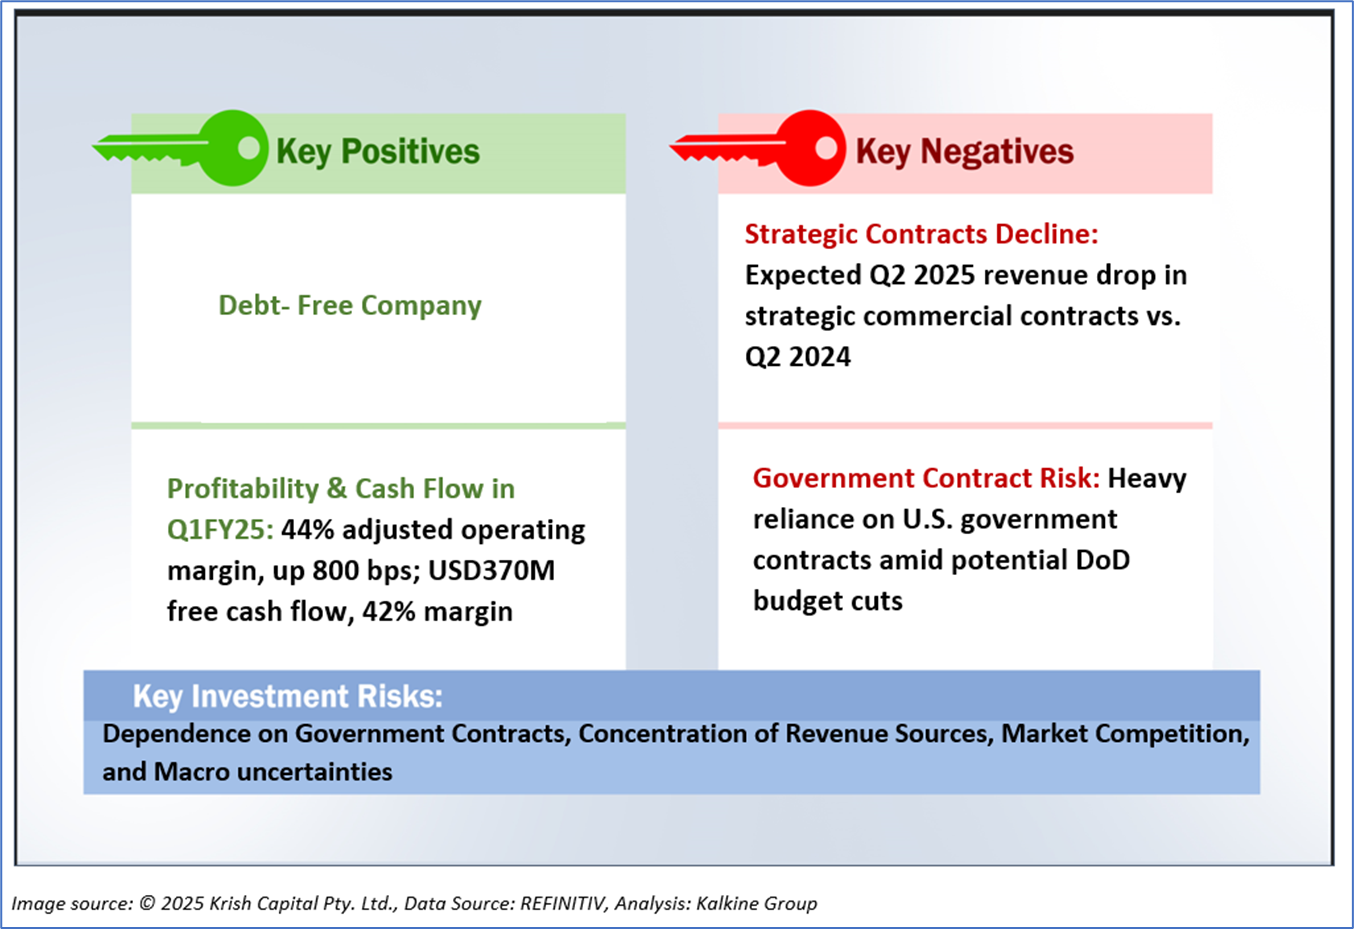
1.3 The Key Positives & Negatives
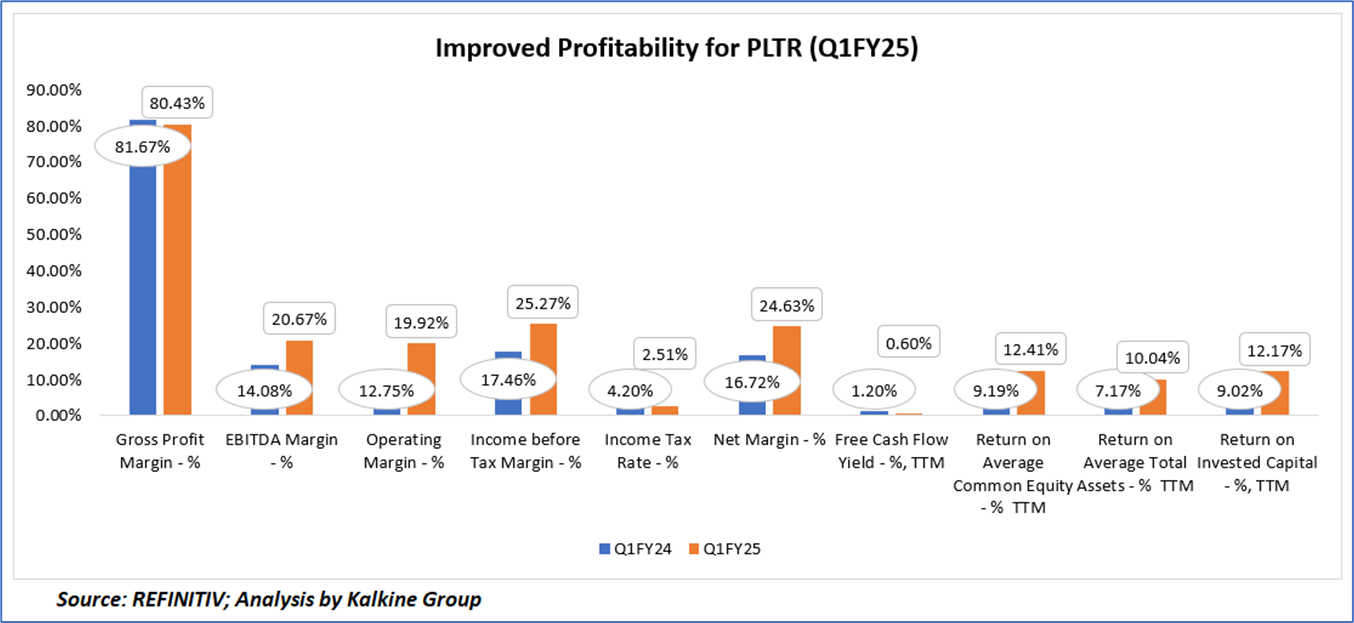
1.4 Key metrics
Palantir Technologies Inc. (NASDAQ: PLTR) demonstrated significant improvements in profitability and efficiency in Q1 FY2025 compared to Q1 FY2024, despite a slight decline in gross profit margin from 81.67% to 80.43% due to increased costs. The company’s EBITDA margin rose from 14.08% to 20.67% and operating margin increased from 12.75% to 19.92%, reflecting enhanced operational efficiency driven by strong revenue growth (39% YOY to USD884 million) and cost management. Income before tax margin improved from 17.46% to 25.27%, and net margin grew from 16.72% to 24.63%, bolstered by a reduced income tax rate from 4.20% to 2.51%, indicating higher profitability and tax efficiency. Additionally, return on average common equity (9.19% to 12.41%), return on average total assets (7.17% to 10.04%), and return on invested capital (9.02% to 12.17%) all improved significantly, showcasing better capital utilization and shareholder value creation. However, the trailing twelve-month free cash flow yield dropped from 1.20% to 0.60%, likely due to increased capital expenditures or stock price appreciation, suggesting a potential concern for investors focused on cash flow returns relative to market valuation.
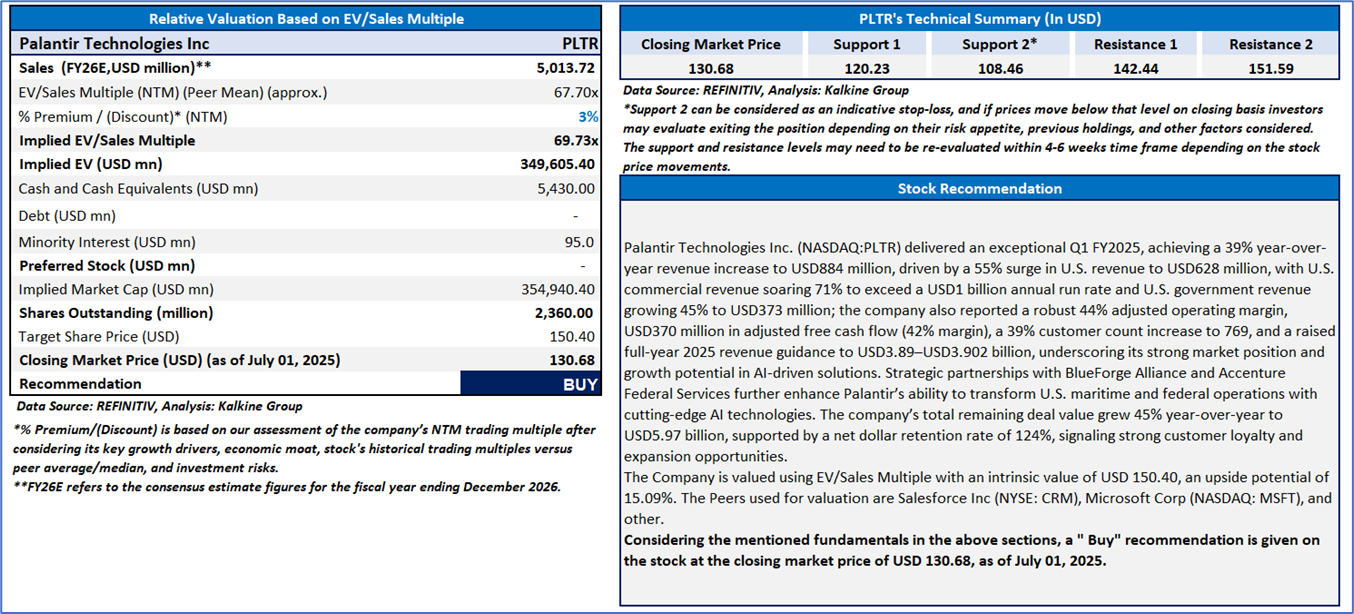
Section 2: Palantir Technologies Inc (NASDAQ: PLTR) (“Buy” at the closing market price of USD 130.68, as of July 01, 2025)
2.1 Company Details
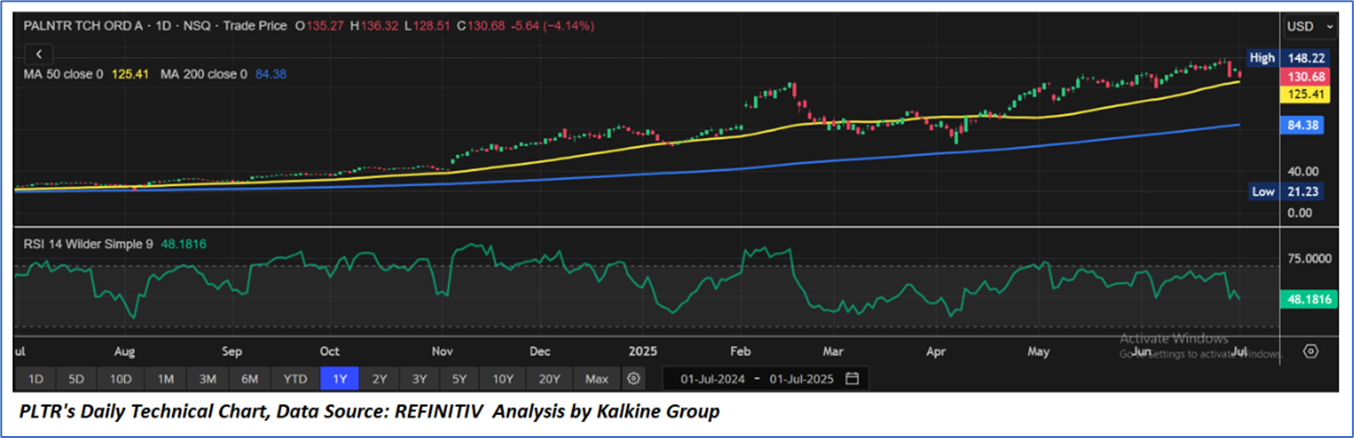
2.2 Technical Guidance and Stock Recommendation
Airship AI Holdings, Inc (NASDAQ: AISP)
Section 1: Company Fundamentals
1.1 Company Overview and Performance summary
Company Overview:
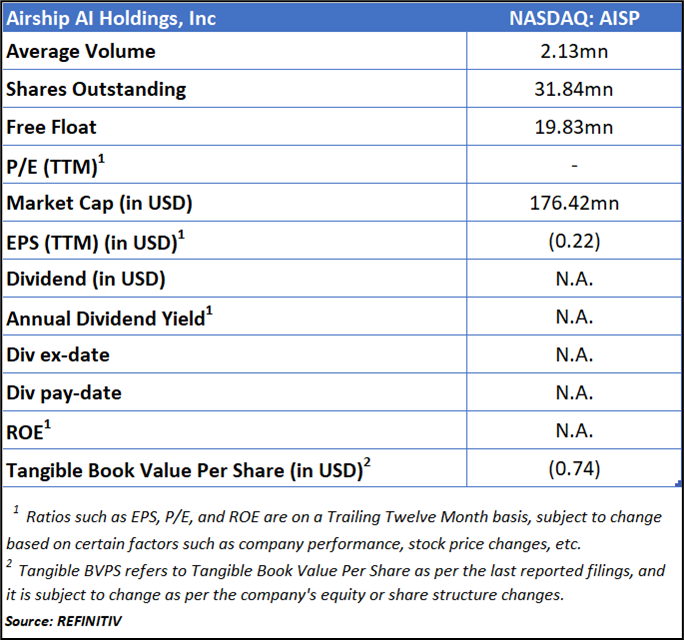
Airship AI Holdings, Inc (NASDAQ: AISP) is a tech firm specializing in an AI-powered platform that integrates video, sensor, and data management for surveillance purposes. Its solutions are designed to enhance public safety and operational efficiency by offering predictive event analysis and delivering actionable intelligence to public sector and commercial clients.
This Global AI and Emerging Market Report covers the Company Overview & Price performance, Summary table, Key positives & negatives, Key metrics, Company details, technical guidance & Stock recommendation, and Price chart.
1.2 Summary Table
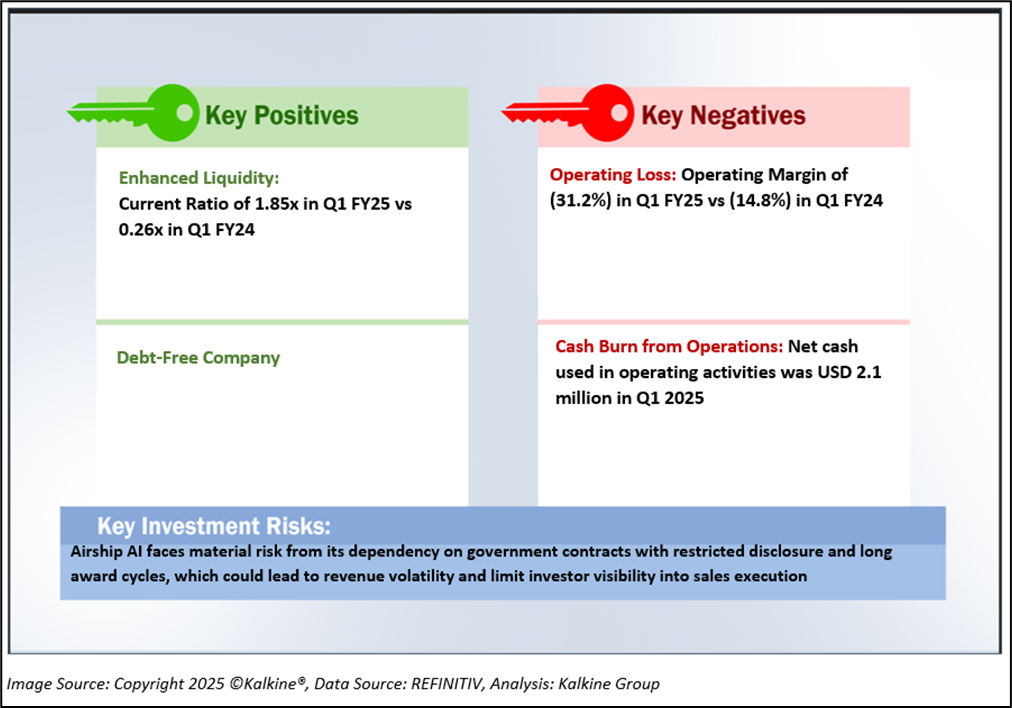
1.3 The Key Positives & Negatives
1.4 Key metrics
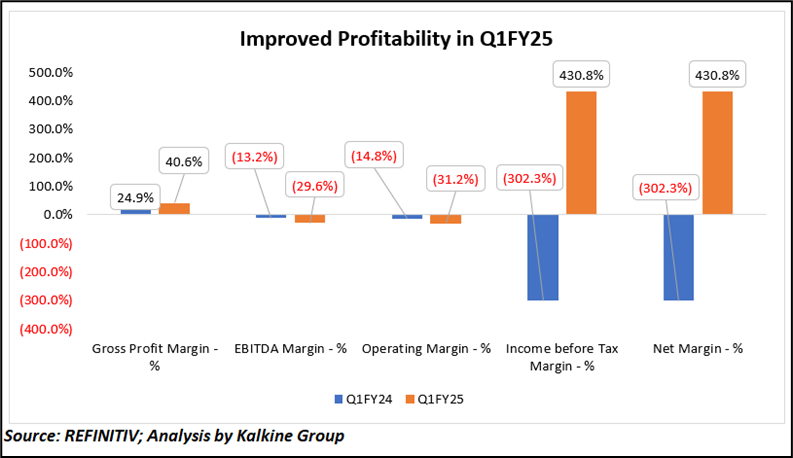
The chart illustrates a significant turnaround in financial performance in Q1 FY25 compared to Q1FY24. Gross Profit Margin increased from 24.9% to 40.6%, reflecting increased solution sales with more third-party hardware than Airship AI software. Despite negative EBITDA and Operating Margins in both periods, Q1FY25 showed improvements from -29.6% to -13.2% and -31.2% to -14.8% respectively. Notably, Income Before Tax Margin and Net Margin swung dramatically from -302.3% to a positive 430.8%, attributed to non-cash gain of USD 25.4 million resulting from changes in the fair value of earnout and warrant liabilities, which more than offset the operating loss incurred during the quarter. Overall, the company demonstrated a strong rebound in profitability metrics.
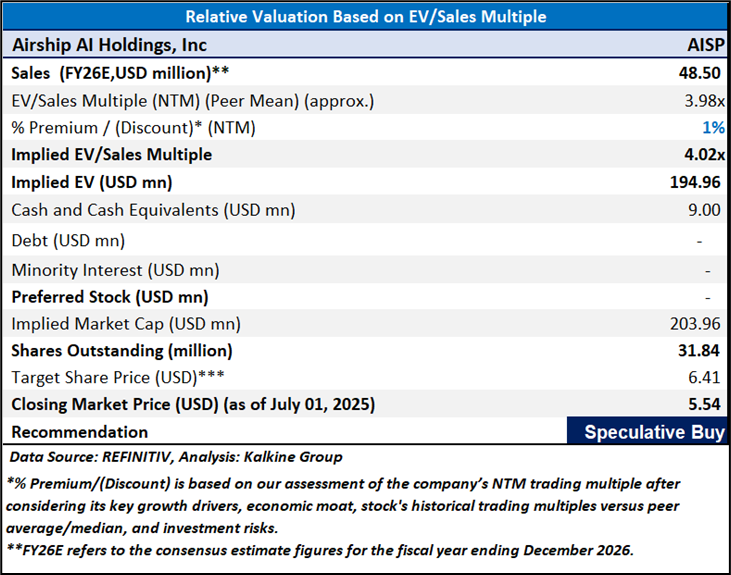
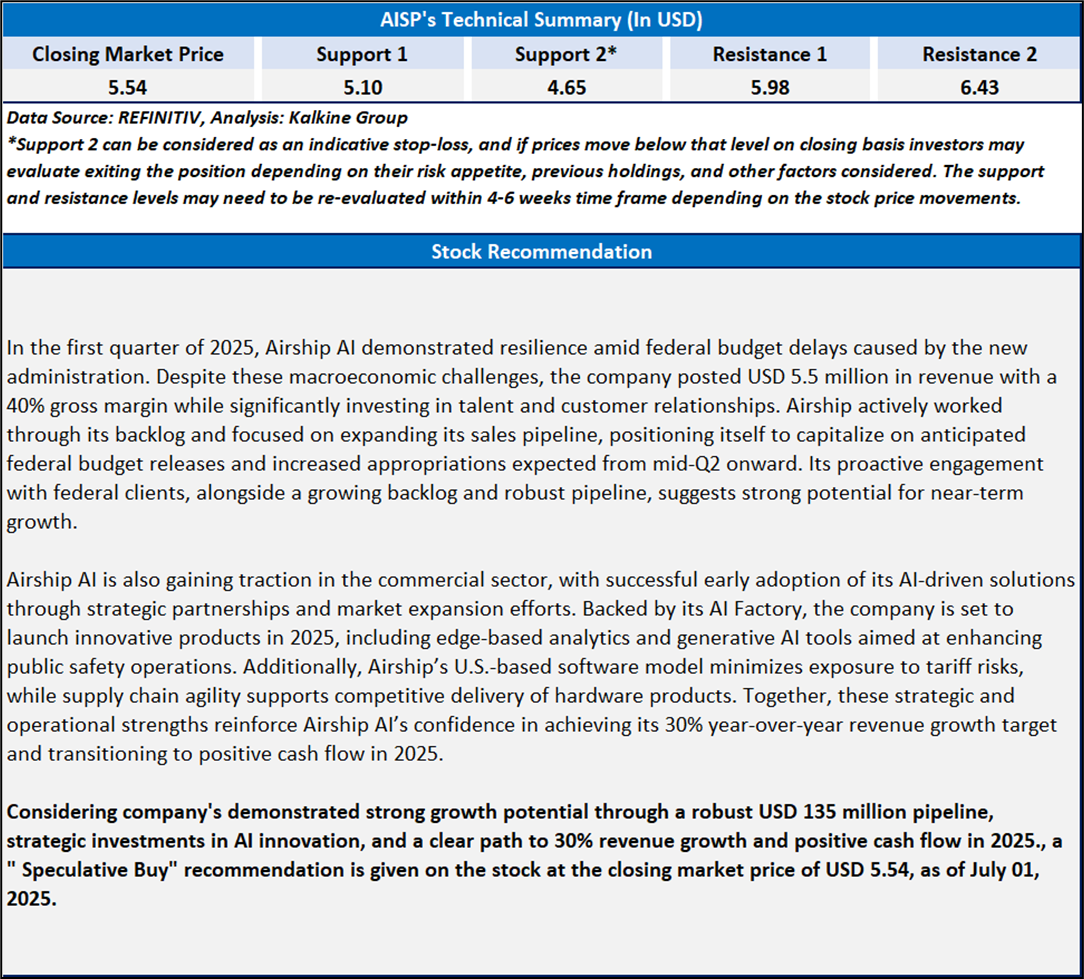
Section 2: Airship AI Holdings, Inc (NASDAQ: AISP) (“Speculative Buy” at the closing market price of USD 5.54, as of July 01, 2025
2.1 Company Details

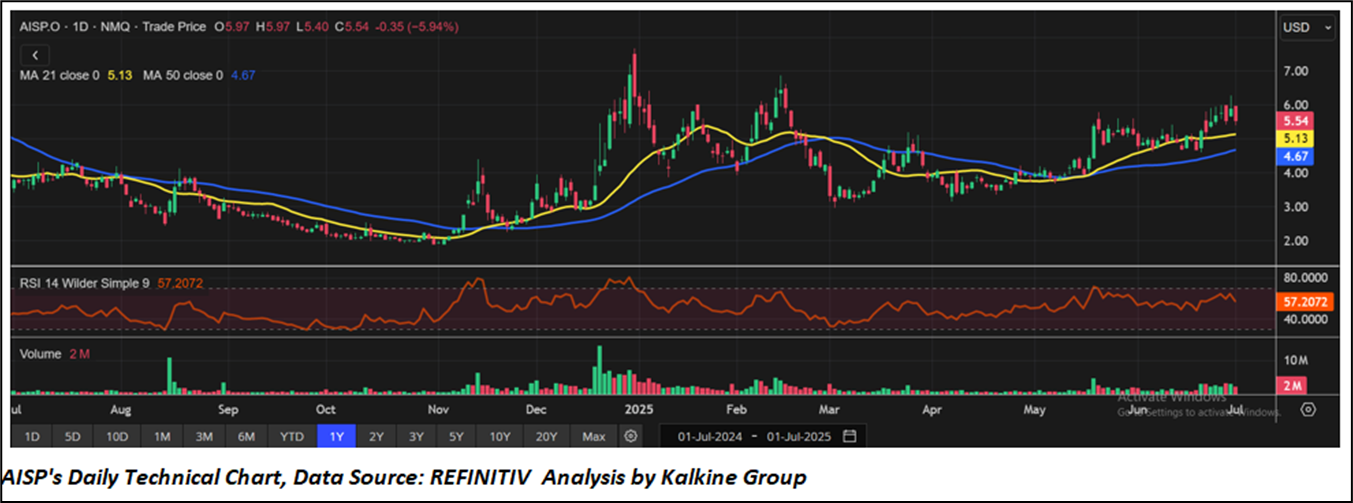
2.2 Technical Guidance and Stock Recommendation
Markets are trading in a highly volatile zone currently due to certain macroeconomic issues and geopolitical tensions prevailing. Therefore, it is prudent to follow a cautious approach while investing.
Note 1: Past performance is not a reliable indicator of future performance.
Note 2: The reference date for all price data, currency, technical indicators, support, and resistance levels is July 01, 2025. The reference data in this report has been partly sourced from REFINITIV.
Note 3: Investment decisions should be made depending on an individual's appetite for upside potential, risks, holding duration, and any previous holdings. An 'Exit' from the stock can be considered if the Target Price mentioned as per the Valuation and or the technical levels provided has been achieved and is subject to the factors discussed above.
Note 4: The report publishing date is as per the Pacific Time Zone.
Technical Indicators Defined: -
Support: A level at which the stock prices tend to find support if they are falling, and a downtrend may take a pause backed by demand or buying interest. Support 1 refers to the nearby support level for the stock and if the price breaches the level, then Support 2 may act as the crucial support level for the stock.
Resistance: A level at which the stocks prices tend to find resistance when they are rising, and an uptrend may take a pause due to profit booking or selling interest. Resistance 1 refers to the nearby resistance level for the stock and if the price surpasses the level, then Resistance 2 may act as the crucial resistance level for the stock.
Stop-loss: It is a level to protect against further losses in case of unfavorable movement in the stock prices.
Disclaimer This report has been issued by Kalkine New Zealand Limited (FSP691351) (NZBN:9429047678101) (“Kalkine”). Kalkine is a Financial Advice Provider (“FAP”) and is authorised by a Class 1 Financial Advice Provider Licence issued by Financial Markets Authority (“FMA”) to provide financial advice. Kalkine provides only general financial advice through its research reports following a person becoming a member. The reports contain buy/sell/hold and other recommendations in relation to equity securities, managed funds and other managed investment schemes and other financial advice products. The recommendations and opinions in this report and on Kalkine website do not take into account any of your investment objectives, financial situation or needs. Before you make a decision about whether to acquire a financial product, you should obtain the Product Disclosure Statement from the product issuer. You should consider the appropriateness of advice taking into account your own objectives, financial situation and needs and seek independent financial advice before making any financial decisions. If you act on the advice in the research reports, you may have to pay fees, expenses or other amounts (but not to Kalkine). Further information about the complaints and dispute resolution process, as well as information about Kalkine’s duties are available on Kalkine’s website. Please read our Financial Advice Provider (FAP) disclosure statement and Complaints Handling Guide, which are available on the website.
Past performance is not a reliable indicator of future performance.
 Please wait processing your request...