Section 1: Company Fundamentals
1.1 Company Overview and Performance summary
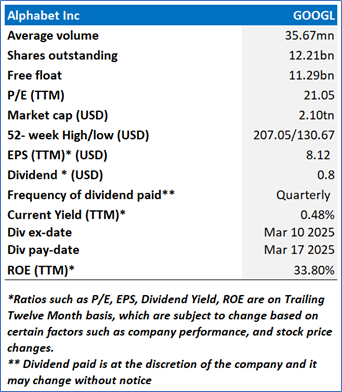
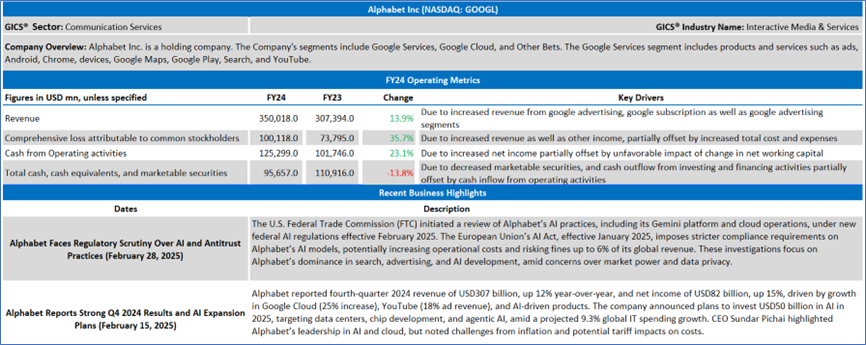
Company Overview:
Alphabet Inc. (NASDAQ: GOOGL) is a holding company. The Company's segments include Google Services, Google Cloud, and Other Bets. The Google Services segment includes products and services such as ads, Android, Chrome, devices, Google Maps, Google Play, Search, and YouTube.
This Global AI and Emerging Market Report covers the Company Overview & Price performance, Summary table, Key positives & negatives, Key metrics, Company details, technical guidance & Stock recommendation, and Price chart.
Price Performance:
1.2 Summary Table
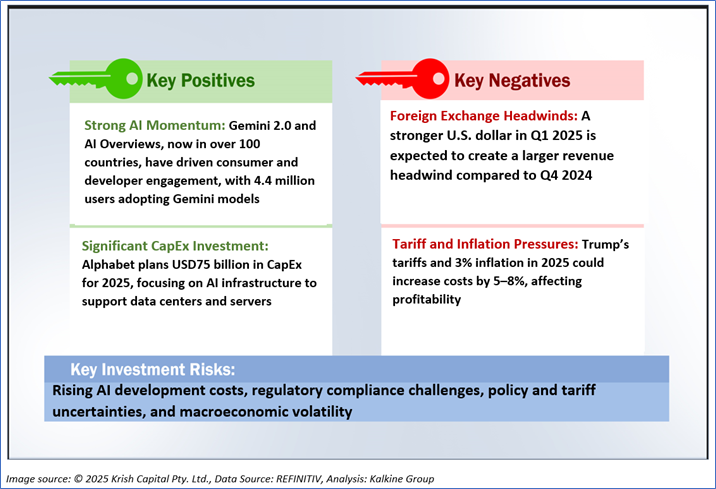
1.3 The Key Positives & Negatives
1.4 Key metrics
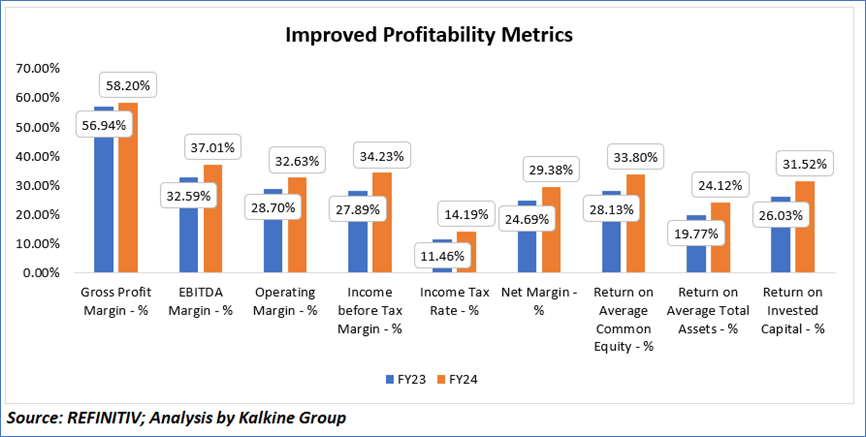
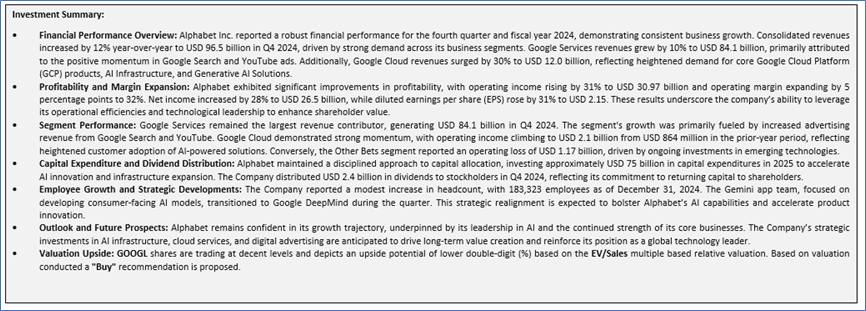
In fiscal year 2024, Google's financial performance exhibited notable improvement across key profitability and efficiency metrics compared to fiscal year 2023. The gross profit margin increased to 58.20% from 56.94%, reflecting improved cost management and pricing strategies. EBITDA margin rose significantly to 37.01%, up from 32.59%, indicating enhanced operational efficiency. Operating margin expanded to 32.63%, while income before tax margin climbed to 34.23%, showcasing strong profitability growth. However, the income tax rate increased to 14.19%, up from 11.46%, slightly impacting the bottom line. Despite this, the net margin improved to 29.38%, highlighting the company's ability to convert revenue into profit effectively. Furthermore, Google's return on average common equity surged to 33.80%, while return on average total assets and return on invested capital improved to 24.12% and 31.52%, respectively, underscoring robust capital efficiency and overall financial strength.
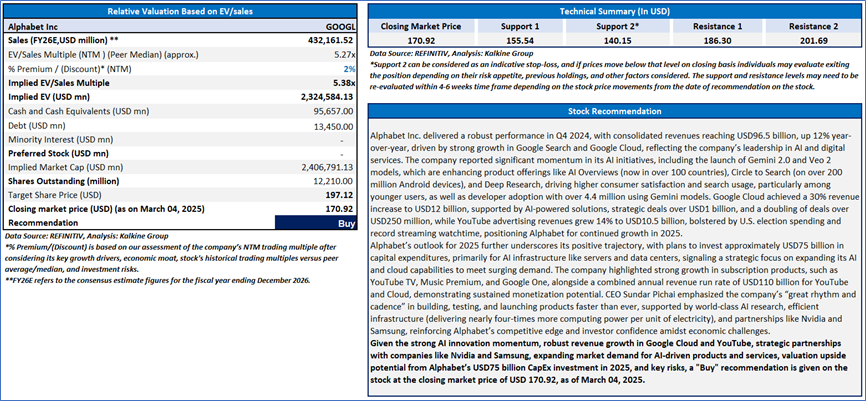
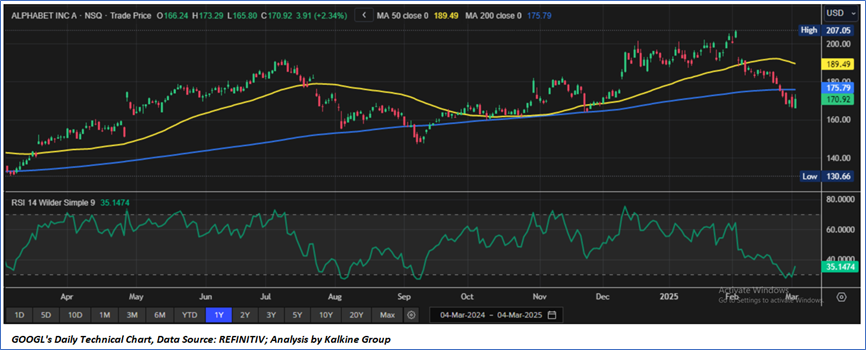
Section 2: Alphabet Inc (NASDAQ: GOOGL) (“Buy” at the closing market price of USD 170.92, as of March 04, 2025)
2.1 Company Details
2.2 Technical Guidance and Stock Recommendation
Dell Technologies Inc
Section 1: Company Fundamentals
1.1 Company Overview and Performance summary
Company Overview:
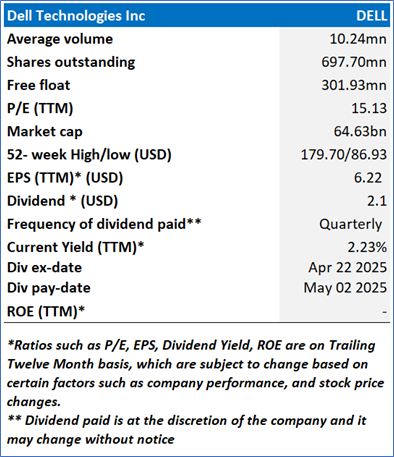
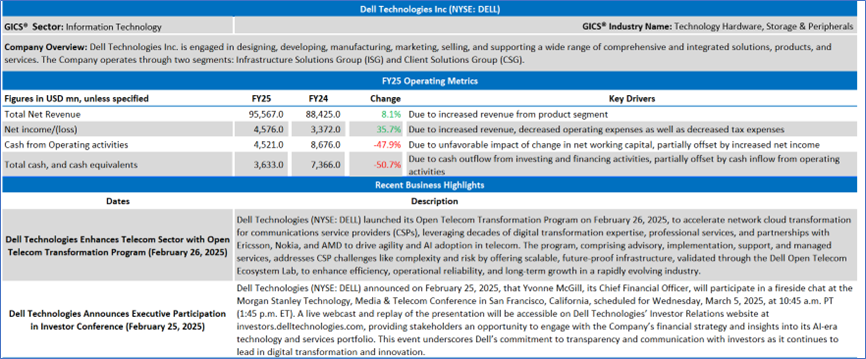
Dell Technologies Inc. (NYSE: DELL) is engaged in designing, developing, manufacturing, marketing, selling, and supporting a wide range of comprehensive and integrated solutions, products, and services. The Company operates through two segments: Infrastructure Solutions Group (ISG) and Client Solutions Group (CSG).
This Global AI and Emerging Market Report covers the Company Overview & Price performance, Summary table, Key positives & negatives, Key metrics, Company details, technical guidance & Stock recommendation, and Price chart.
Price Performance:
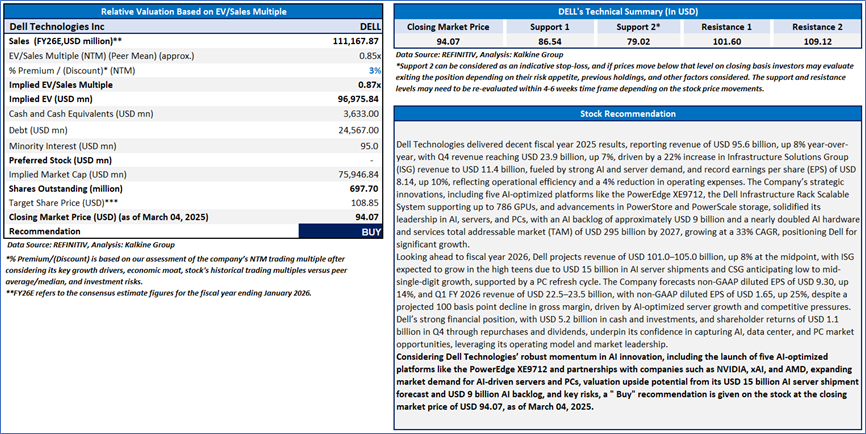
1.2 Summary Table
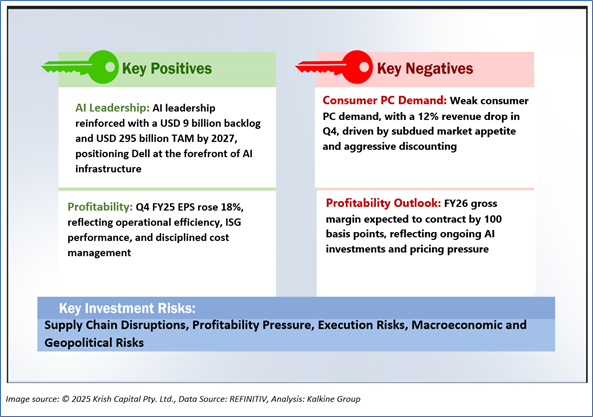
1.3 The Key Positives & Negatives
Section 2: Dell Technologies Inc (NYSE: DELL) (“Buy” at the closing market price of USD 94.07, March 04, 2025)
2.1 Company Details
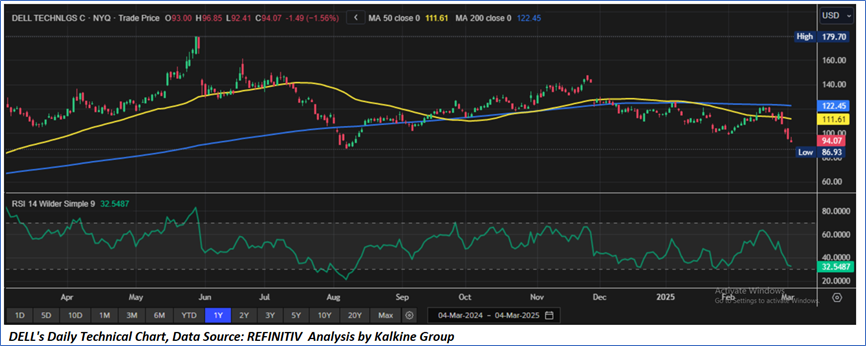
2.2 Technical Guidance and Stock Recommendation
Markets are trading in a highly volatile zone currently due to certain macroeconomic issues and geopolitical tensions prevailing. Therefore, it is prudent to follow a cautious approach while investing.
Note 1: Past performance is not a reliable indicator of future performance.
Note 2: The reference date for all price data, currency, technical indicators, support, and resistance levels is March 04, 2025. The reference data in this report has been partly sourced from REFINITIV.
Note 3: Investment decisions should be made depending on an individual's appetite for upside potential, risks, holding duration, and any previous holdings. An 'Exit' from the stock can be considered if the Target Price mentioned as per the Valuation and or the technical levels provided has been achieved and is subject to the factors discussed above.
Note 4: The report publishing date is as per the Pacific Time Zone.
Technical Indicators Defined: -
Support: A level at which the stock prices tend to find support if they are falling, and a downtrend may take a pause backed by demand or buying interest. Support 1 refers to the nearby support level for the stock and if the price breaches the level, then Support 2 may act as the crucial support level for the stock.
Resistance: A level at which the stocks prices tend to find resistance when they are rising, and an uptrend may take a pause due to profit booking or selling interest. Resistance 1 refers to the nearby resistance level for the stock and if the price surpasses the level, then Resistance 2 may act as the crucial resistance level for the stock.
Stop-loss: It is a level to protect against further losses in case of unfavorable movement in the stock prices.
Disclaimer This report has been issued by Kalkine New Zealand Limited (FSP691351) (NZBN:9429047678101) (“Kalkine”). Kalkine is a Financial Advice Provider (“FAP”) and is authorised by a Class 1 Financial Advice Provider Licence issued by Financial Markets Authority (“FMA”) to provide financial advice. Kalkine provides only general financial advice through its research reports following a person becoming a member. The reports contain buy/sell/hold and other recommendations in relation to equity securities, managed funds and other managed investment schemes and other financial advice products. The recommendations and opinions in this report and on Kalkine website do not take into account any of your investment objectives, financial situation or needs. Before you make a decision about whether to acquire a financial product, you should obtain the Product Disclosure Statement from the product issuer. You should consider the appropriateness of advice taking into account your own objectives, financial situation and needs and seek independent financial advice before making any financial decisions. If you act on the advice in the research reports, you may have to pay fees, expenses or other amounts (but not to Kalkine). Further information about the complaints and dispute resolution process, as well as information about Kalkine’s duties are available on Kalkine’s website. Please read our Financial Advice Provider (FAP) disclosure statement and Complaints Handling Guide, which are available on the website.
Past performance is not a reliable indicator of future performance.
 Please wait processing your request...