Section 1: Company Fundamentals
1.1 Company Overview and Performance summary
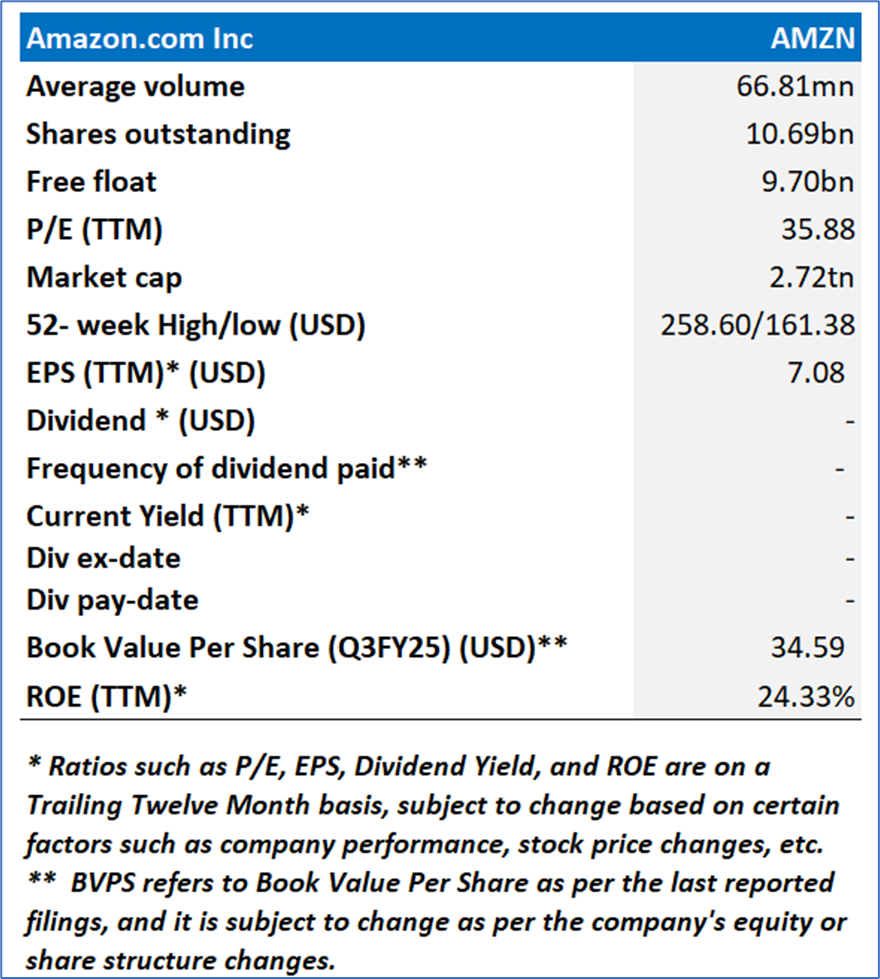
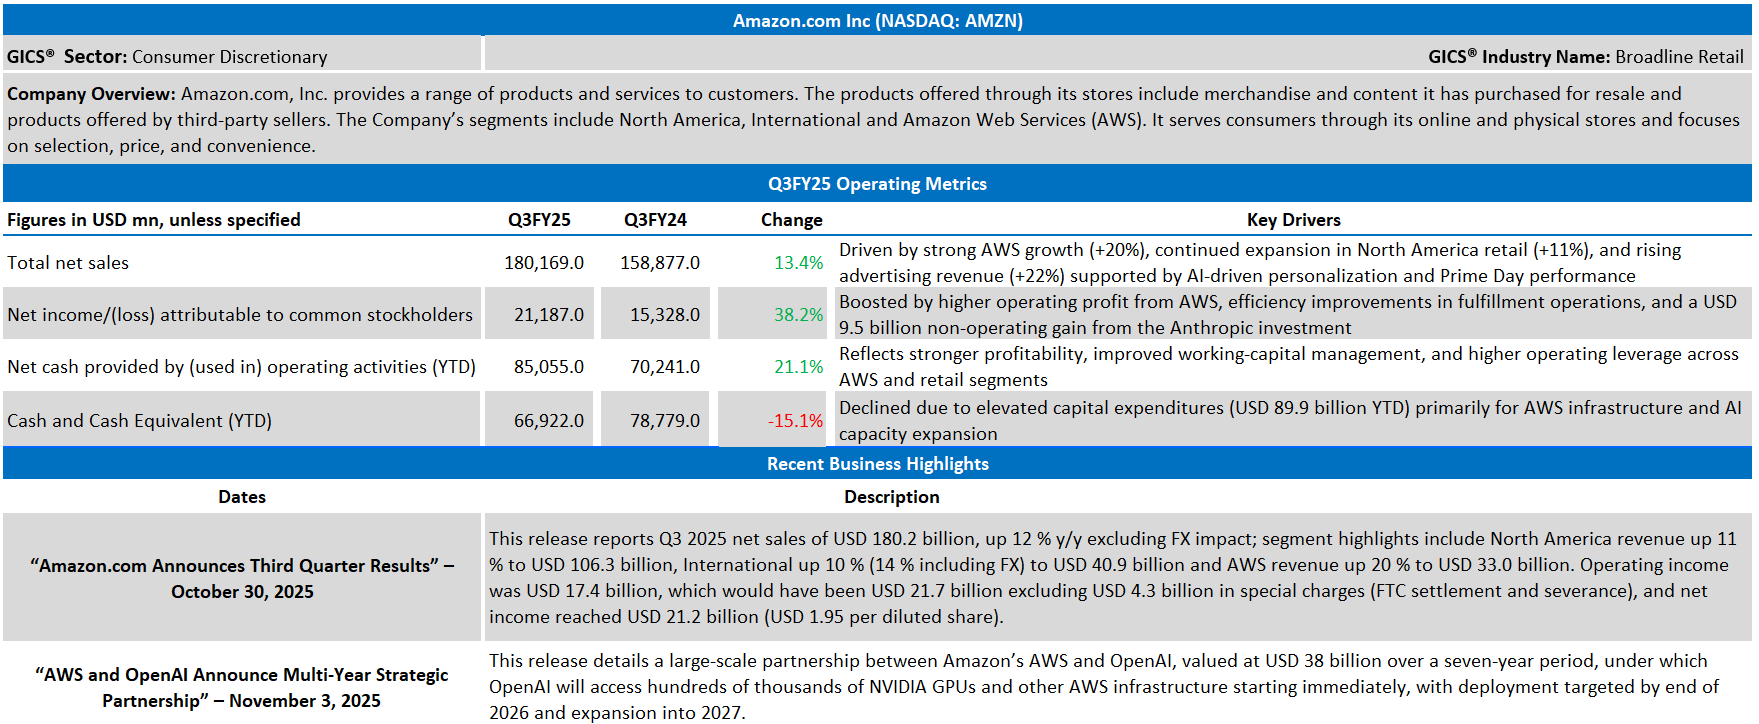
Company Overview:
Amazon.com, Inc. (NASDAQ: AMZN) provides a range of products and services to customers. The products offered through its stores include merchandise and content it has purchased for resale and products offered by third-party sellers. The Company’s segments include North America, International and Amazon Web Services (AWS). It serves consumers through its online and physical stores and focuses on selection, price, and convenience.
This Global AI and Emerging Market Report covers the Company Overview & Price performance, Summary table, Key positives & negatives, Key metrics, Company details, technical guidance & Stock recommendation, and Price chart.
1.2 Summary Table
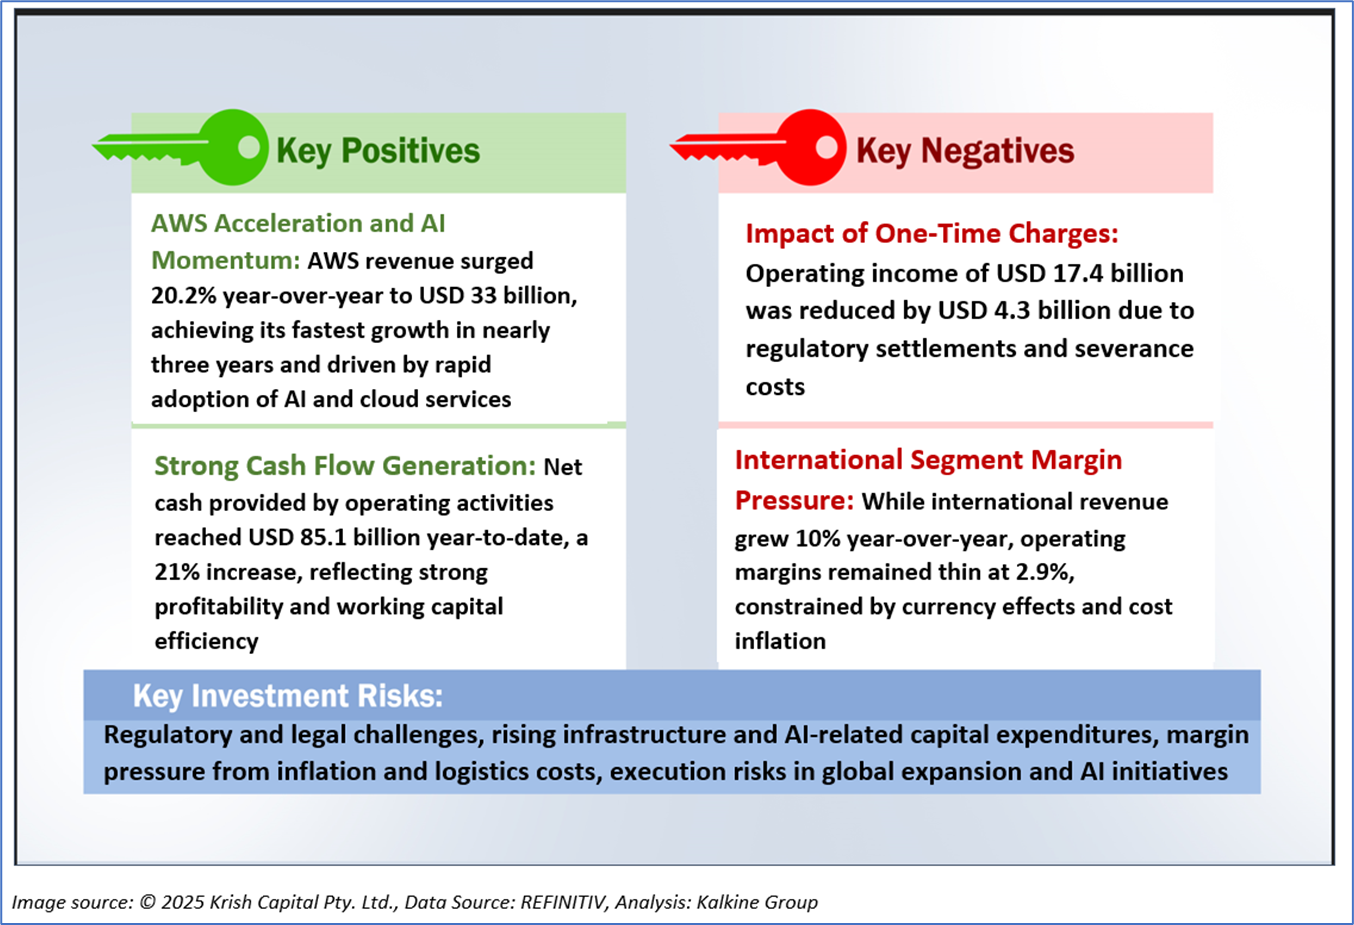
1.3 The Key Positives & Negatives
1.4 Key metrics
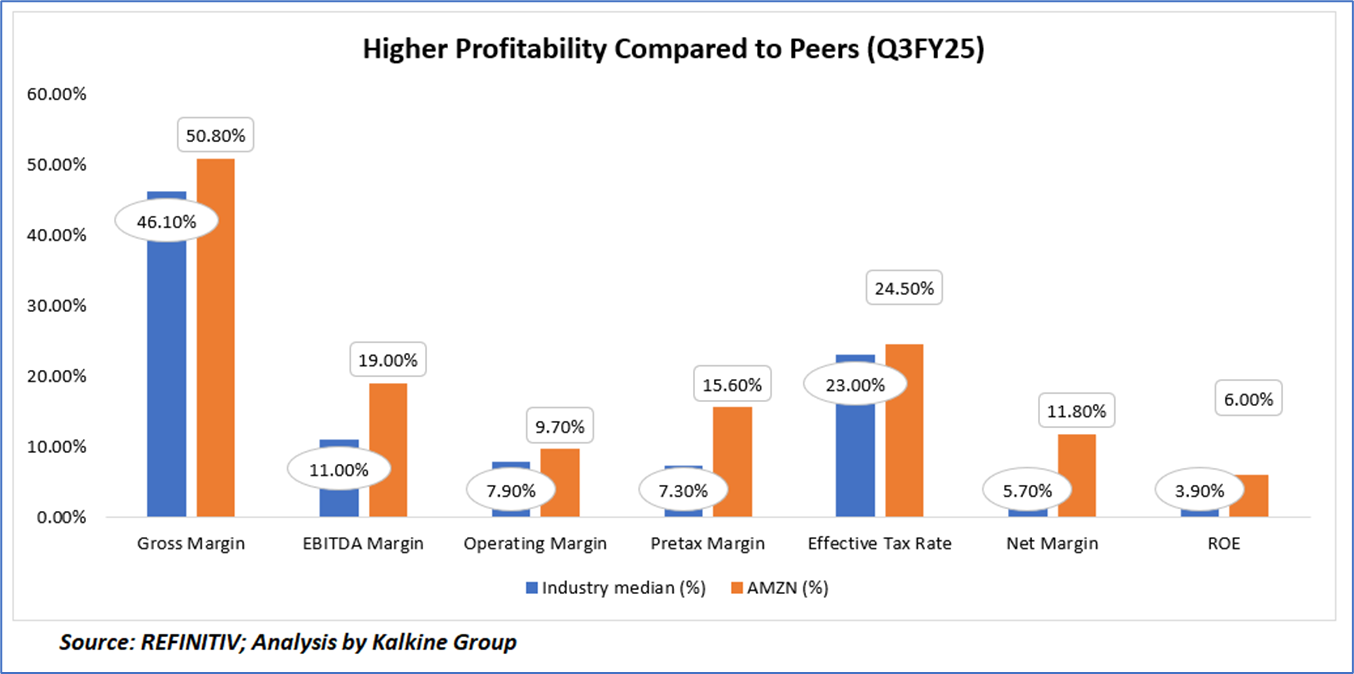
Amazon Inc. (AMZN) demonstrates a strong profitability profile, outperforming the industry median across all key margin indicators, reflecting its operational efficiency and diversified revenue model. The company’s gross margin of 50.8%, notably above the industry’s 46.1%, underscores superior cost management and pricing power driven by AWS and advertising segments. Similarly, EBITDA and operating margins at 19.0% and 9.7%, respectively, highlight Amazon’s scalable infrastructure and improved cost discipline. The pretax and net margins of 15.6% and 11.8% significantly exceed peers, indicating robust earnings quality despite a slightly higher effective tax rate of 24.5%. Furthermore, a return on equity of 6.0%, higher than the sector median of 3.9%, reinforces Amazon’s ability to generate solid shareholder value through sustained profitability and efficient capital deployment.
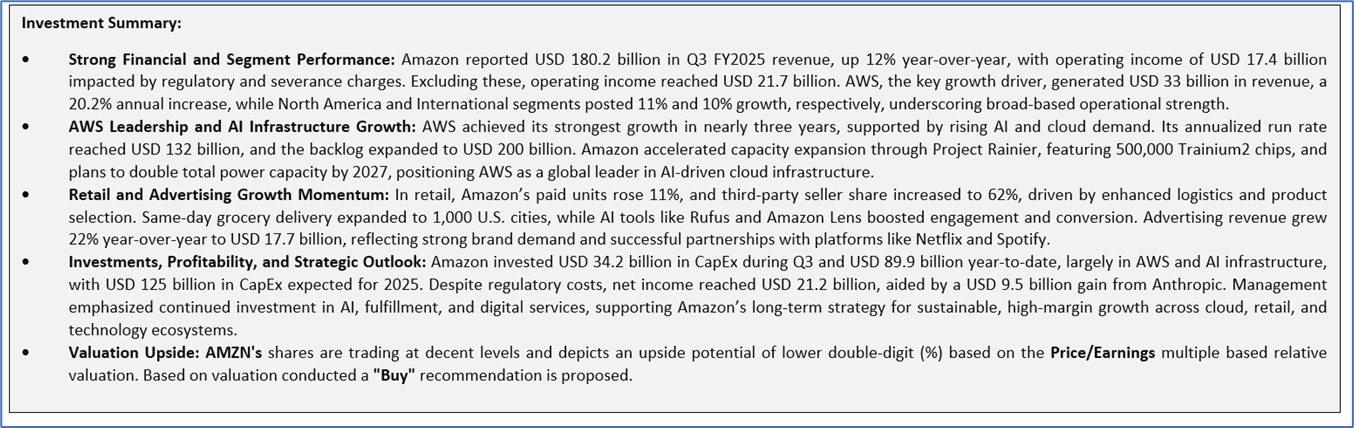
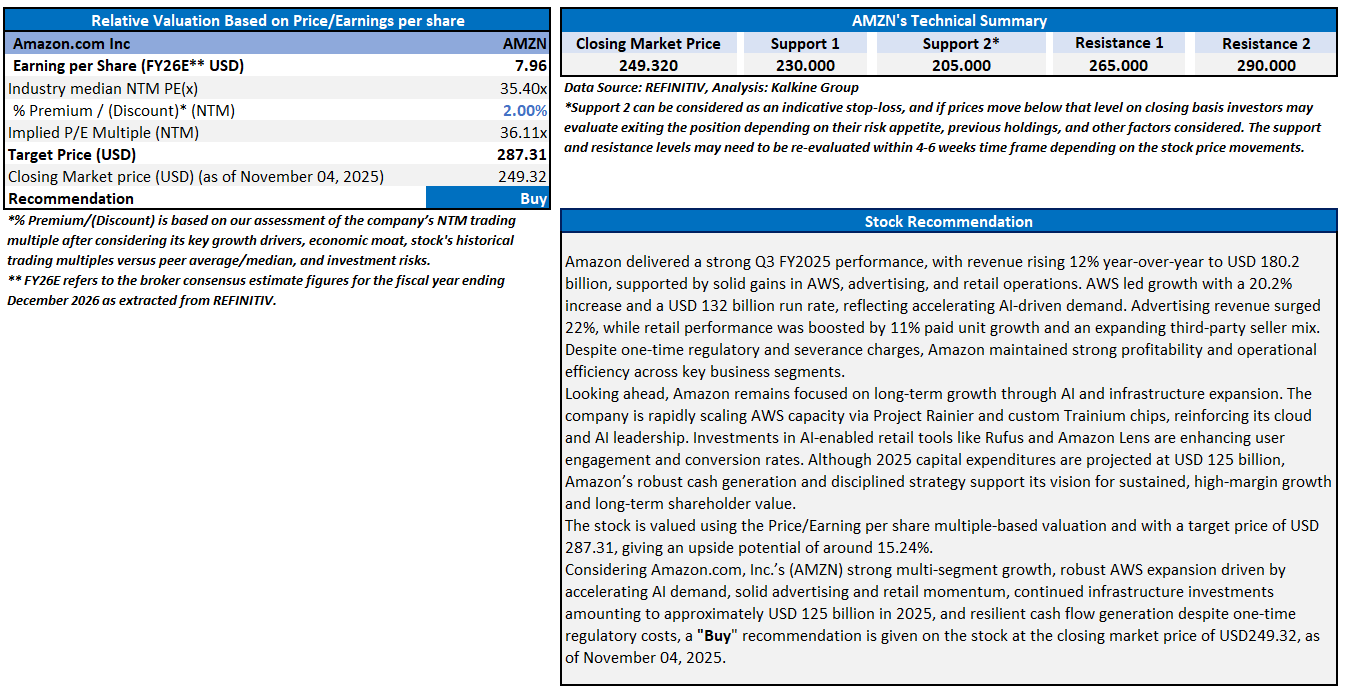
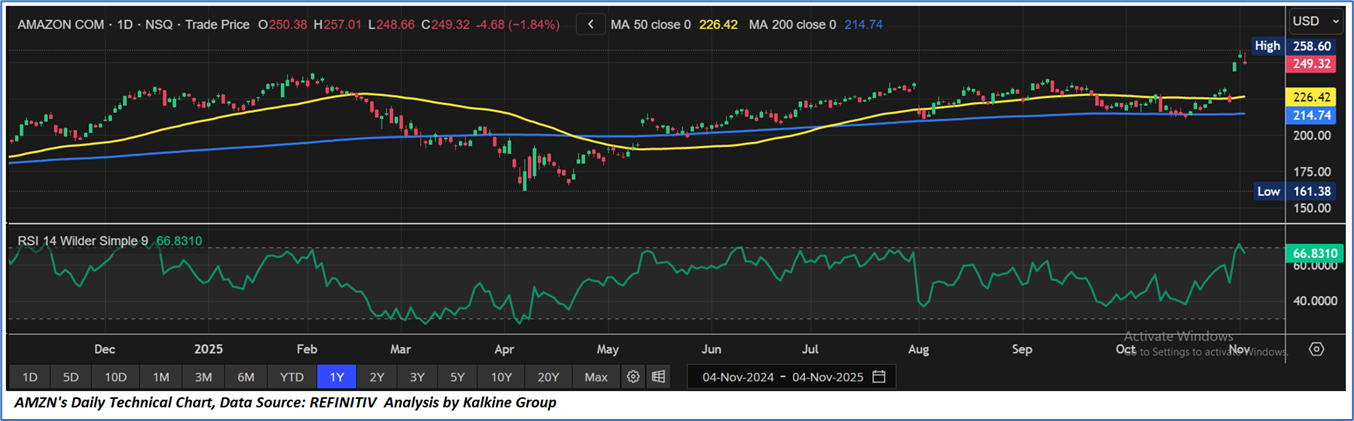
Section 2: Amazon.com, Inc. (NASDAQ: AMZN) (“Buy” at the closing market price of USD 249.32, as of November 04, 2025)
2.1 Company Details
2.2 Technical Guidance and Stock Recommendation
Soluna Holdings, Inc. (NASDAQ: SLNH)
Section 1: Company Fundamentals
1.1 Company Overview and Performance summary
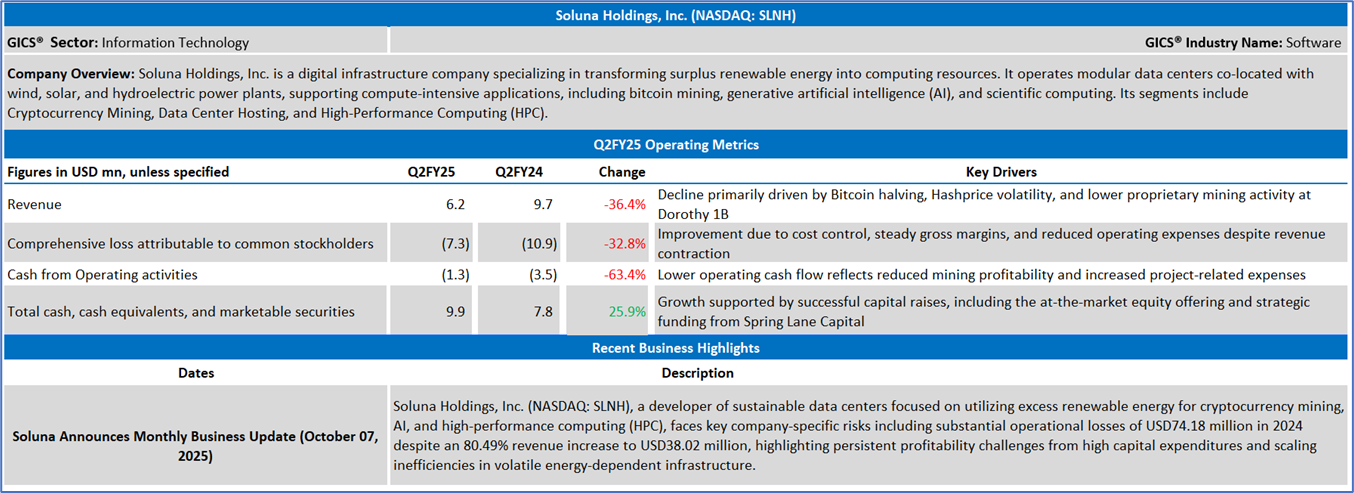
Company Overview:
Soluna Holdings, Inc. (NASDAQ: SLNH) is a digital infrastructure company specializing in transforming surplus renewable energy into computing resources. It operates modular data centers co-located with wind, solar, and hydroelectric power plants, supporting compute-intensive applications, including bitcoin mining, generative artificial intelligence (AI), and scientific computing. Its segments include Cryptocurrency Mining, Data Center Hosting, and High-Performance Computing (HPC).
This Global AI and Emerging Market Report covers the Company Overview & Price performance, Summary table, Key positives & negatives, Key metrics, Company details, technical guidance & Stock recommendation, and Price chart.
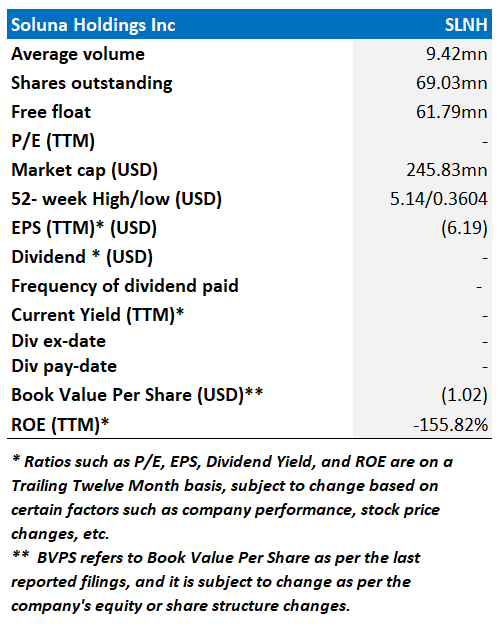
1.2 Summary Table
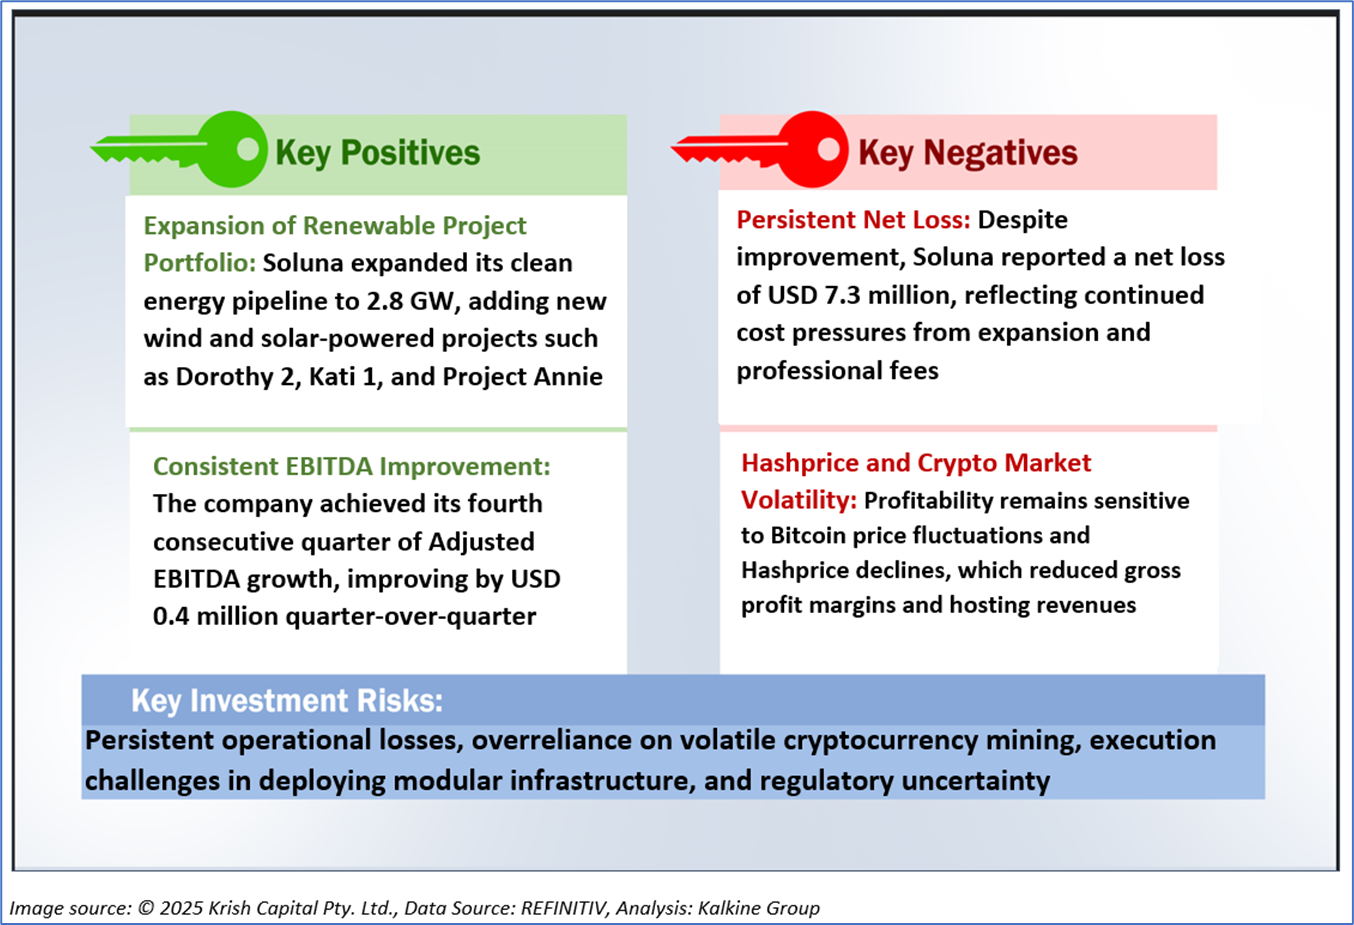
1.3 The Key Positives & Negatives
1.4 Key metrics
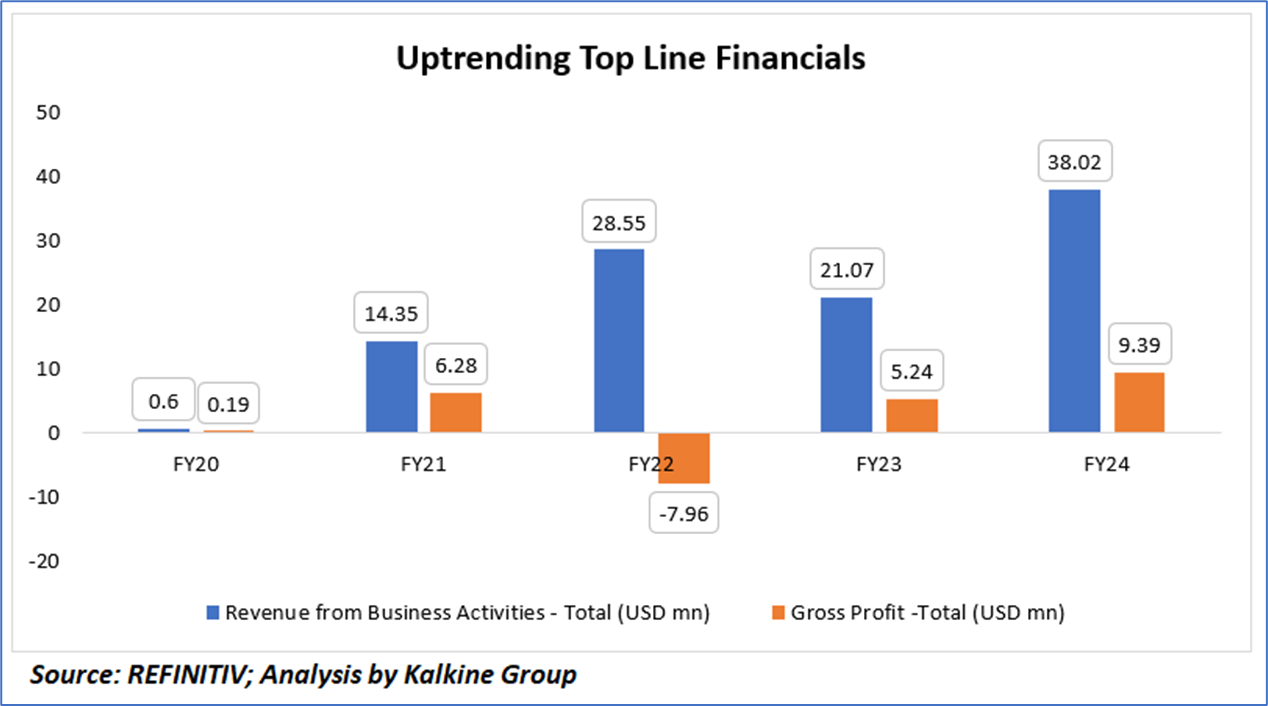
Soluna Holdings, Inc. (SLNH) has demonstrated significant revenue growth momentum, with total revenue rising from USD 0.6 million in FY20 to USD 38.02 million in FY24, reflecting successful scaling of its renewable-powered data center operations. Despite a temporary dip in FY23 linked to market headwinds and Bitcoin price volatility, revenue rebounded strongly in FY24, indicating improved operational capacity and project expansion. Gross profit trends reveal a similar recovery trajectory — after a sharp contraction in FY22 due to elevated costs and crypto-market fluctuations, margins turned positive again, reaching USD 9.39 million in FY24, supported by efficiency gains and consistent site-level performance. Overall, the data underscores SLNH’s transition from an early-stage operator to a more financially stable and scalable renewable computing enterprise with improving profitability potential.
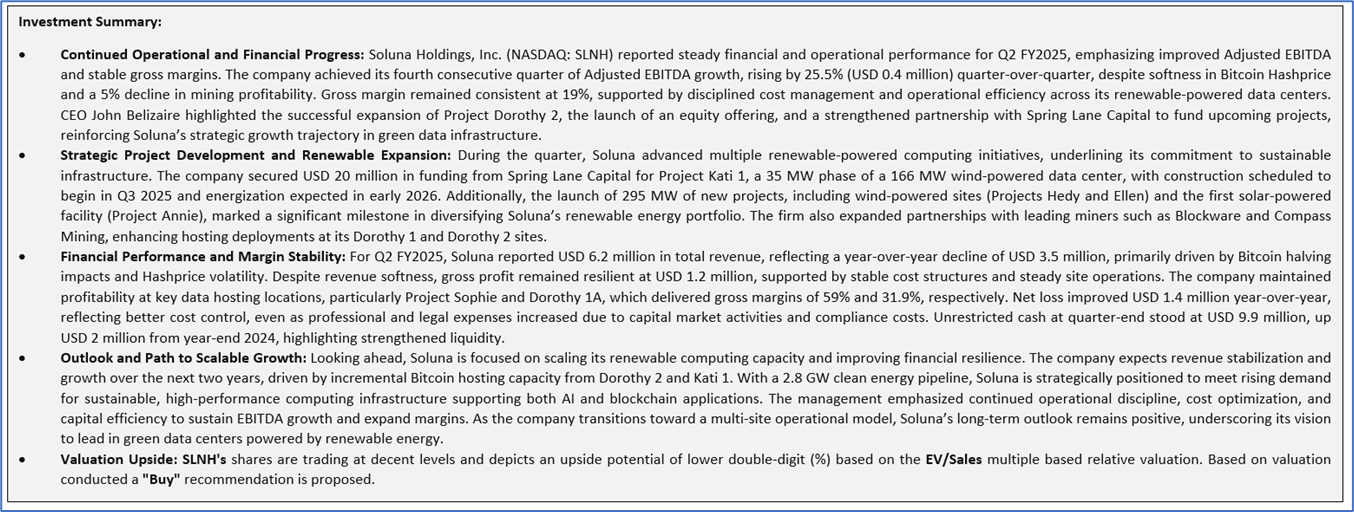
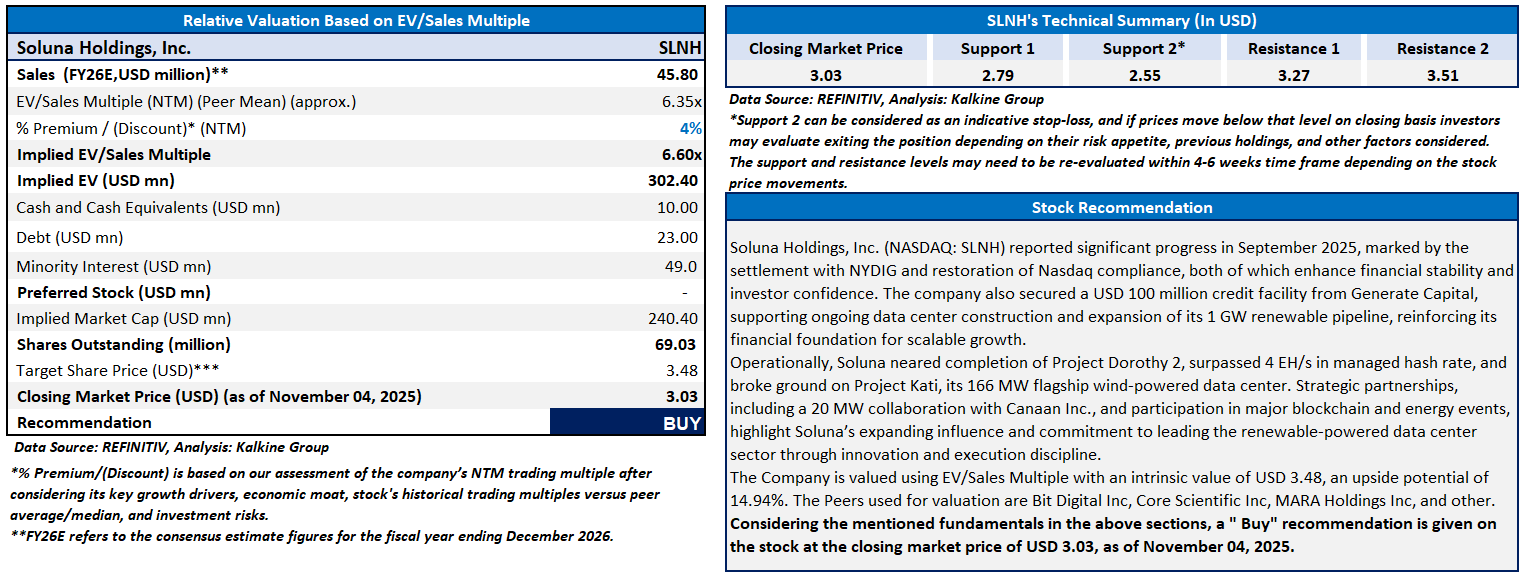
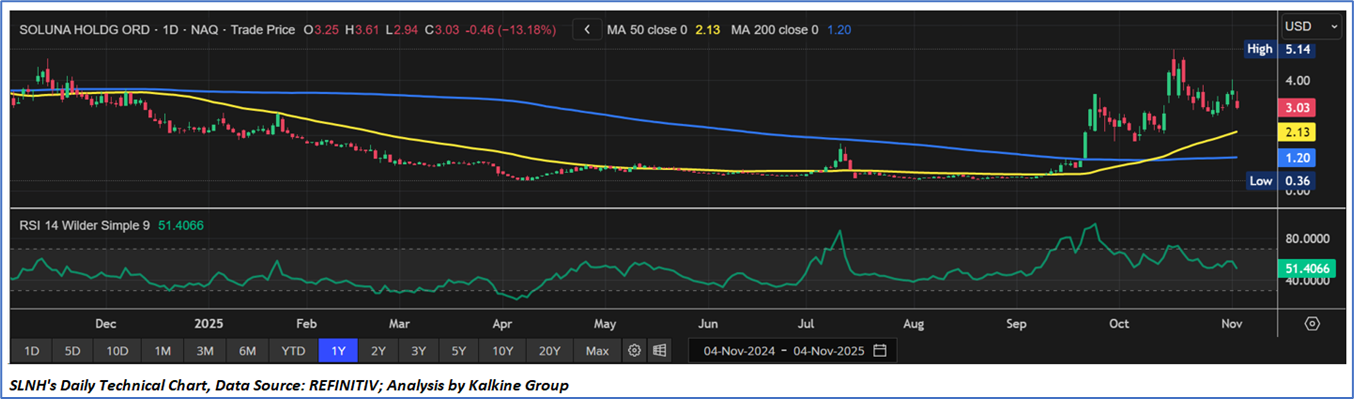
Section 2: Soluna Holdings, Inc. (NASDAQ: SLNH) (“Buy” at the closing market price of USD 3.03, as of November 04, 2025)
2.1 Company Details
2.2 Technical Guidance and Stock Recommendation
Markets are trading in a highly volatile zone currently due to certain macroeconomic issues and geopolitical tensions prevailing. Therefore, it is prudent to follow a cautious approach while investing.
Note 1: Past performance is not a reliable indicator of future performance.
Note 2: The reference date for all price data, currency, technical indicators, support, and resistance levels is November 04, 2025. The reference data in this report has been partly sourced from REFINITIV.
Note 3: Investment decisions should be made depending on an individual's appetite for upside potential, risks, holding duration, and any previous holdings. An 'Exit' from the stock can be considered if the Target Price mentioned as per the Valuation and or the technical levels provided has been achieved and is subject to the factors discussed above.
Note 4: The report publishing date is as per the Pacific Time Zone.
Technical Indicators Defined: -
Support: A level at which the stock prices tend to find support if they are falling, and a downtrend may take a pause backed by demand or buying interest. Support 1 refers to the nearby support level for the stock and if the price breaches the level, then Support 2 may act as the crucial support level for the stock.
Resistance: A level at which the stocks prices tend to find resistance when they are rising, and an uptrend may take a pause due to profit booking or selling interest. Resistance 1 refers to the nearby resistance level for the stock and if the price surpasses the level, then Resistance 2 may act as the crucial resistance level for the stock.
Stop-loss: It is a level to protect against further losses in case of unfavorable movement in the stock prices.
This report (“Report”) has been issued by Kalkine New Zealand Limited (FSP691351) (NZBN:9429047678101) (“Kalkine”). Kalkine is a Financial Advice Provider (“FAP”) and is authorised by a Class 1 Financial Advice Provider Licence issued by Financial Markets Authority (“FMA”) to provide financial advice. Kalkine provides only general financial advice through its research reports following a person becoming a member. The reports contain buy/sell/hold and other recommendations in relation to equity securities, managed funds and other managed investment schemes and other financial advice products. The recommendations and opinions in this Report and on Kalkine website do not take into account any of your investment objectives, financial situation or needs. Before you make a decision about whether to acquire a financial product, you should obtain the Product Disclosure Statement from the product issuer. You should consider the appropriateness of advice taking into account your own objectives, financial situation and needs and seek independent financial advice before making any financial decisions. If you act on the advice in the research reports, you may have to pay fees, expenses or other amounts (but not to Kalkine).
The information in this Report and on the Kalkine website has been prepared from a wide variety of sources, which Kalkine, to the best of its knowledge and belief, considers accurate. Kalkine has made every effort to ensure the reliability of the information contained in its reports (including this Report), newsletters and websites. All information represents our views at the date of publication and may change without notice.
Kalkine does not issue, sell or deal in any financial products. The information in this Report does not constitute an offer to sell securities or other financial products or a solicitation of an offer to buy securities or other financial products. Our reports contain general recommendations to invest in securities and other financial products. Kalkine is not responsible for, and does not guarantee, the performance of, or returns on, any investments mentioned in this Report.
This Report may contain information on past performance of particular investments. Past performance is not a reliable indicator of future performance. Returns stated do not take into account transaction costs and taxes.
Further information about the complaints and dispute resolution process, as well as information about Kalkine’s duties are available on Kalkine’s website. Please read our Financial Advice Provider (FAP) disclosure statement and Complaints Handling Guide, which are available on the website.
Copyright 2025 Krish Capital Pty. Ltd. (ABN 61629651510). All Rights Reserved. No part of this Report, or its content, may be reproduced in any form without our prior consent.
Past performance is not a reliable indicator of future performance.
 Please wait processing your request...