
Celestica Inc.
Section 1: Company Overview
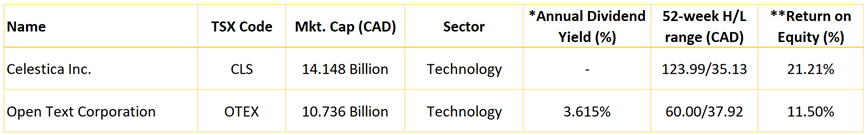
Celestica Inc. (TSX: CLS) offers supply chain solutions and operates in two segments: Advanced Technology Solutions (ATS) and Connectivity & Cloud Solutions (CCS). ATS segment consists of the ATS end market and is comprised of A&D, Industrial, Energy, HealthTech, and Capital Equipment businesses. Capital Equipment business is comprised of our semiconductor, display, and power & signal distribution equipment businesses. CCS segment that derives majority revenue consists of Communications and Enterprise end markets.
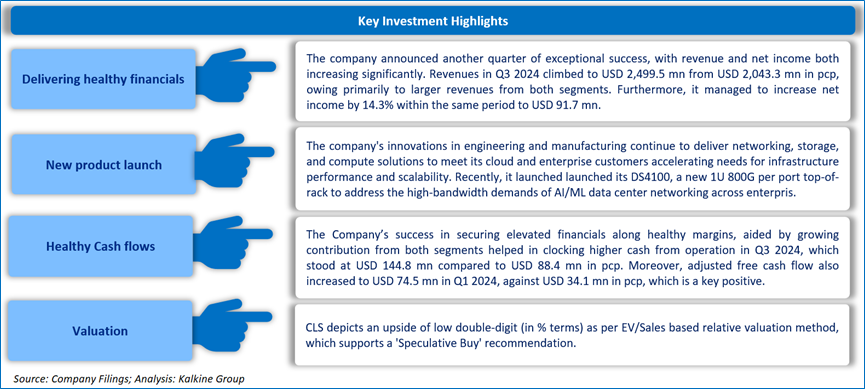
This Report covers the Investment Highlights, Key Financial Metrics, Risks, Technical Analysis along with the Valuation, Target Price, and Recommendation on the stock.
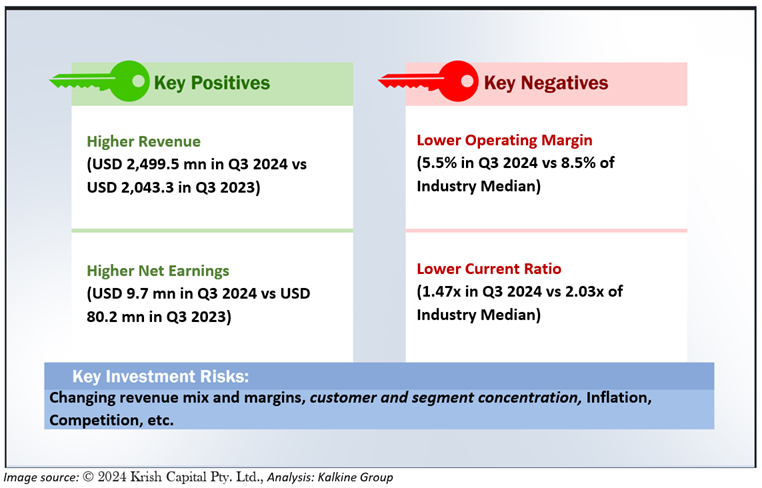
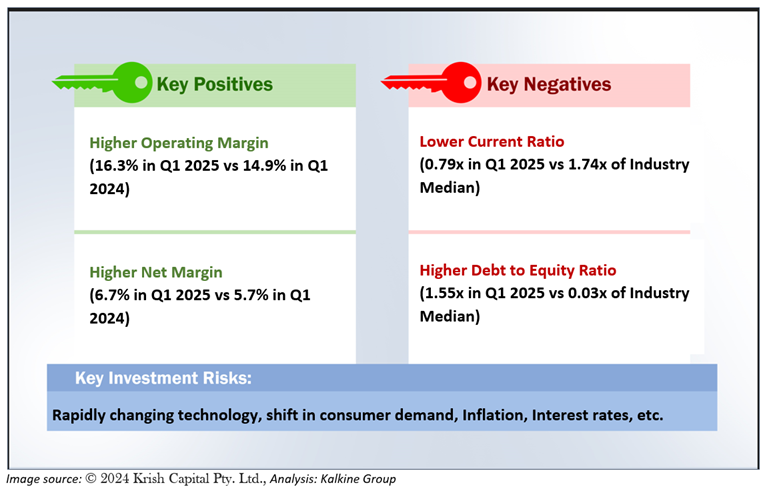
1.1 The Key Positives, Negatives, Investment Highlights, and Risks
Section2: Financial Highlights
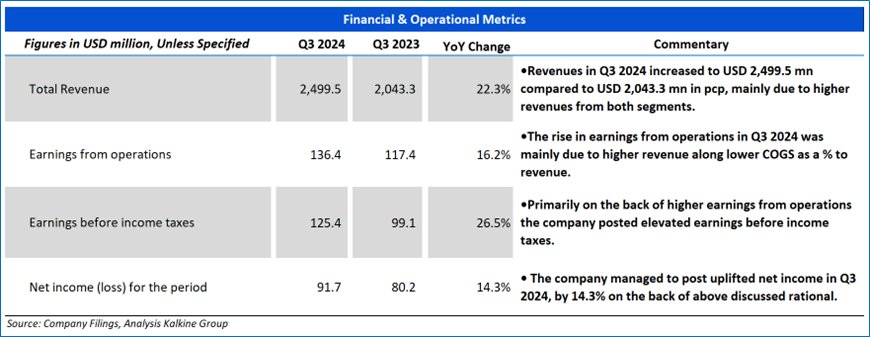
2.1 Key Financial Highlights
Section 3: Key Metrics
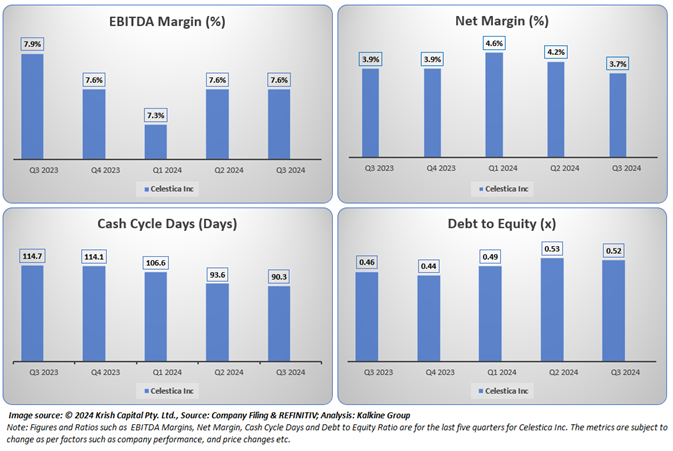
Below charts depict the change in EBITDA Margin, Net Margin, Cash Cycle Days and Debt to Equity ratio of the Company for the last five reported quarters.
Section 4: Stock Recommendation Summary
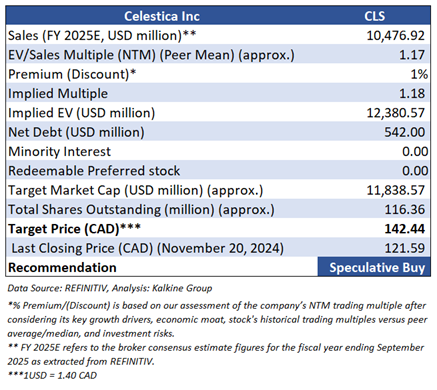
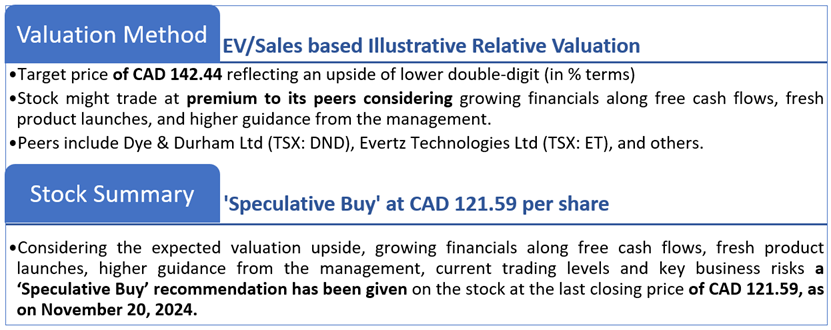
4.1 Valuation Methodology Illustrative EV to Sales Based
4.2 Price Performance and Stock Recommendation

The stock has witnessed an upside of ~5.74% in 1 week and ~55.14% over the last 1 month. Moreover, the stock is trading above the average 52-week high price of CAD 123.99 and 52-week low price of CAD 35.13 providing an opportunity to ride the trend.
4.3 One-Year Technical Price Chart
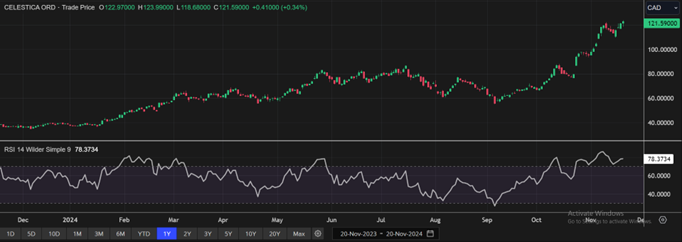
One-Year Technical Price Chart (as of November 20, 2024). Source: REFINITIV, Analysis: Kalkine Group
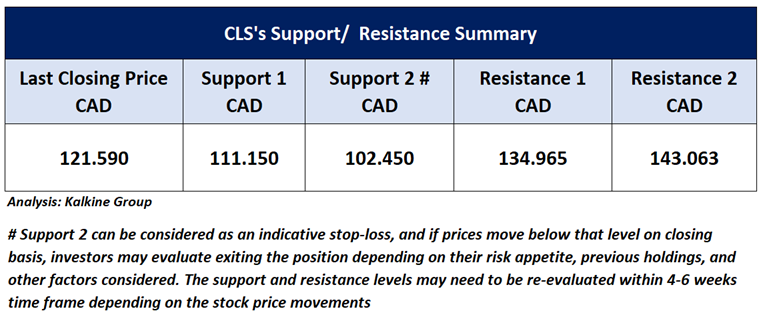
4.4 Technical Summary
Open Text Corporation
Section 1: Company Overview
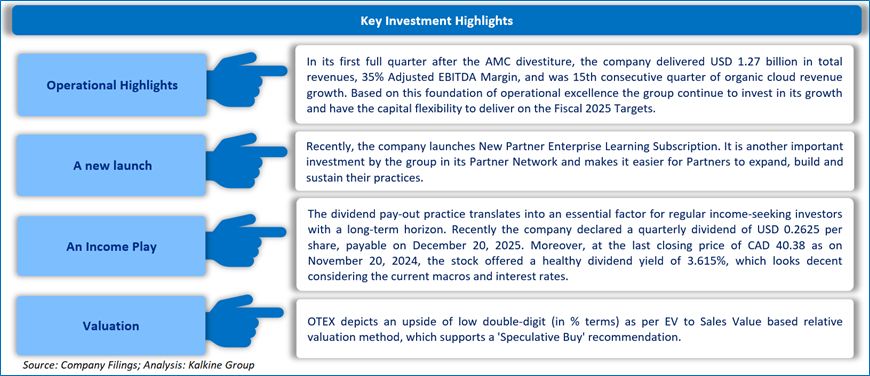
Open Text Corporation (TSX: OTEX) is the leading Information Management software and services company in the world. The group help organizations solve complex global problems with a comprehensive suite of Business Clouds, Business AI, and Business Technology.
This Report covers the Investment Highlights, Key Financial Metrics, Risks, Technical Analysis along with the Valuation, Target Price, and Recommendation on the stock.
1.1 The Key Positives, Negatives, Investment Highlights, and Risks
Section2: Financial Highlights
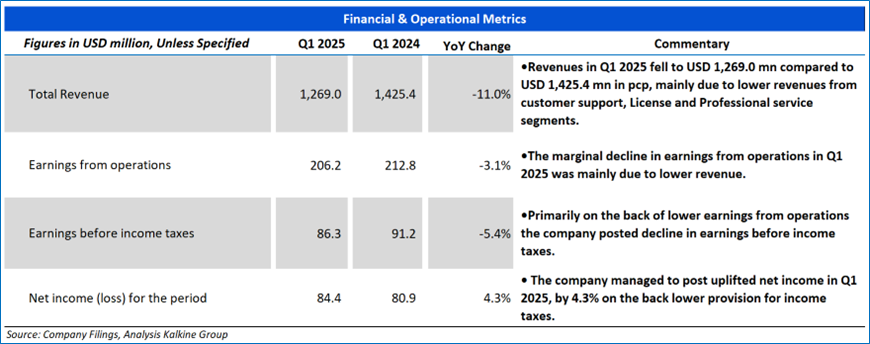
2.1 Key Financial Highlights
Section 3: Key Metrics
Below charts depict the change in Gross Margin, Net Margin, Cash Cycle Days and Debt to Equity Ratio of the Company for the last five reported quarters.

Section 4: Stock Recommendation Summary
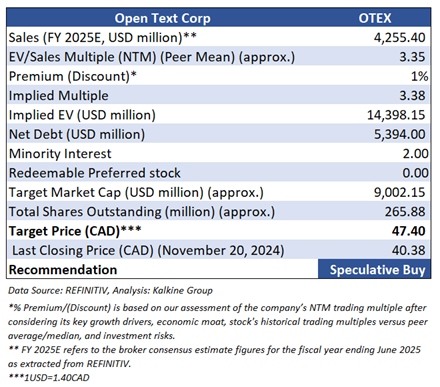
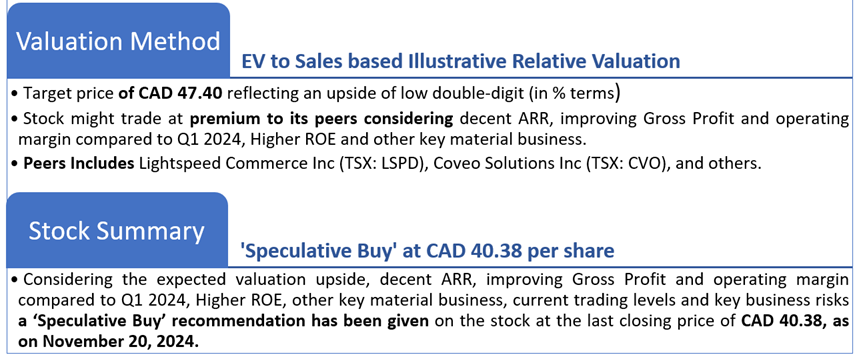
4.1 Valuation Methodology
Valuation Methodology (Illustrative): EV/ Sales based
4.2 Price Performance and Stock Recommendation

The stock has witnessed a downside of ~5.47% in 1 week and ~12.80% over the last 1 month respectively. Moreover, the stock is trading below the average 52-week high price of CAD 60.00 and 52-week low price of CAD 37.92 providing an opportunity to ride the trend.
4.3 One-Year Technical Price Chart
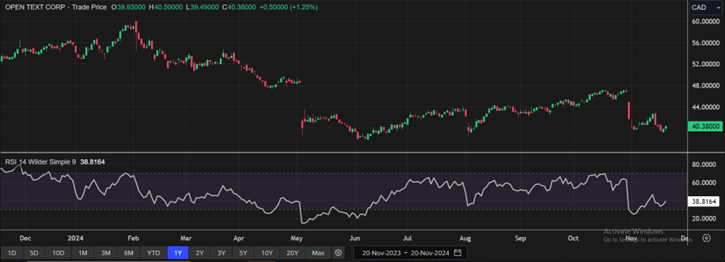
One-Year Technical Price Chart (as of November 20, 2024). Source: REFINITIV, Analysis: Kalkine Group
4.4 Technical Summary
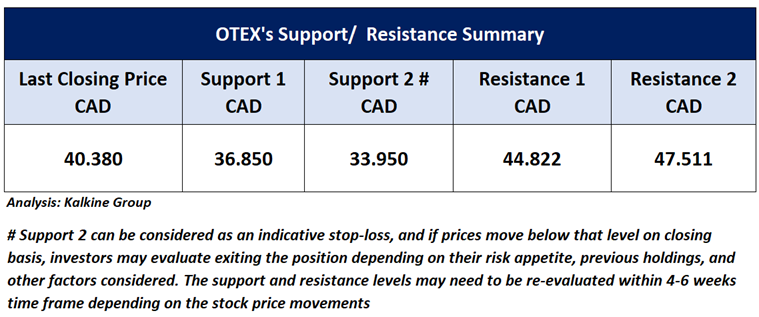
Note 1: Past performance is not a reliable indicator of future performance.
Note 2: The reference date for all price data, currency, technical indicators, support, and resistance levels as on November 20, 2024. The reference data in this report has been partly sourced from REFINITIV.
Note 3: Investment decisions should be made depending on an individual's appetite for upside potential, risks, holding duration, and any previous holdings. An 'Exit' from the stock can be considered if the Target Price mentioned as per the Valuation and or the technical levels provided has been achieved and is subject to the factors discussed above.
Note 4: Dividend Yield may vary as per the stock price movement.
Technical Indicators Defined: -
Support: A level at which the stock prices tend to find support if they are falling, and a downtrend may take a pause backed by demand or buying interest.
Resistance: A level at which the stock prices tend to find resistance when they are rising, and the uptrend may take a pause due to profit booking or selling interest.
Stop-loss: In general, it is a level to protect further losses in case of any unfavourable movement in the stock prices.
Disclaimer This report has been issued by Kalkine New Zealand Limited (FSP691351) (NZBN:9429047678101) (“Kalkine”). Kalkine is a Financial Advice Provider (“FAP”) and is authorised by a Class 1 Financial Advice Provider Licence issued by Financial Markets Authority (“FMA”) to provide financial advice. Kalkine provides only general financial advice through its research reports following a person becoming a member. The reports contain buy/sell/hold and other recommendations in relation to equity securities, managed funds and other managed investment schemes and other financial advice products. The recommendations and opinions in this report and on Kalkine website do not take into account any of your investment objectives, financial situation or needs. Before you make a decision about whether to acquire a financial product, you should obtain the Product Disclosure Statement from the product issuer. You should consider the appropriateness of advice taking into account your own objectives, financial situation and needs and seek independent financial advice before making any financial decisions. If you act on the advice in the research reports, you may have to pay fees, expenses or other amounts (but not to Kalkine). Further information about the complaints and dispute resolution process, as well as information about Kalkine’s duties are available on Kalkine’s website. Please read our Financial Advice Provider (FAP) disclosure statement and Complaints Handling Guide, which are available on the website.
Past performance is not a reliable indicator of future performance.
 Please wait processing your request...