
Company Overview:
PGG Wrightson Limited (NZX: PGW) is an agricultural services business operating throughout New Zealand. Sanford Limited (NZX: SAN) is a New Zealand-based company, which is engaged in fishing and aquaculture farming business.
Kalkine’s Sector Report covers the Key Financial Metrics, Risks, Outlook, Technical Analysis along with the Valuation, Target Price, and Recommendation on the stock.
As per Situation and Outlook for Primary Industries (SOPI) December 2024, the global economic environment has been showing signs of improvement. Inflation is returning towards target levels and interest rates are declining, which continues to reduce debt servicing expenditure. Also, global shipping costs have weakened over the last four months and, while still elevated, farm input costs have started to decline. Export revenue for the high-quality dairy products is anticipated to lift 10% to reach $25.5 Bn in the year to 30 June 2025 because of higher global dairy prices from tight global supply.
Exhibit 1: Total Export Revenue
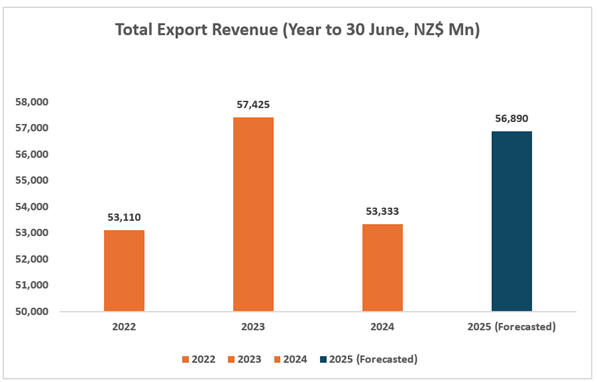
Data Source: This work is based on/includes MPI data which is licensed by Ministry for Primary Industries (MPI) for re-use under the Creative Commons Attribution 4.0 International Licence; Chart Created by Kalkine Group
Continued robust demand for the high-quality produce is expected, with horticulture export revenue touching $8 Bn, up 12% in the year ended 30 June 2025. Kiwifruit is expected to break through the $3 billion mark for the first time. Notably, food and fibre producers have positioned themselves well to navigate a range of challenges. Their resilience and commitment to producing high-quality food and fibre continues to drive record export revenue and power New Zealand’s economy and prosperity
Increase in Value of Kiwifruit Exports
Kiwifruit exports were valued at $3.5 Bn for the 2024 season, as per Stats NZ. The value of kiwifruit exports in the 2024 season increased by $1 Bn (or 44%) as compared to 2023. The kiwifruit season is typically from March to November. While the prices for kiwifruit remained relatively stable, the volume of kiwifruit produced drove the overall increase in exports. This was the great recovery for the industry after last year’s weather events as well as a return to historic highs.
As per the release, Kiwifruit made up 73% ($3,456 Mn) of fruit exports for the year ended November 2024, followed by apples, which represented 21% ($979 Mn). Over the same period, apples increased $118 Mn, and avocados rose $33 Mn as compared with November 2023.
Exhibit 2: Kiwifruit, Quantity (kg) (Mn), March–November Months, 2021–2024
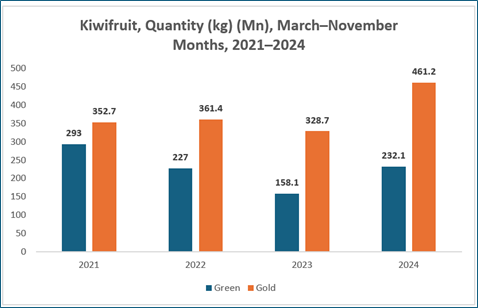
Data Source: This work is based on/includes Stats NZ’s data which are licensed by Stats NZ for reuse under the Creative Commons Attribution 4.0 International Licence; Chart Created by Kalkine Group
Global Economy Demonstrated Resilience
The previous 4 years have tested the resilience of the global economy. A rare pandemic, escalating geopolitical conflicts, and severe weather events impacted the supply chains, triggered energy and food crises as well as led governments to implement significant measures to safeguard lives and livelihoods.
The International Monetary Fund (IMF) anticipates global economic growth to remain stable at 3.2% in both 2024 and 2025 and as disinflation continues, as per SOPI December 2024. This demonstrates that a smooth landing is within reach. Notably, growth forecasts for the US have been upgraded, offsetting downgrades to those for other advanced economies, mainly the largest European countries.
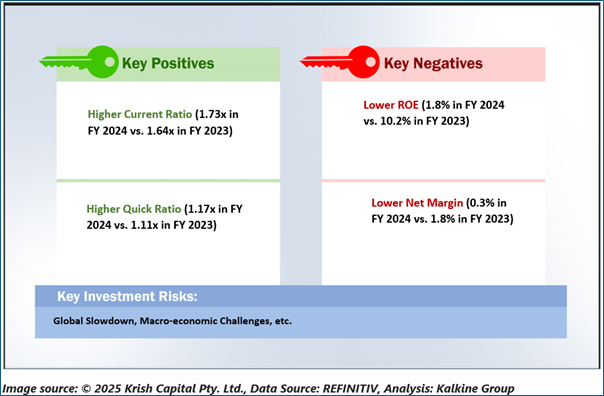
Key Risks and Challenges:
The broader consumer staples sector is exposed to risks like the disruptions to production as well as shipping of commodities, geopolitical tensions, extreme weather events, etc. SOPI December 2024 also highlighted that the uncertainty surrounding the outlook is high, with the balance of risks tilted to the downside. Notably, newly-elected governments in 2024 might introduce significant shifts in trade and fiscal policy.
Exhibit 3. Key Risks in Consumer Staples Sector:
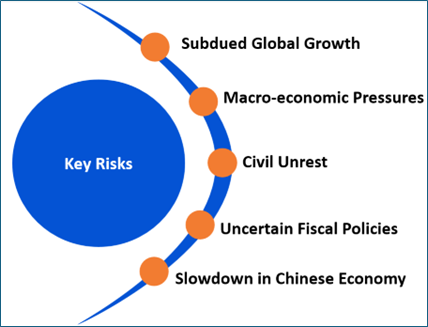
Source: Analysis by Kalkine Group
Outlook:
As per Situation and Outlook for Primary Industries (December 2024), the food and fibre export revenue is expected to reach $56.9 Bn in the year ended 30 June 2025, lifting to a record $58.3 Bn in the year to 30 June 2026. The UAE agreement was negotiated in just over 4 months and delivers 98.5% tariff elimination on NZ exports on entry into force, rising to 99% after 3 years. Notably, the export revenue for the high-quality dairy products is expected to lift 10% to reach $25.5 Bn in the year ended 30 June 2025 due to higher global dairy prices from tight global supply.
Forestry exports are expected to recover, rising 4% in the year ended 30 June 2025 to $6 Bn, following supply disruptions and slow global demand affecting the previous two years. The food and fibre sector made up for 81.1% of NZ’s goods exports in the year ended 30 June 2024. Over the previous 10 years, food and fibre exports have grown on average by 3.2% per year whereas other goods exports have grown by 1.5%.
Apart from the sector-specific factors, an analysis on 2 NZX-listed companies is provided. This report covers their insights, outlook, performance and potential as expected to be delivered in the near to medium term.
1) PGG Wrightson Limited (Recommendation: Buy, Potential Upside: Low Double-Digit) (M-Cap: NZD 120.0 Mn)
Business Description:
PGG Wrightson Limited (NZX: PGW) is a New Zealand-based company, which is primarily involved in the provision of goods and services within the agricultural and horticultural sectors.
Outlook:
Currently, PGW is forecasting an Operating EBITDA for the year to 30 June 2025 of ~$51 million. The beef prices are strong with export demand supporting a positive outlook. PGW is witnessing a greater number of calves being reared as farmers look to respond to this demand. Moreover, horticultural crops witnessed good quality yields in the past harvest season with kiwifruit witnessing ~50 Mn more trays than the previous year.
Technical Overview:
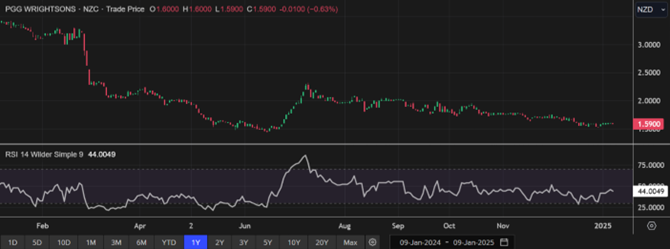
PGW Daily Technical Chart, Data Source: REFINITIV
Technical Commentary
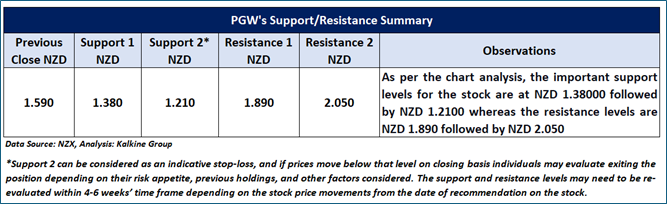
On the daily chart, PGW’s stock prices are undergoing a downtrend characterized by lower highs and higher lows, suggesting a negative bias. Moreover, the momentum oscillator RSI (14-period) is trading below the midpoint, adding more evidence to the mentioned recommendation. Prices are trading between its previous peak and trough, which might serve as resistance and support levels for the stock, respectively. A significant support level for the stock is positioned at NZD 1.38, while critical resistance level is located at NZD 1.89.
Fundamental Valuation
P/E Based Valuation
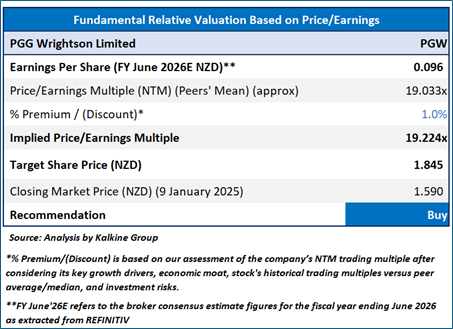
Stock Recommendation
Considering the facts above, a ‘Buy’ recommendation on the stock has been provided at the closing market price of NZD 1.59 per share, down by 0.63% as on 9 January 2025.
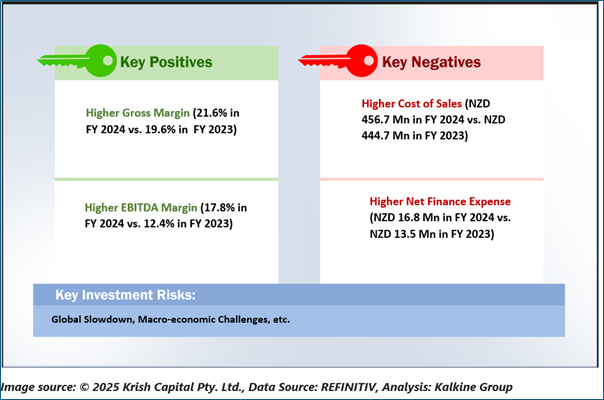
2) Sanford Limited (Recommendation: Hold, Potential Upside: Low Double-Digit) (M-Cap: NZD 400.2 Mn, Annual Dividend Yield: 3.25%)
Business Description:
Sanford Limited (NZX: SAN) is a New Zealand-based company, which is engaged in fishing and aquaculture farming business.
Outlook:
SAN stated that export markets have been simplified, with consolidation in some channels resulting in reduced distribution costs. There has been a focus towards lowering overhead costs throughout the year and accompanied with channel simplification, SAN is witnessing reduction in costs. The balance sheet was strengthened with net debt at $185.5 Mn, down 5% on FY 2024 which was a result of the improved financial performance, increased operational cashflows and reduced capital expenditure.
Technical Overview:
Technical Commentary
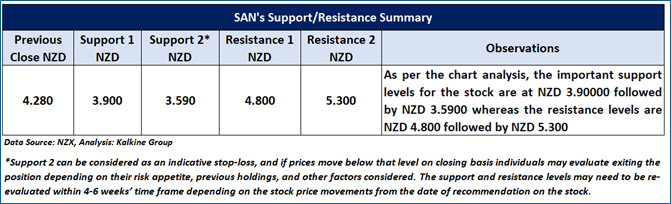
On the daily chart, SAN’s stock prices are forming a trading range, suggesting that the current sideways period in the stock might continue to persist in the near future. Moreover, the momentum oscillator RSI (14-period) is hovering near its midpoint, providing further support to the previous observation. Prices are trading between its previous peak and trough, which might function as a resistance and support levels for the stock, respectively. An important support level for the stock is situated at NZD 3.90, while crucial resistance level is placed at NZD 4.80.
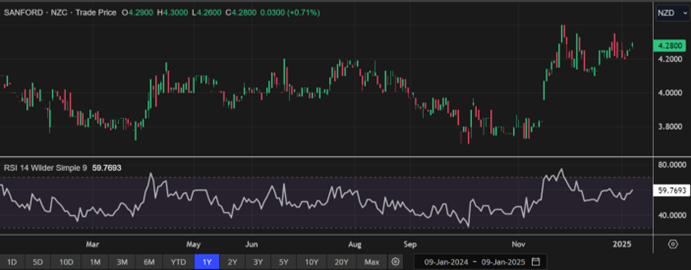
SAN Daily Technical Chart, Data Source: REFINITIV
Fundamental Valuation
P/E Based Relative Valuation
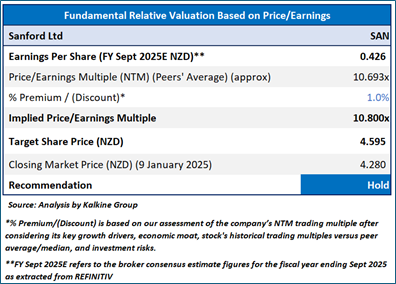
Stock Recommendation
Considering the facts above, a ‘Hold’ recommendation on the stock has been provided at the closing market price of NZD 4.28 per share, up by 0.71% as on 9 January 2025.
Markets are trading in a highly volatile zone currently due to certain macro-economic issues and geopolitical tensions prevailing. Therefore, it is prudent to follow a cautious approach while investing.
Note 1: Past performance is not a reliable indicator of future performance.
Note 2: The reference date for all price data, currency, technical indicators, support, and resistance levels is January 9, 2025. The reference data in this report has been partly sourced from REFINITIV.
Note 3: Investment decisions should be made depending on an individual's appetite for upside potential, risks, holding duration, and any previous holdings. An 'Exit' from the stock can be considered if the Target Price mentioned as per the Valuation and or the technical levels provided has been achieved and is subject to the factors discussed above.
Note 4: Annual Dividend Yield is on a Trailing Twelve Month (TTM1) basis and are subject to change based on factors such as company performance, stock price changes, etc.
Note 5: Kalkine reports are prepared based on the stock prices captured either from REFINITIV or Trading View. Typically, REFINITIV or Trading View may reflect stock prices with a delay which could be a lag of 25-30 minutes. There can be no assurance that future results or events will be consistent with the information provided in the report. The information is subject to change without any prior notice.
Technical Indicators Defined: -
Support: A level at which the stock prices tend to find support if they are falling, and a downtrend may take a pause backed by demand or buying interest. Support 1 refers to the nearby support level for the stock and if the price breaches the level, then Support 2 may act as the crucial support level for the stock.
Resistance: A level at which the stock prices tend to find resistance when they are rising, and an uptrend may take a pause due to profit booking or selling interest. Resistance 1 refers to the nearby resistance level for the stock and if the price surpasses the level, then Resistance 2 may act as the crucial resistance level for the stock.
Stop-loss: It is a level to protect further losses in case of unfavourable movement in the stock prices.
Disclaimer This report has been issued by Kalkine New Zealand Limited (FSP691351) (NZBN:9429047678101) (“Kalkine”). Kalkine is a Financial Advice Provider (“FAP”) and is authorised by a Class 1 Financial Advice Provider Licence issued by Financial Markets Authority (“FMA”) to provide financial advice. Kalkine provides only general financial advice through its research reports following a person becoming a member. The reports contain buy/sell/hold and other recommendations in relation to equity securities, managed funds and other managed investment schemes and other financial advice products. The recommendations and opinions in this report and on Kalkine website do not take into account any of your investment objectives, financial situation or needs. Before you make a decision about whether to acquire a financial product, you should obtain the Product Disclosure Statement from the product issuer. You should consider the appropriateness of advice taking into account your own objectives, financial situation and needs and seek independent financial advice before making any financial decisions. If you act on the advice in the research reports, you may have to pay fees, expenses or other amounts (but not to Kalkine). Further information about the complaints and dispute resolution process, as well as information about Kalkine’s duties are available on Kalkine’s website. Please read our Financial Advice Provider (FAP) disclosure statement and Complaints Handling Guide, which are available on the website.
Past performance is not a reliable indicator of future performance.
 Please wait processing your request...