Section 1: Company Overview and Fundamentals
1.1 Company Overview:
Himax Technologies Inc (NASDAQ: HIMX) is mainly engaged in the fabless semiconductor solution. The Company offers comprehensive automotive integrated circuit (IC) solutions, including traditional driver ICs, in-cell touch and display driver integration, large touch and display driver integration and local dimming timing controllers.
Kalkine’s Dividend Income Report covers the Company Overview, Key positives & negatives, Investment summary, Key investment metrics, Top 10 shareholding, Business updates and insights into company recent financial results, Key Risks & Outlook, Price performance and technical summary, Target Price, and Recommendation on the stock.
Price Performance:

1.2 The Key Positives, Negatives, and Investment summary


1.3 Top 10 shareholders:
The top 10 shareholders together form ~41.48% of the total shareholding, signifying concentrated shareholding. BW Group Limited and Hemen Holding Limited, are the biggest shareholders, holding the maximum stake in the company at ~21.98% and ~6.53%, respectively.

1.4 Dividend payments with impressive dividend yield:
Himax Technologies, Inc. (Nasdaq: HIMX) announced the declaration of a cash dividend for fiscal year 2024, set at 37.0 cents per American Depositary Share (ADS), equivalent to 18.5 cents per ordinary share, to be disbursed on July 11, 2025, to shareholders of record as of June 30, 2025, with the ADS book closed for transactions from June 23, 2025, to June 30, 2025. This dividend, reflecting a payout ratio of 81.1% of the previous year’s profit, aligns with the company’s established practice of distributing annual dividends mid-year based on prior financial performance, a tradition upheld since its initial public offering in 2006, as emphasized by President and CEO Mr. Jordan Wu, who underscored the company’s commitment to rewarding shareholders while maintaining a robust balance sheet and pursuing sustainable long-term growth through dividends and share repurchases.

1.5 Key Metrics
Himax Technologies, Inc. (Nasdaq: HIMX) demonstrates a notable improvement in financial efficiency from Q1 FY24 to Q1 FY25, as evidenced by an increase in gross profit margin from 29.3% to 30.5%, reflecting enhanced profitability through a favorable product mix and cost optimization. Key profitability metrics also advanced significantly, with EBITDA margin rising from 7.5% to 11.6%, operating margin from 4.8% to 9.2%, income before tax margin from 5.9% to 11.2%, and net margin from 5.9% to 9.4%, indicating stronger operational performance and effective expense management. However, the free cash flow yield declined from 12.8% to 8.9% over the trailing twelve months (TTM), suggesting a potential reduction in cash generation efficiency, while returns on average common equity (from 5.4% to 9.8%), average total assets (from 2.8% to 5.4%), and invested capital (from 4.1% to 6.5%) all improved, highlighting a robust enhancement in capital utilization and overall financial health as of the latest reporting period.

Section 2: Business Updates and Financial Highlights
2.1 Recent Updates:
The below picture gives an overview of the recent updates:

2.2 Insights of Q1FY25:

Section 3: Key Risks and Outlook:


Section 4: Stock Recommendation Summary:
4.1 Technical Summary:
Price Performance:


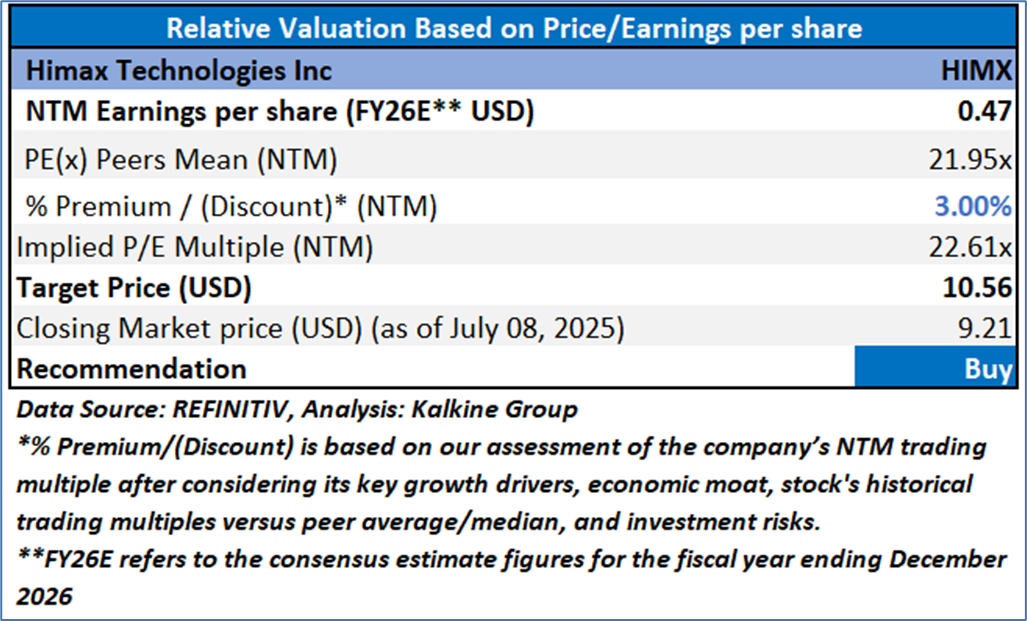
4.2 Fundamental Valuation
Valuation Methodology: Price/Earnings Per Share Multiple Based Relative Valuation

Markets are trading in a highly volatile zone currently due to certain macroeconomic issues and geopolitical tensions prevailing. Therefore, it is prudent to follow a cautious approach while investing.
Note 1: Past performance is not a reliable indicator of future performance.
Note 2: The reference date for all price data, currency, technical indicators, support, and resistance levels is July 08, 2025. The reference data in this report has been partly sourced from REFINITIV.
Note 3: Investment decisions should be made depending on an individual's appetite for upside potential, risks, holding duration, and any previous holdings. An 'Exit' from the stock can be considered if the Target Price mentioned as per the Valuation and or the technical levels provided has been achieved and is subject to the factors discussed above.
Note 4: The report publishing date is as per the Pacific Time Zone.
Technical Indicators Defined: -
Support: A level at which the stock prices tend to find support if they are falling, and a downtrend may take a pause backed by demand or buying interest. Support 1 refers to the nearby support level for the stock and if the price breaches the level, then Support 2 may act as the crucial support level for the stock.
Resistance: A level at which the stock prices tend to find resistance when they are rising, and an uptrend may take a pause due to profit booking or selling interest. Resistance 1 refers to the nearby resistance level for the stock and if the price surpasses the level, then Resistance 2 may act as the crucial resistance level for the stock.
Stop-loss: It is a level to protect against further losses in case of unfavorable movement in the stock prices.
Disclaimer This report has been issued by Kalkine New Zealand Limited (FSP691351) (NZBN:9429047678101) (“Kalkine”). Kalkine is a Financial Advice Provider (“FAP”) and is authorised by a Class 1 Financial Advice Provider Licence issued by Financial Markets Authority (“FMA”) to provide financial advice. Kalkine provides only general financial advice through its research reports following a person becoming a member. The reports contain buy/sell/hold and other recommendations in relation to equity securities, managed funds and other managed investment schemes and other financial advice products. The recommendations and opinions in this report and on Kalkine website do not take into account any of your investment objectives, financial situation or needs. Before you make a decision about whether to acquire a financial product, you should obtain the Product Disclosure Statement from the product issuer. You should consider the appropriateness of advice taking into account your own objectives, financial situation and needs and seek independent financial advice before making any financial decisions. If you act on the advice in the research reports, you may have to pay fees, expenses or other amounts (but not to Kalkine). Further information about the complaints and dispute resolution process, as well as information about Kalkine’s duties are available on Kalkine’s website. Please read our Financial Advice Provider (FAP) disclosure statement and Complaints Handling Guide, which are available on the website.
Past performance is not a reliable indicator of future performance.
 Please wait processing your request...