
Kalkine’s Global Tariff Report delivers objective, data-driven insights into key global sectors impacted by tariff fluctuations. It assesses how these changes influence equity valuations across affected industries, with a focus on trade-sensitive sectors that often attract increased investor attention during times of tariff-related uncertainty. The report also highlights defensive and countercyclical segments that tend to show resilience—or even outperformance—amid disruptions in global trade dynamics.
As illustrated in the table below, several key sectors in different countries are directly impacted by the recent tariff announcement from President Trump.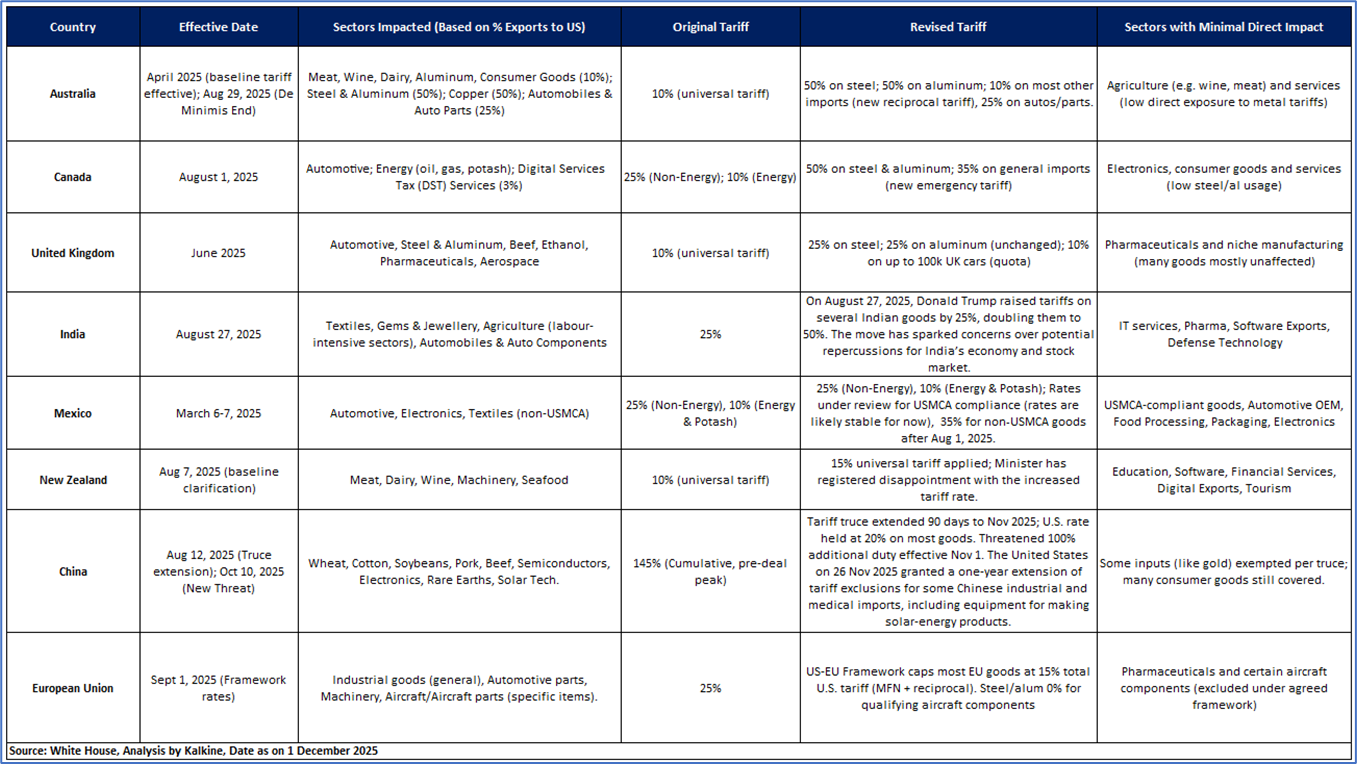

Key Highlights
Latest Key Developments (as of 1 December 2025)
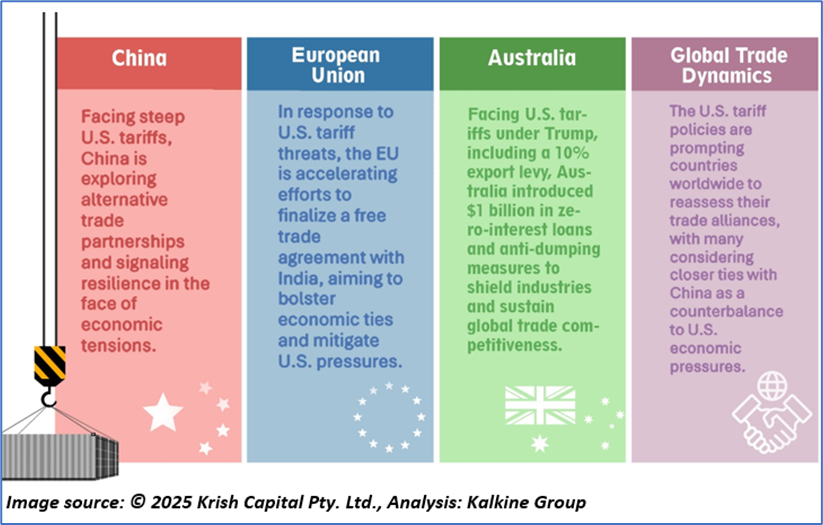
Global Implications of Tariffs

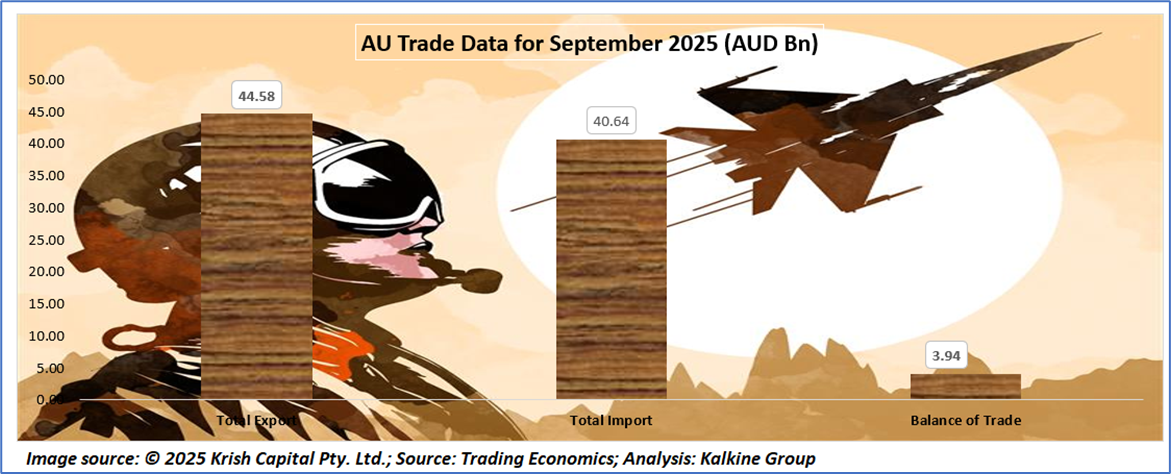
Australia’s latest external sector indicators show a mixed but stabilizing outlook. The trade balance strengthened to AUD 3.94 billion in September 2025, supported by rising exports (AUD 44.6 billion) outpacing imports, which plateaued at a record AUD 40.6 billion. However, the current account remains in deficit at AUD –13.65 billion, reflecting softer services exports and higher income outflows, keeping the ratio steady at –2% of GDP. Capital inflows improved to AUD 17.7 billion, while foreign direct investment surged to AUD 81 billion, signaling renewed investor confidence. Despite stable terms of trade at 114 points and steady gold reserves, external debt remains elevated at AUD 2.68 trillion. Tourist arrivals fell from the previous quarter, indicating ongoing volatility in the services sector.


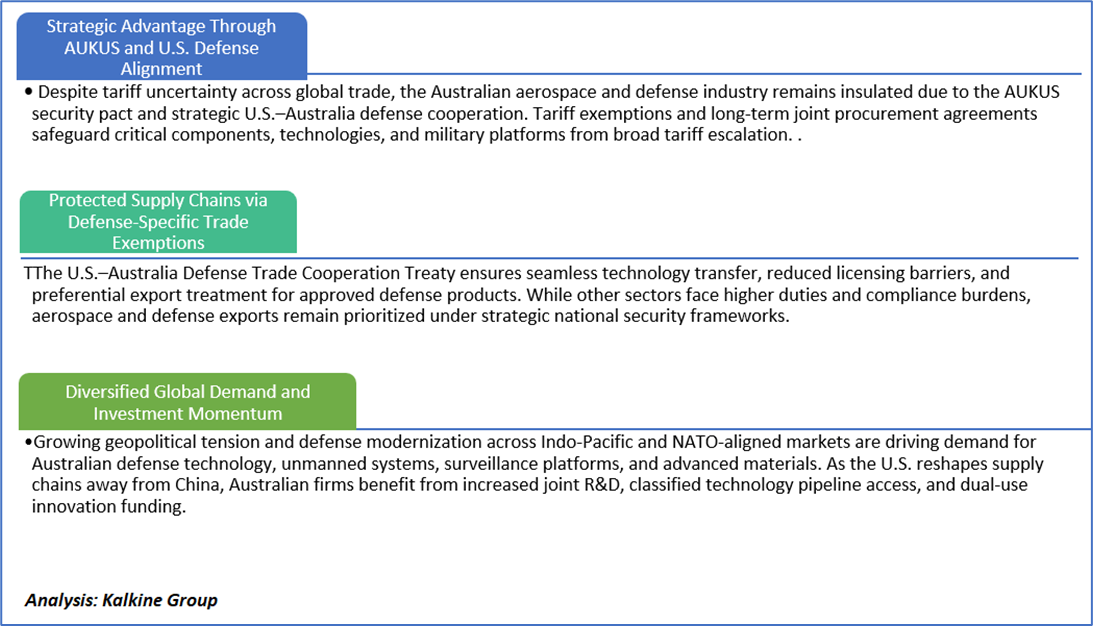
Amid elevated Market Volatility and Tariff pressures, HighCom Limited (ASX: HCL) stands out as a defensive pick within the Aerospace and Defense sector, supported by rigorous fundamental and technical research.
Section 1: Company Overview and Fundamentals Insights
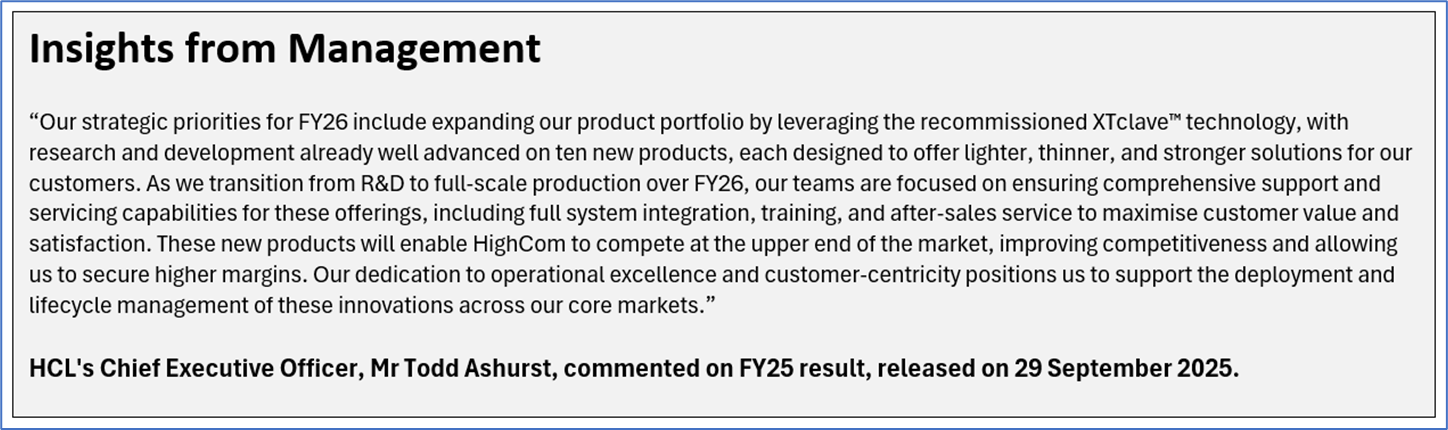
Company Overview: HighCom Limited (ASX: HCL) is an Australia-based defense and security technology company, operating through two segments: HighCom Armor (ballistic protection products) and HighCom Technology (including small, unmanned aircraft systems, sensors, integration, and support).
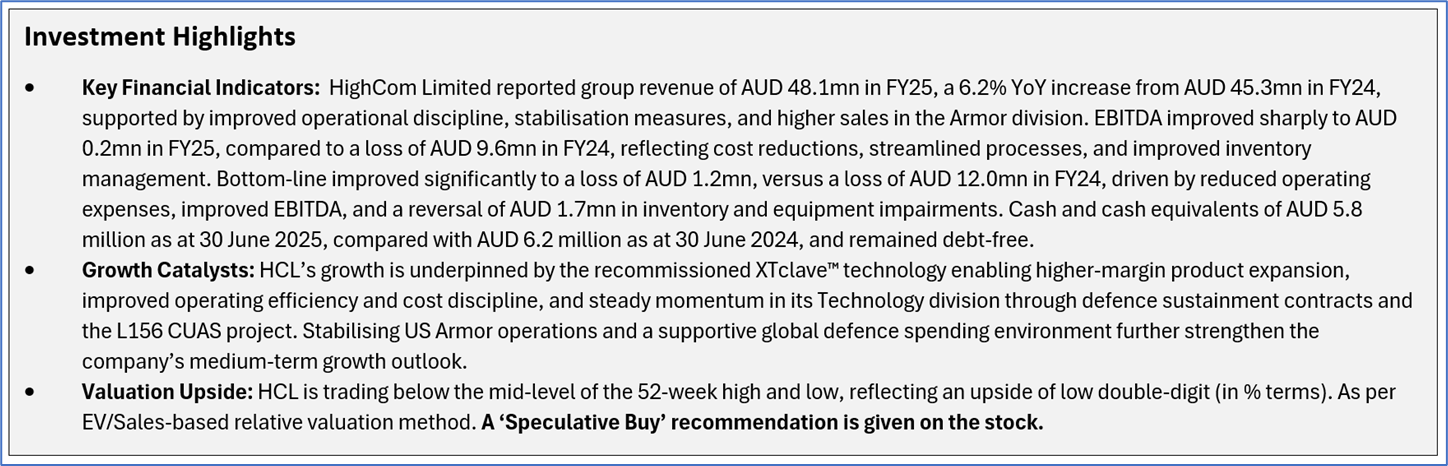
Kalkine’s Global Tariff Report covers the Investment Highlights, Key Financial Metrics, Risks, and Technical Analysis along with the Valuation, Target Price, and Recommendation on the stock.
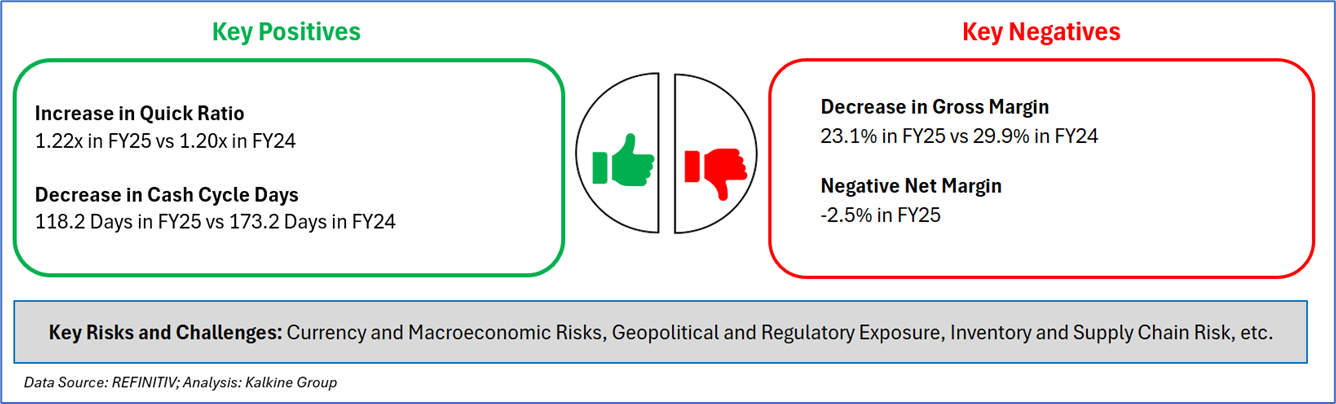
1.2 The Key Positives, Negatives, Investment Highlights, and Risks
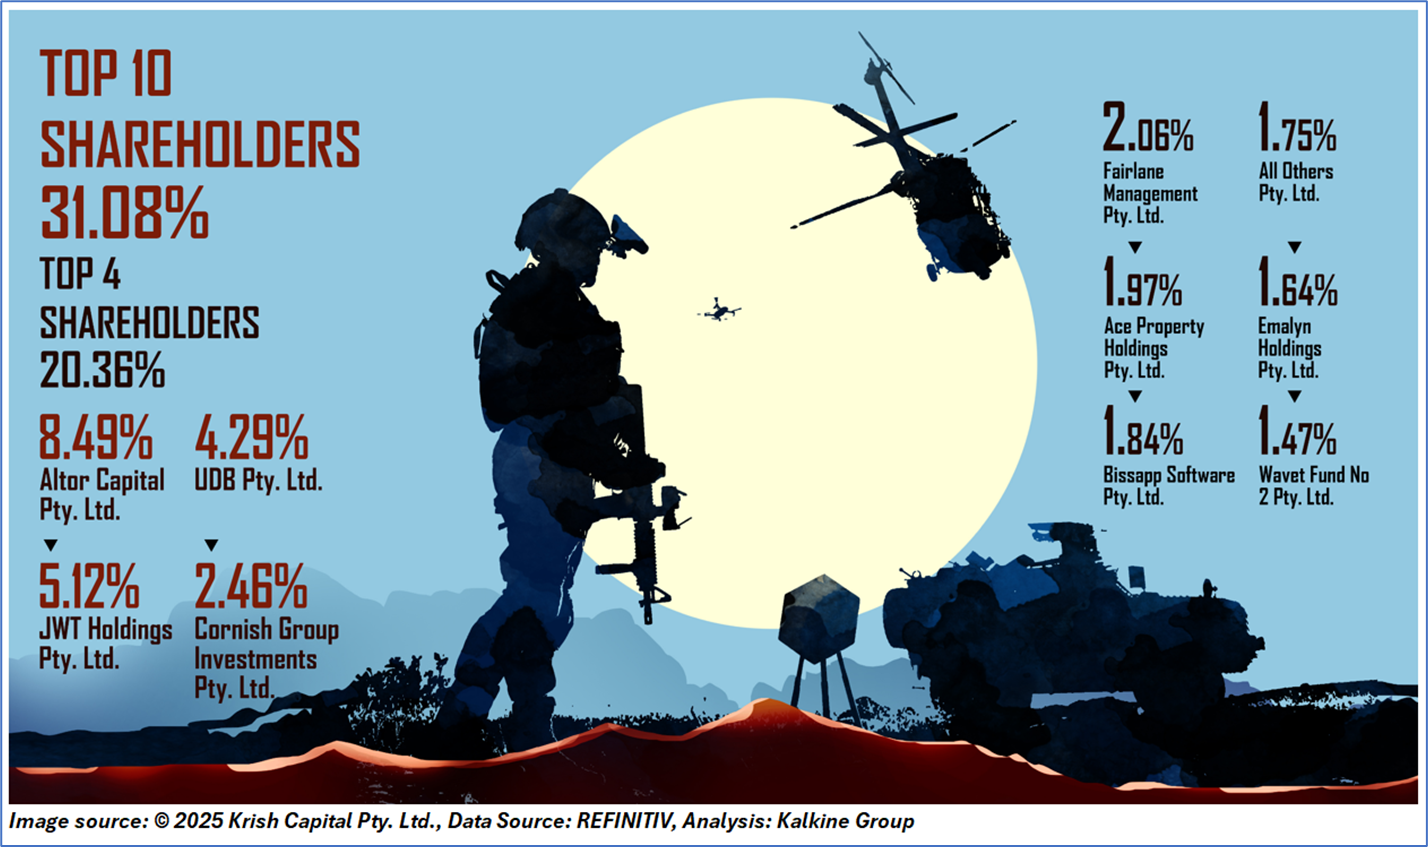
1.3 Top 10 Shareholders:
The top 10 shareholders together form ~31.08% of the total shareholding. Altor Capital Pty. Ltd., and JWT Holdings Pty. Ltd. hold maximum stakes of 8.49% and 5.12%, respectively.
1.4 Key Metrics: HLS’s average accounts receivable days decreased to 30.2 days in FY25 compared to 125.9 days in FY24. Below is captured other metrics:
Section 2: Business Updates, Financial and Operational Highlights
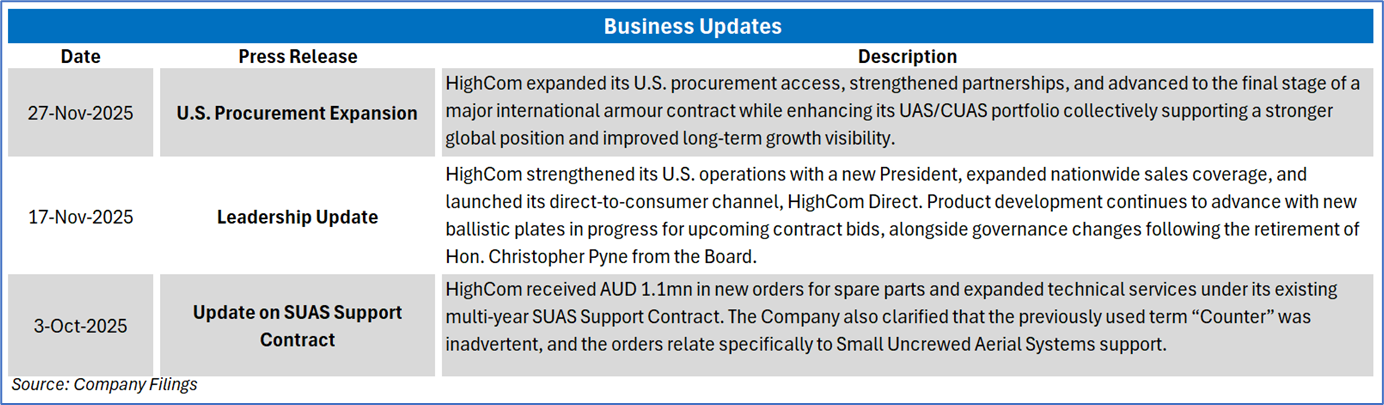
2.1 Recent Business Updates:
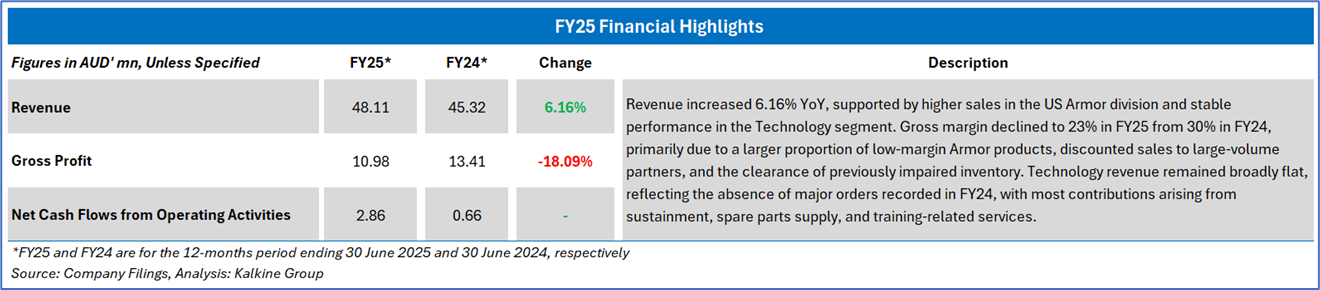
2.2 FY25 Results Highlights (for the 12 months ended 30 June 2025): Below mentioned are some key financial highlights:
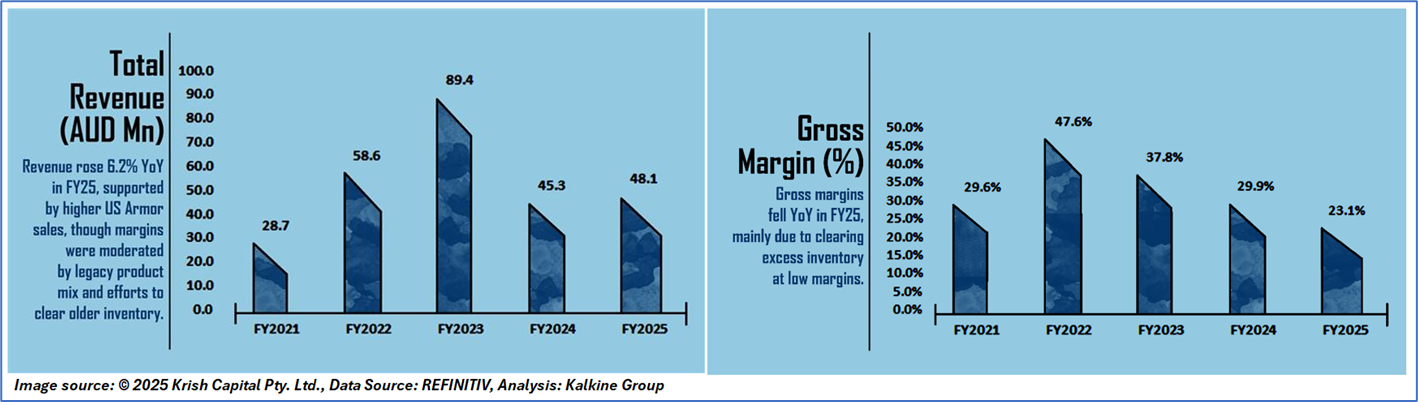
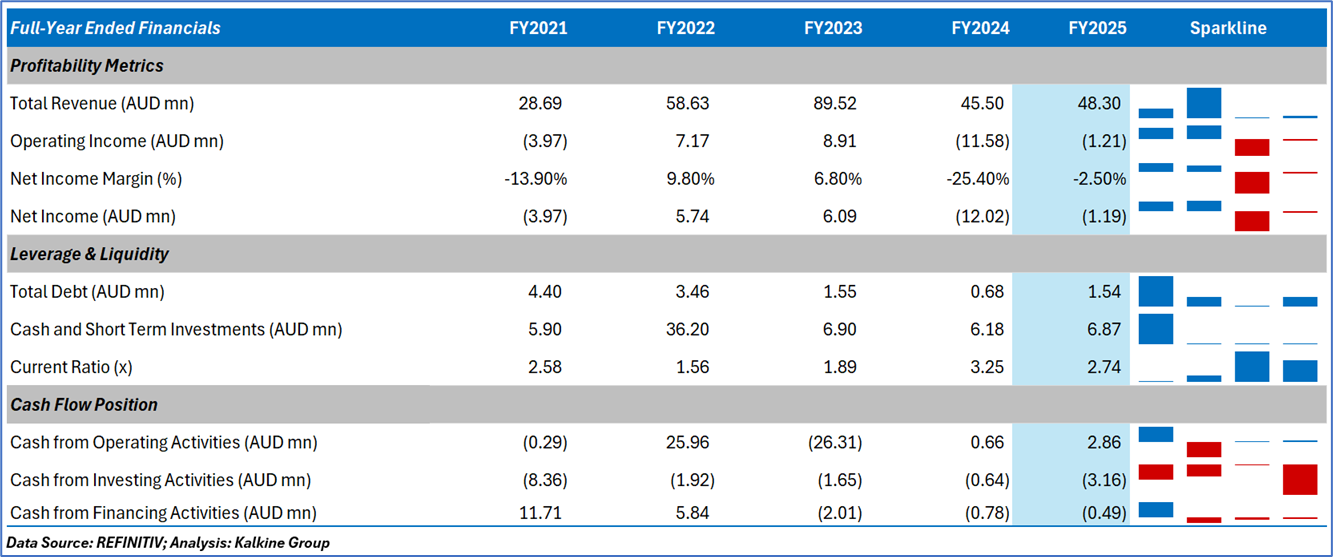
2.3 Historical Financial Trend
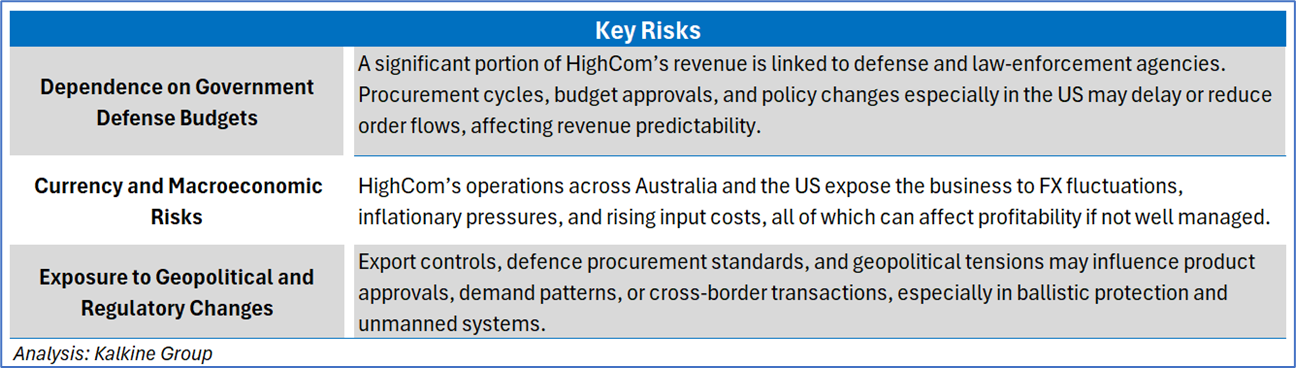
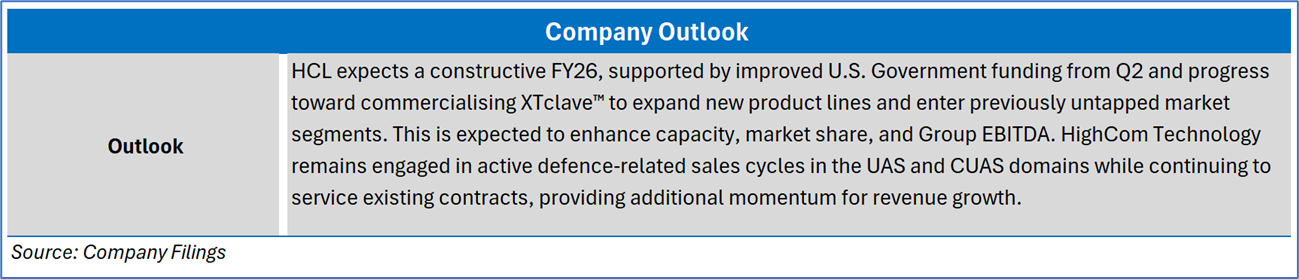
Section 3: Key Risks and Outlook:
Section 4: Stock Recommendation Summary
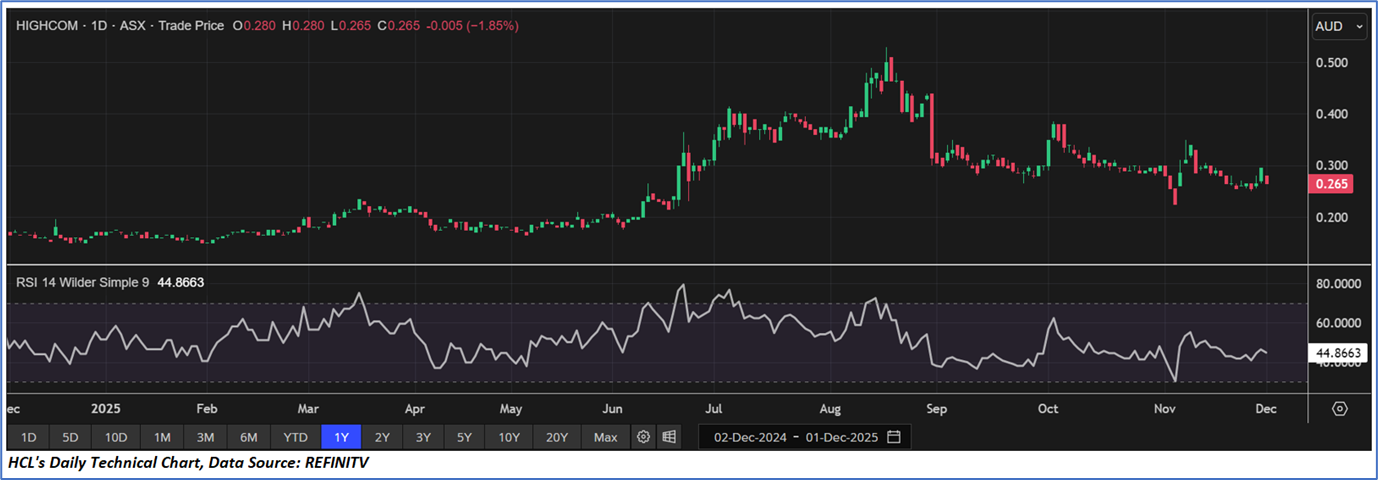
4.1 Price Performance and Technical Summary
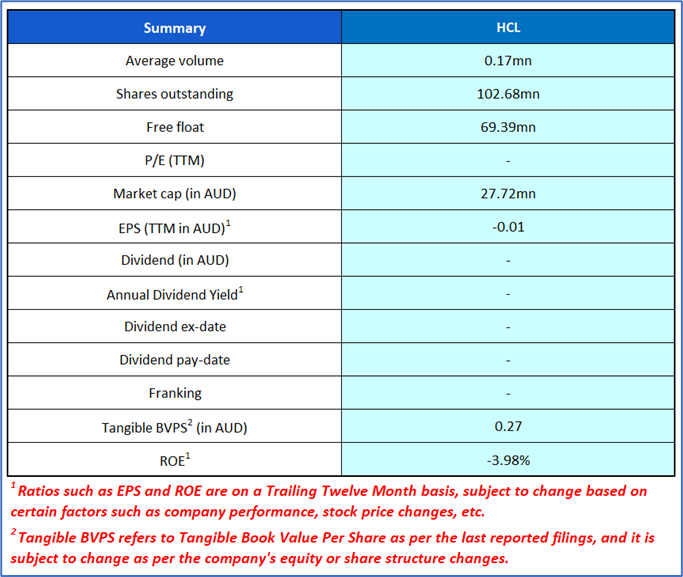
The stock has decreased by ~13.11% in the last three months, and over the past six months, stock has increased by ~32.50%. The stock has a 52-week low and 52-week high of AUD 0.150 and AUD 0.530, respectively, and is currently trading below the 52-week high-low average. HCL was last covered in a report dated ‘07 July 2025’.
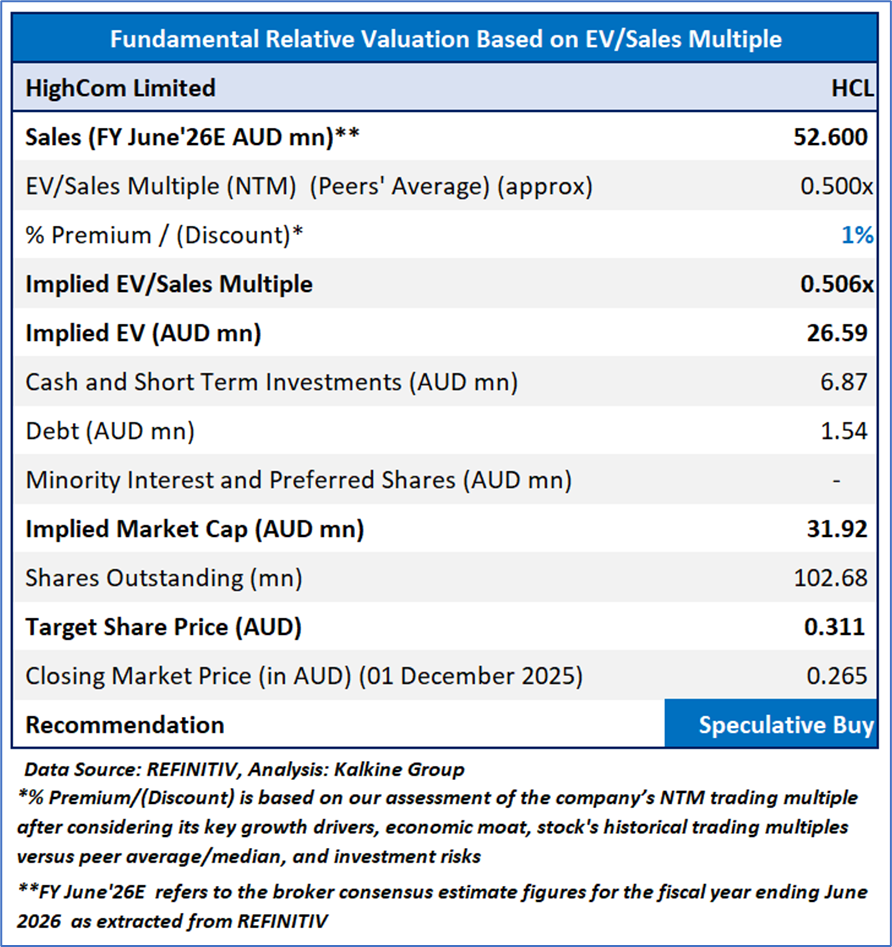
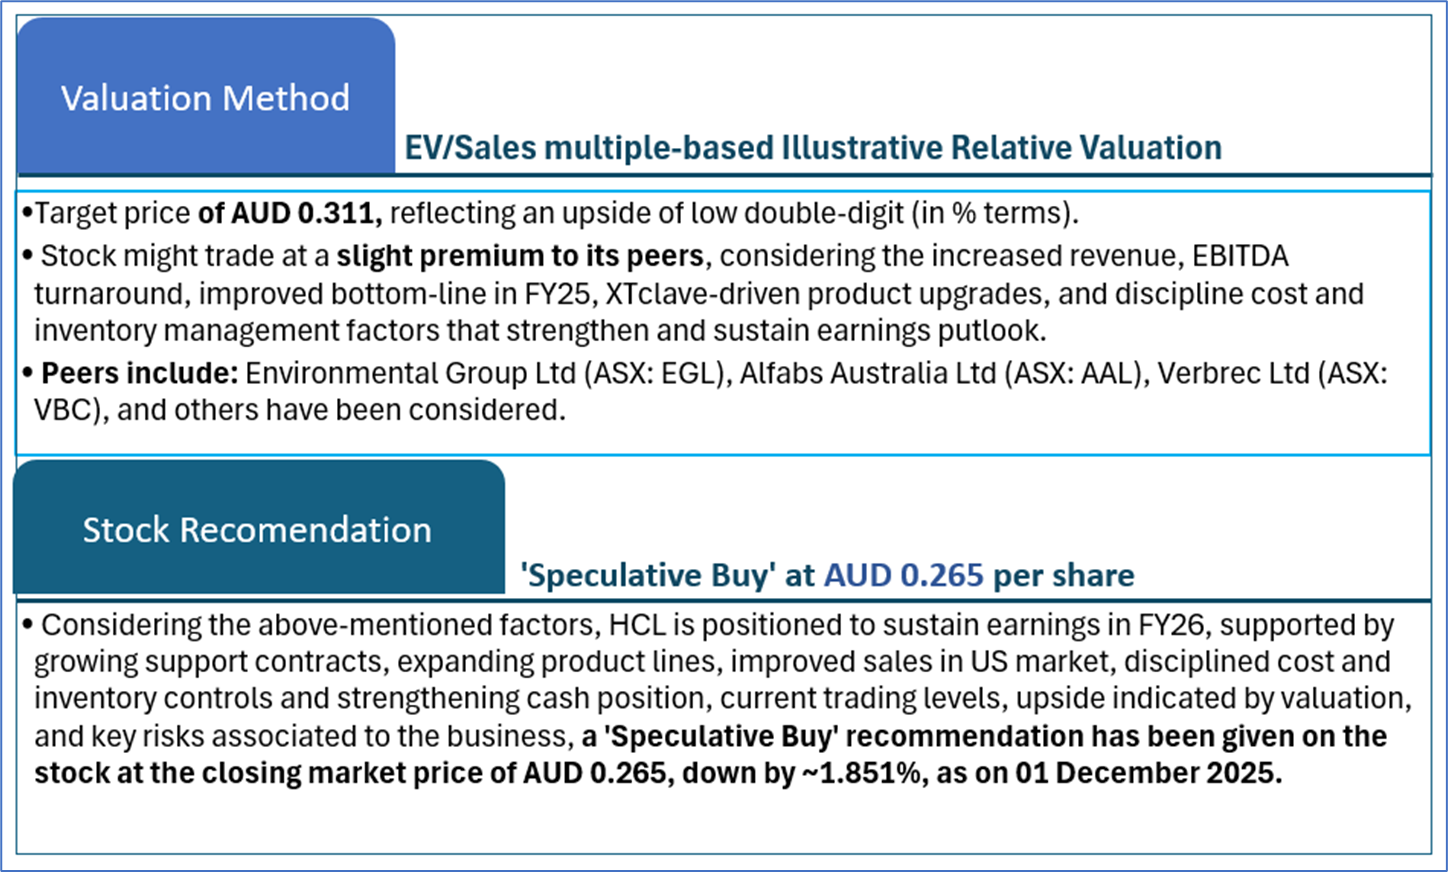
4.2 Fundamental Valuation and Stock Recommendation
Markets are trading in a highly volatile zone currently due to certain macro-economic issues and geopolitical tensions prevailing. Therefore, it is prudent to follow a cautious approach while investing.
Note 1: Past performance is neither an indicator nor a guarantee of future performance.
Note 2: The reference date for all price data, currency, technical indicators, support, and resistance levels is 01 December 2025. The reference data in this report has been partly sourced from REFINITIV.
Note 3: Investment decisions should be made depending on an individual's appetite for upside potential, risks, holding duration, and any previous holdings. An 'Exit' from the stock can be considered if the Target Price mentioned as per the Valuation and or the technical levels provided has been achieved and is subject to the factors discussed above.
Note 4: Kalkine reports are prepared based on the stock prices captured either from REFINITIV or Trading View. Typically, REFINITIV or Trading View may reflect stock prices with a delay which could be a lag of 25-30 minutes. There can be no assurance that future results or events will be consistent with the information provided in the report. The information is subject to change without any prior notice.
Technical Indicators Defined: -
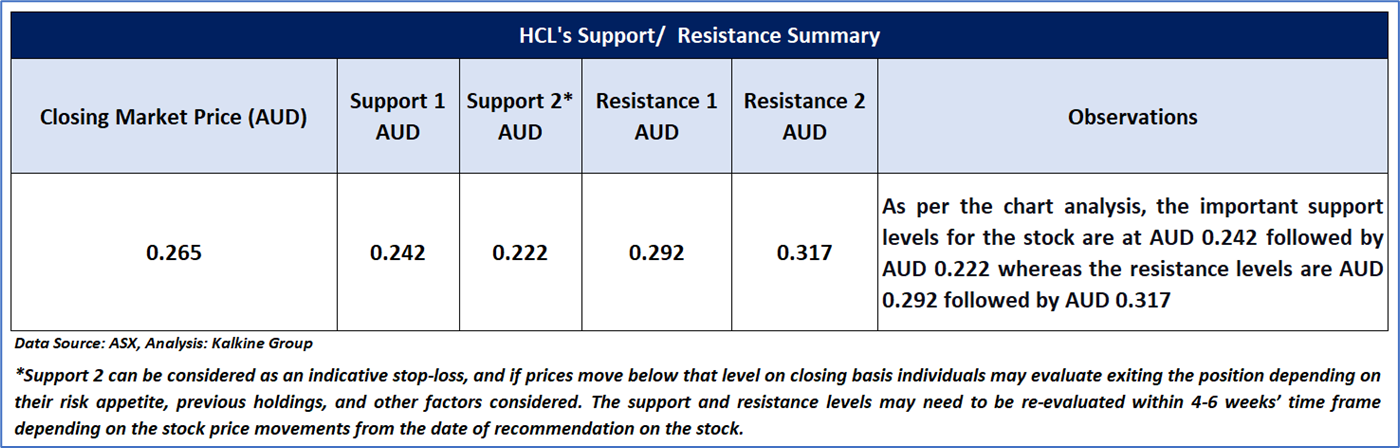
Support: A level at which the stock prices tend to find support if they are falling, and a downtrend may take a pause backed by demand or buying interest. Support 1 refers to the nearby support level for the stock and if the price breaches the level, then Support 2 may act as the crucial support level for the stock.
Resistance: A level at which the stock prices tend to find resistance when they are rising, and an uptrend may take a pause due to profit booking or selling interest. Resistance 1 refers to the nearby resistance level for the stock and if the price surpasses the level, then Resistance 2 may act as the crucial resistance level for the stock.
Stop-loss: It is a level to protect further losses in case of unfavourable movement in the stock prices.
This report (“Report”) has been issued by Kalkine New Zealand Limited (FSP691351) (NZBN:9429047678101) (“Kalkine”). Kalkine is a Financial Advice Provider (“FAP”) and is authorised by a Class 1 Financial Advice Provider Licence issued by Financial Markets Authority (“FMA”) to provide financial advice. Kalkine provides only general financial advice through its research reports following a person becoming a member. The reports contain buy/sell/hold and other recommendations in relation to equity securities, managed funds and other managed investment schemes and other financial advice products. The recommendations and opinions in this Report and on Kalkine website do not take into account any of your investment objectives, financial situation or needs. Before you make a decision about whether to acquire a financial product, you should obtain the Product Disclosure Statement from the product issuer. You should consider the appropriateness of advice taking into account your own objectives, financial situation and needs and seek independent financial advice before making any financial decisions. If you act on the advice in the research reports, you may have to pay fees, expenses or other amounts (but not to Kalkine).
The information in this Report and on the Kalkine website has been prepared from a wide variety of sources, which Kalkine, to the best of its knowledge and belief, considers accurate. Kalkine has made every effort to ensure the reliability of the information contained in its reports (including this Report), newsletters and websites. All information represents our views at the date of publication and may change without notice.
Kalkine does not issue, sell or deal in any financial products. The information in this Report does not constitute an offer to sell securities or other financial products or a solicitation of an offer to buy securities or other financial products. Our reports contain general recommendations to invest in securities and other financial products. Kalkine is not responsible for, and does not guarantee, the performance of, or returns on, any investments mentioned in this Report.
This Report may contain information on past performance of particular investments. Past performance is not a reliable indicator of future performance. Returns stated do not take into account transaction costs and taxes.
Further information about the complaints and dispute resolution process, as well as information about Kalkine’s duties are available on Kalkine’s website. Please read our Financial Advice Provider (FAP) disclosure statement and Complaints Handling Guide, which are available on the website.
Copyright 2025 Krish Capital Pty. Ltd. (ABN 61629651510). All Rights Reserved. No part of this Report, or its content, may be reproduced in any form without our prior consent.
Past performance is not a reliable indicator of future performance.
 Please wait processing your request...