
Section 1: Company Overview and Fundamentals
1.1 Company Overview:
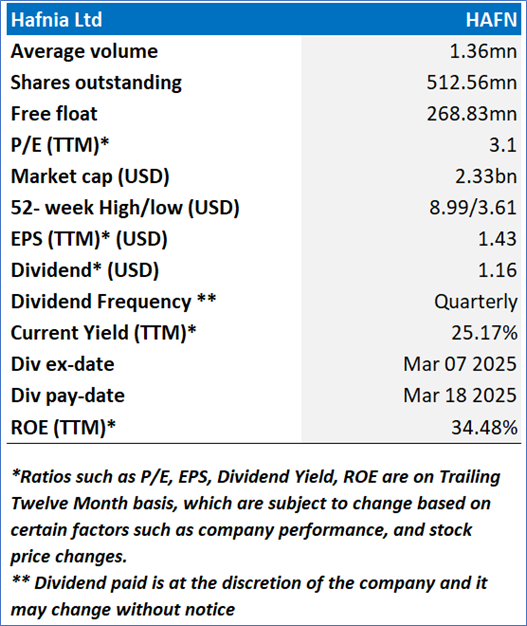
Hafnia Limited (NYSE: HAFN) is an investment holding company. The Company is an operator of products and chemical tankers. The Company offers a fully integrated shipping platform, including technical management, commercial and chartering services, pool management, and a large-scale bunker desk. The Company segments include Long Range II (LR2), Long Range I (LR1), Medium Range (MR), and Handy size (Handy), Chemical - Stainless, Chemical - Handy, and Chemical - MR.
Kalkine’s Dividend Income Report covers the Company Overview, Key positives & negatives, Investment summary, Key investment metrics, Top 10 shareholding, Business updates and insights into company recent financial results, Key Risks & Outlook, Price performance and technical summary, Target Price, and Recommendation on the stock.
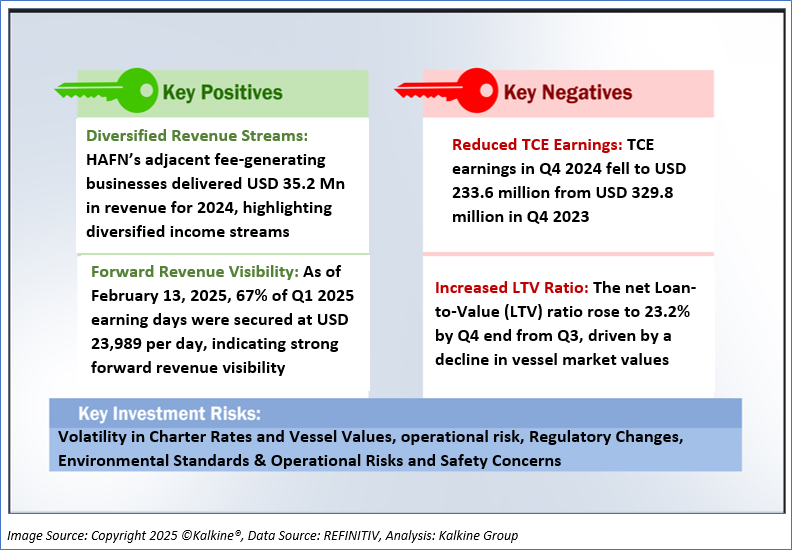
1.2 The Key Positives, Negatives, and Investment summary
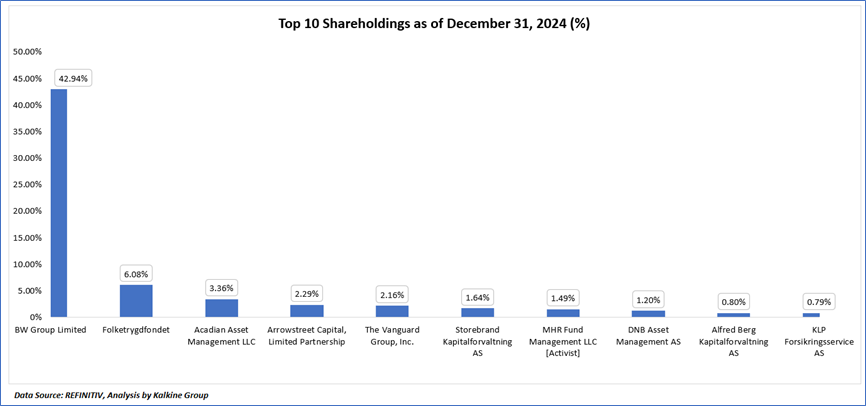
1.3 Top 10 shareholders:
The top 10 shareholders together form ~62.75% of the total shareholding, signifying diverse shareholding. BW Group Limited, Folketrygdfondet, are the biggest shareholders, holding the maximum stake in the company at ~42.94% and ~6.08%, respectively.
1.4 Consistent dividend payments with impressive dividend yield:
Hafnia Limited has structured a comprehensive dividend policy designed to reward shareholders while maintaining financial flexibility, with quarterly dividends determined as a percentage of net profit, adjusted to exclude extraordinary items that might skew the profitability picture. This payout ratio is strategically tiered based on the company’s net Loan-to-Value (LTV) ratio, a key financial metric that reflects the balance between debt and asset value. Specifically, if the LTV exceeds 40%, Hafnia targets a 50% payout; if it falls between 30% and 40%, the target rises to 60%; for an LTV between 20% and 30%, the payout increases to 80%; and if the LTV is 20% or lower, the company aims for a generous 90% payout. The LTV ratio itself is calculated by taking the total vessel-related debt—including bank loans and finance leases, but excluding debts tied to vessels sold yet pending legal finalization, plus debt from pool borrowing facilities—subtracting the cash reserves held at bank and on hand, and then dividing this net figure by the broker-assessed market value of Hafnia’s wholly owned vessels. This approach ensures that dividend distributions are aligned with the company’s leverage position, balancing shareholder returns with the need to maintain a healthy capital structure.
The ultimate decision on the dividend amount rests with Hafnia’s Board of Directors, who exercise discretion to ensure that payouts are sustainable and prudent. In making this determination, the Board evaluates a range of factors, including the company’s capital expenditure commitments—such as investments in new vessels or fleet upgrades—its overall financial condition, prevailing business conditions in the product tanker market, and any legal or contractual restrictions that might limit cash distributions. These could include covenants in loan agreements or other obligations that require maintaining certain liquidity levels. Beyond cash dividends, Hafnia also retains the flexibility to enhance shareholder value through share buybacks, which can serve as an additional mechanism to return capital when market conditions or share price valuations present opportunities, as seen in late 2024. This dual approach allows the company to adapt its capital return strategy to both its financial health and external market dynamics.
For the fourth quarter of 2024, Hafnia’s Board applied this policy in practice, setting a total payout ratio of 80%, which corresponds to the LTV range of above 20% but equal to or below 30%—a reflection of the company’s reported net LTV of 23.2% at quarter-end. This 80% payout ratio encompasses both cash dividends and share repurchasing activities conducted during the quarter. Specifically, Hafnia allocated USD 49.1 million to share buybacks in December 2024, capitalizing on a dislocation between its share price and net asset value (NAV), which allowed the company to repurchase approximately 2.8% of its outstanding shares at a favorable rate. After accounting for this buyback expenditure, the remaining portion of the payout was distributed as a cash dividend, totaling USD 14.6 million, or USD 0.0294 per share. This cash dividend represents an 18.4% payout ratio of the Q4 net profit of USD 79.6 million, with the buyback portion effectively boosting the total capital returned to shareholders to align with the 80% target.
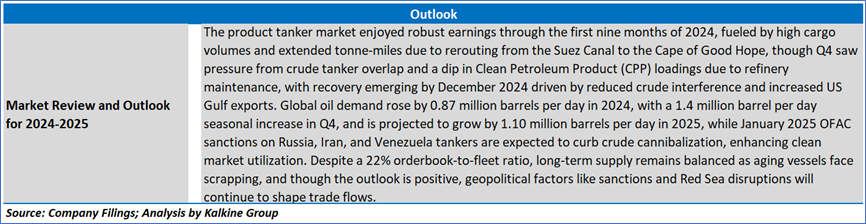
1.6 Market Review and Outlook for Q4 and Full Year 2024
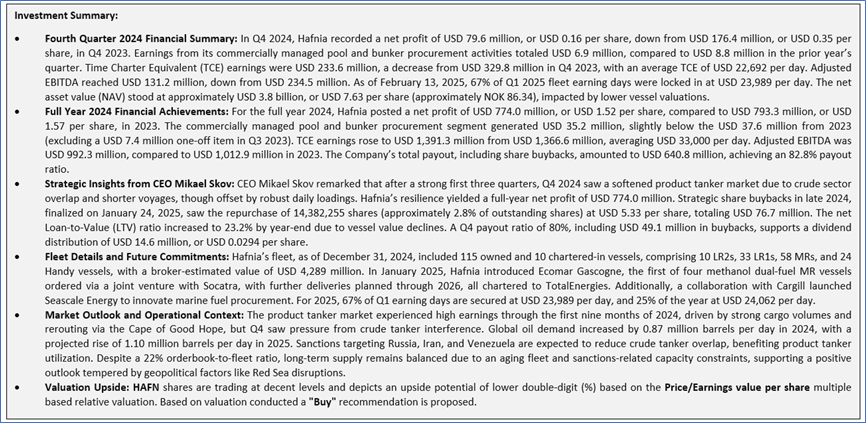
The product tanker market in 2024 saw strong earnings through the first nine months due to high cargo volumes and tonne-miles from rerouting via the Cape of Good Hope, but Q4 faced rate pressures from crude sector cannibalization and a temporary drop in Clean Petroleum Product (CPP) loadings due to refinery maintenance, though loadings rebounded by December 2024 and into 2025, driven by reduced crude interference and US Gulf exports; global oil demand rose by 0.87 million barrels per day in 2024, with a 1.4 million barrel per day Q4 increase, and is projected to grow by 1.10 million barrels per day in 2025, while January 2025 sanctions on Russia, Iran, and Venezuela tankers are expected to ease clean market pressures, despite a 22% orderbook-to-fleet ratio, with long-term supply balanced by aging vessels and a positive outlook tempered by geopolitical uncertainties like Red Sea disruptions.
Section 2: Business Updates and Financial Highlights
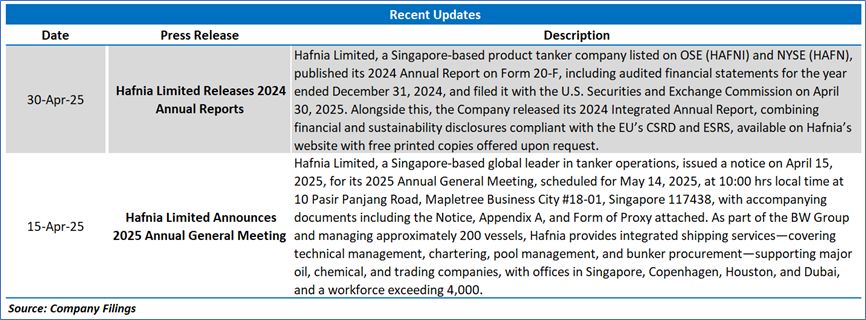
2.1 Recent Updates:
The below picture gives an overview of the recent updates:
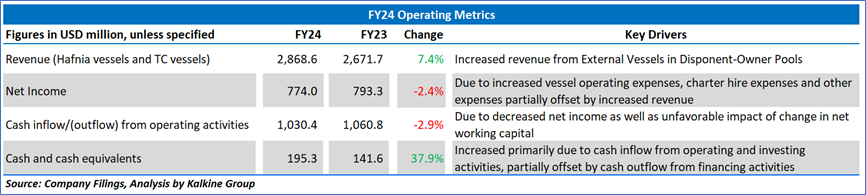
2.2 Insights of FY24:
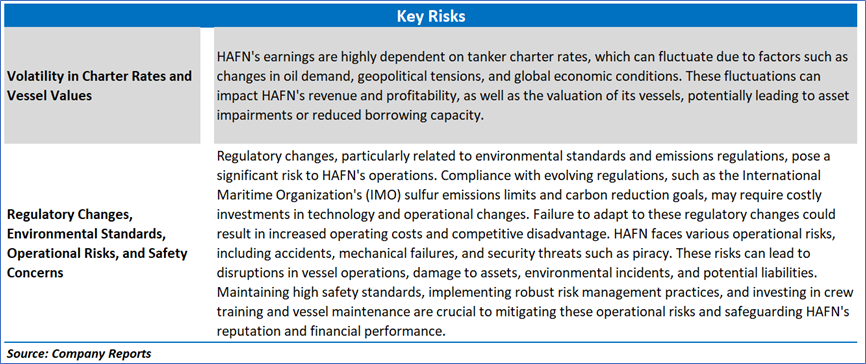
Section 3: Key Risks and Outlook:
Section 4: Stock Recommendation Summary:
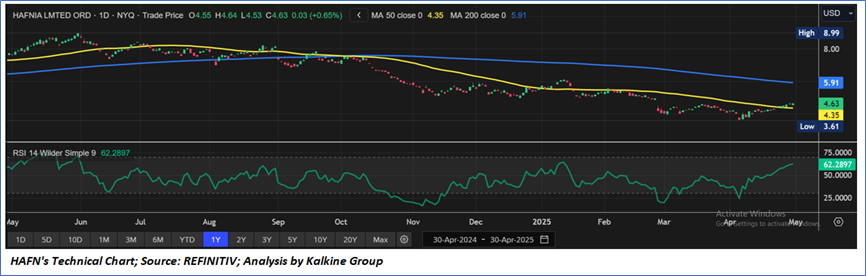
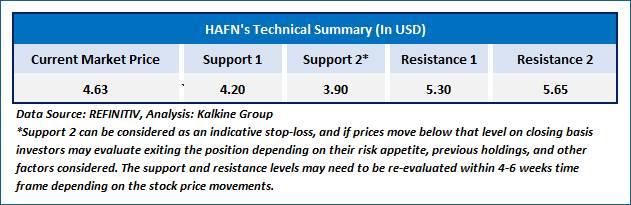
4.1 Technical Summary:
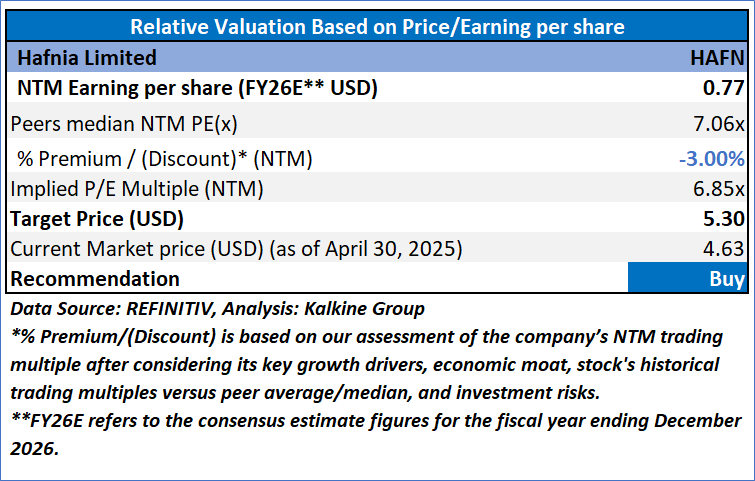
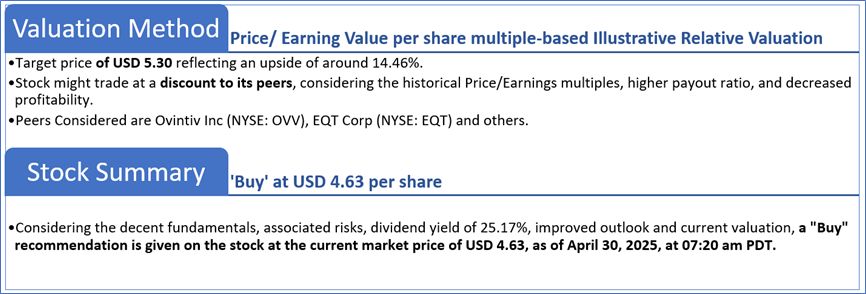
4.2 Fundamental Valuation
Valuation Methodology: Price/Earnings Per Share Multiple Based Relative Valuation
Markets are trading in a highly volatile zone currently due to certain macroeconomic issues and geopolitical tensions prevailing. Therefore, it is prudent to follow a cautious approach while investing.
Note 1: Past performance is not a reliable indicator of future performance.
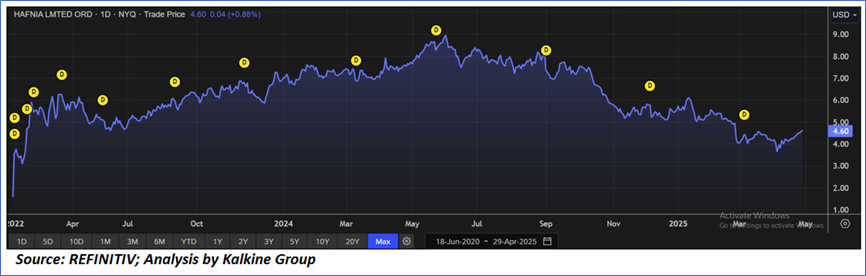
Note 2: The reference date for all price data, currency, technical indicators, support, and resistance levels is April 30, 2025. The reference data in this report has been partly sourced from REFINITIV.
Note 3: Investment decisions should be made depending on an individual's appetite for upside potential, risks, holding duration, and any previous holdings. An 'Exit' from the stock can be considered if the Target Price mentioned as per the Valuation and or the technical levels provided has been achieved and is subject to the factors discussed above.
Note 4: The report publishing date is as per the Pacific Time Zone.
Technical Indicators Defined: -
Support: A level at which the stock prices tend to find support if they are falling, and a downtrend may take a pause backed by demand or buying interest. Support 1 refers to the nearby support level for the stock and if the price breaches the level, then Support 2 may act as the crucial support level for the stock.
Resistance: A level at which the stock prices tend to find resistance when they are rising, and an uptrend may take a pause due to profit booking or selling interest. Resistance 1 refers to the nearby resistance level for the stock and if the price surpasses the level, then Resistance 2 may act as the crucial resistance level for the stock.
Stop-loss: It is a level to protect against further losses in case of unfavorable movement in the stock prices.
Disclaimer This report has been issued by Kalkine New Zealand Limited (FSP691351) (NZBN:9429047678101) (“Kalkine”). Kalkine is a Financial Advice Provider (“FAP”) and is authorised by a Class 1 Financial Advice Provider Licence issued by Financial Markets Authority (“FMA”) to provide financial advice. Kalkine provides only general financial advice through its research reports following a person becoming a member. The reports contain buy/sell/hold and other recommendations in relation to equity securities, managed funds and other managed investment schemes and other financial advice products. The recommendations and opinions in this report and on Kalkine website do not take into account any of your investment objectives, financial situation or needs. Before you make a decision about whether to acquire a financial product, you should obtain the Product Disclosure Statement from the product issuer. You should consider the appropriateness of advice taking into account your own objectives, financial situation and needs and seek independent financial advice before making any financial decisions. If you act on the advice in the research reports, you may have to pay fees, expenses or other amounts (but not to Kalkine). Further information about the complaints and dispute resolution process, as well as information about Kalkine’s duties are available on Kalkine’s website. Please read our Financial Advice Provider (FAP) disclosure statement and Complaints Handling Guide, which are available on the website.
Past performance is not a reliable indicator of future performance.
 Please wait processing your request...