
Section 1: Company Overview and Fundamentals
1.1 Company Overview:
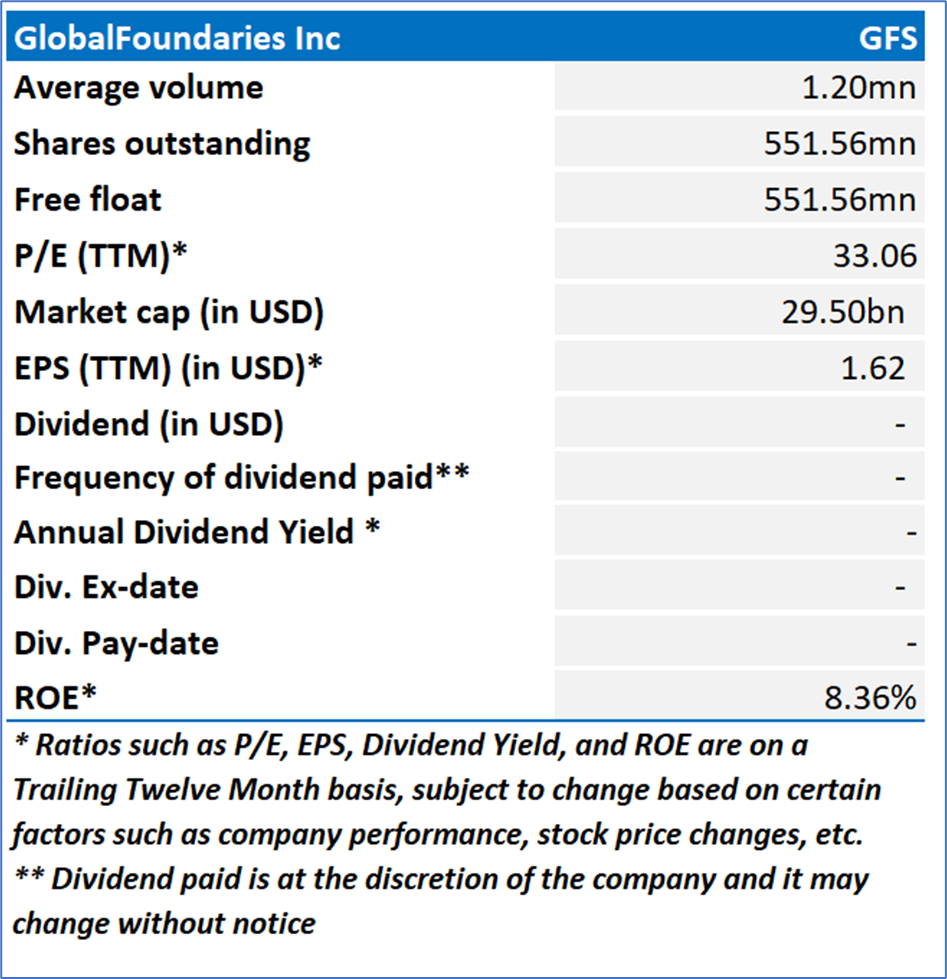
GlobalFoundries Inc. (NASDAQ: GFS) is a semiconductor manufacturer. The Company offers a range of mainstream wafer fabrication services and technologies. It manufactures a range of semiconductor devices, including microprocessors, mobile application processors, baseband processors, network processors, radio frequency modems, microcontrollers, and power management units.
Kalkine’s American Tech Report covers the Company Overview, Key positives & negatives, Investment summary, Key investment metrics, Top 10 shareholding, Business updates and insights into company recent financial results, Key Risks & Outlook, Price performance and technical summary, Target Price, and Recommendation on the stock.
Stock Performance:
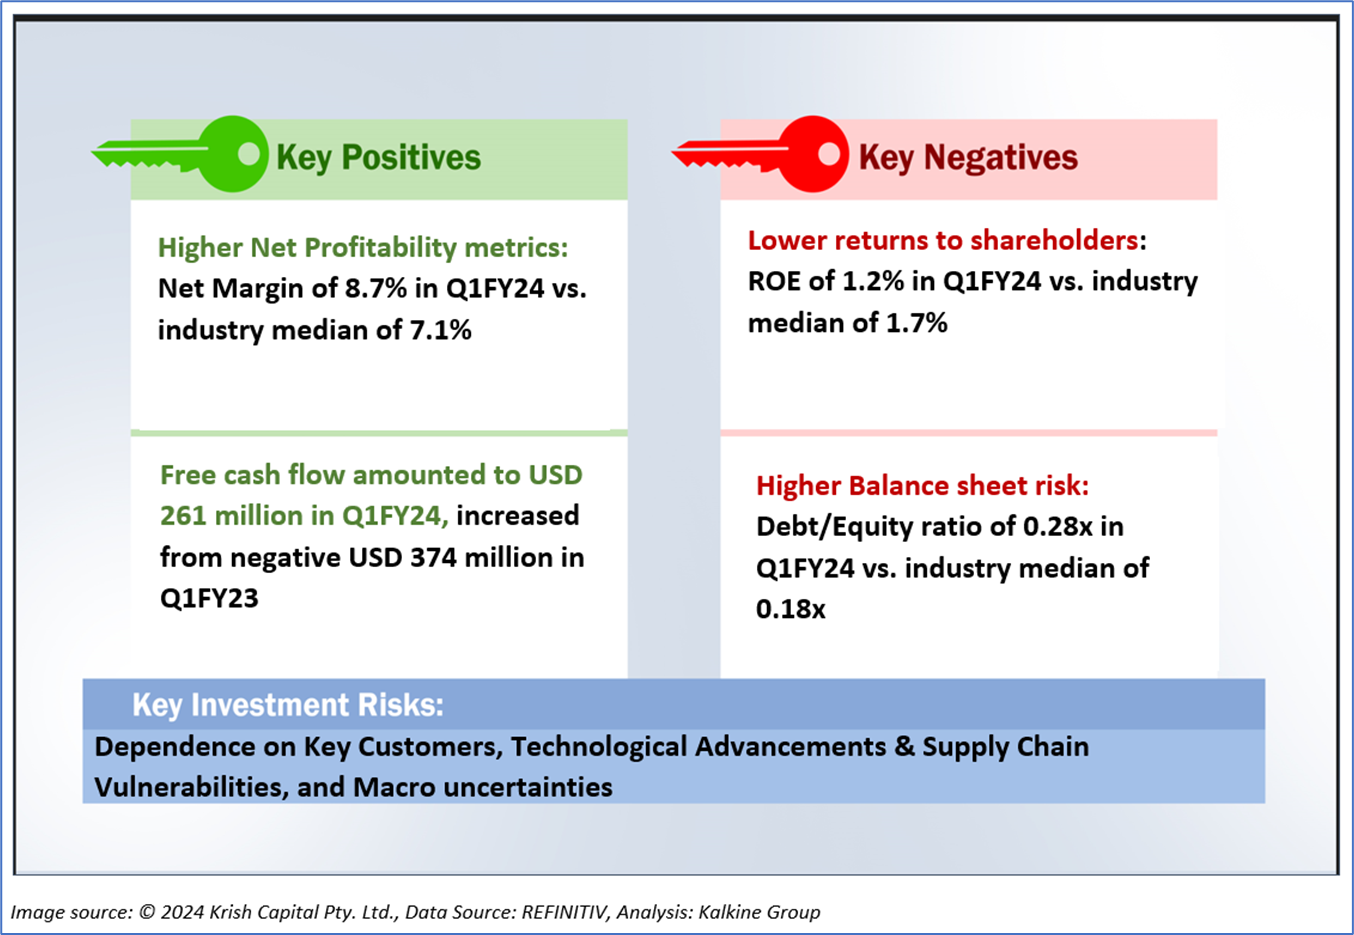
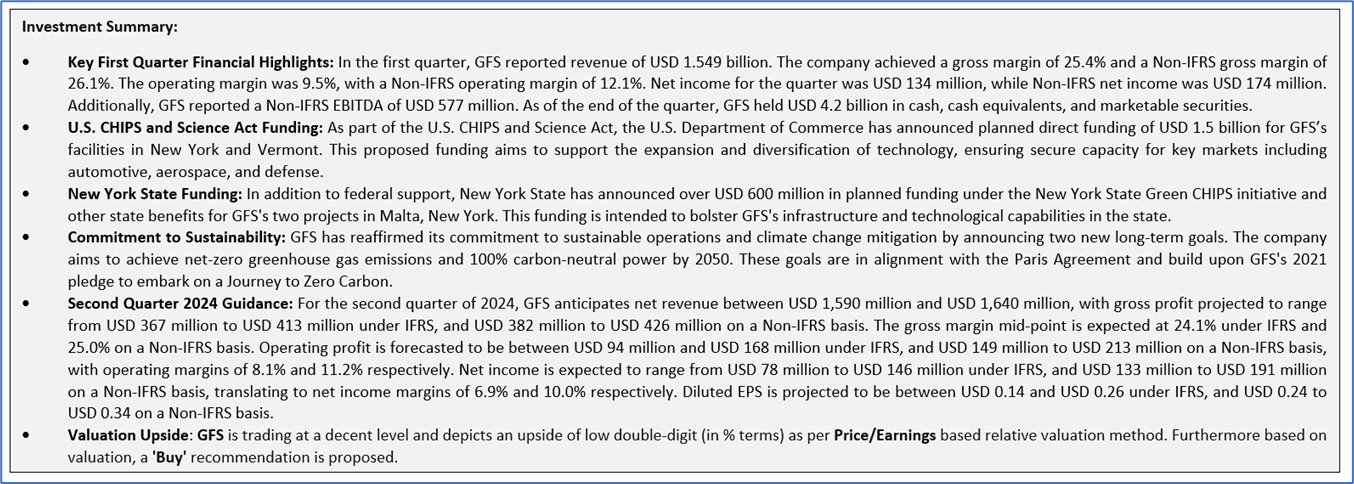
1.2 The Key Positives, Negatives, and Investment summary
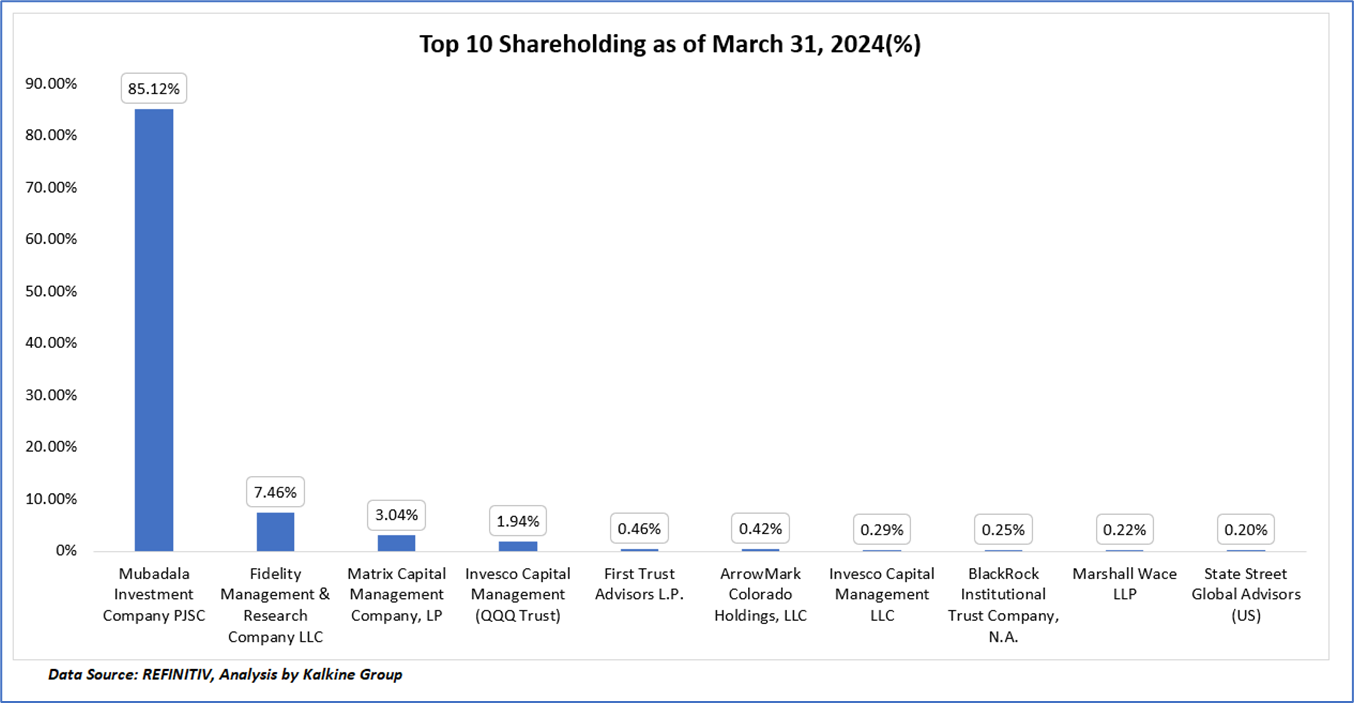
1.3 Top 10 shareholders:
The top 10 shareholders together form ~99.38% of the total shareholding, signifying concentrated shareholding. Mubadala Investment Company PJSC, and Fidelity Management & Research Company LLC, are the biggest shareholders, holding the maximum stake in the company at ~85.12% and ~7.46%, respectively.
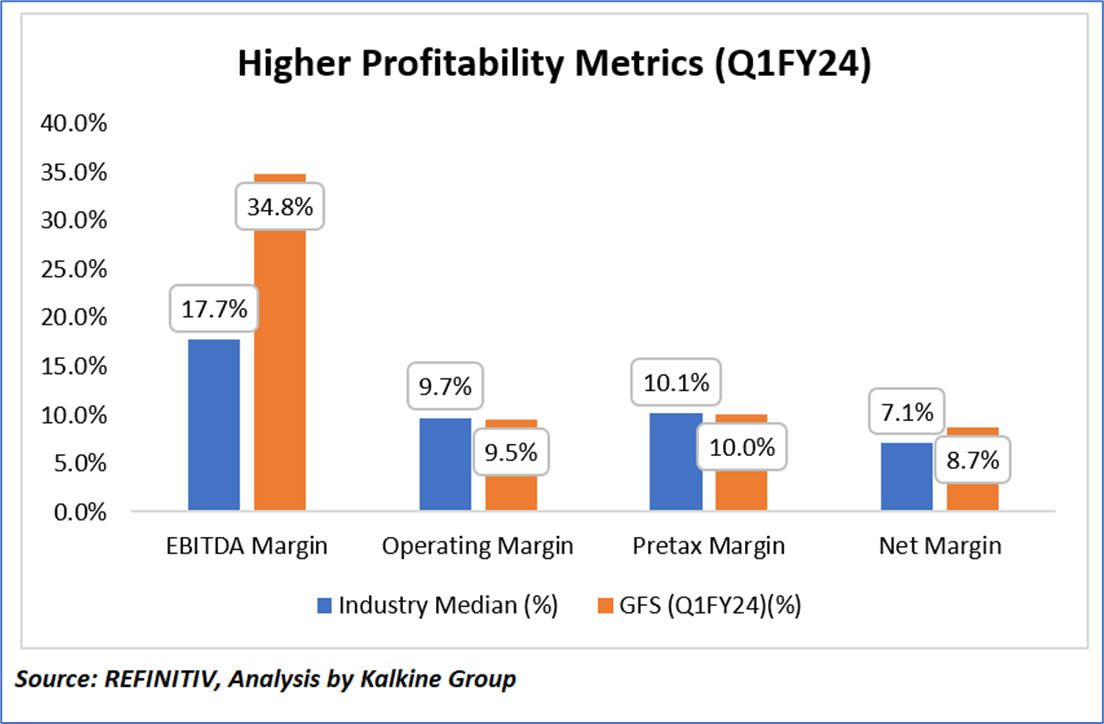
1.4 Key Metrics:
In the first quarter of fiscal year 2024, GlobalFoundries (GFS) demonstrated a strong financial performance compared to the industry median. GFS achieved an EBITDA margin of 34.8%, significantly higher than the industry median of 17.7%, indicating robust operational efficiency and profitability. The company's operating margin was 9.5%, slightly below the industry median of 9.7%, suggesting that while GFS is performing well, it faces similar operational cost pressures as its peers. The pretax margin for GFS stood at 10.0%, marginally under the industry median of 10.1%, reflecting competitive pretax earnings. Lastly, GFS reported a net margin of 8.7%, surpassing the industry median of 7.1%, which underscores its ability to convert revenue into net profit more effectively than many of its competitors. Overall, these figures infer that GFS is managing to outperform industry standards in several key financial metrics, particularly in terms of EBITDA and net margins, despite a competitive operating environment.
Section 2: Business Updates and Corporate Business Highlights
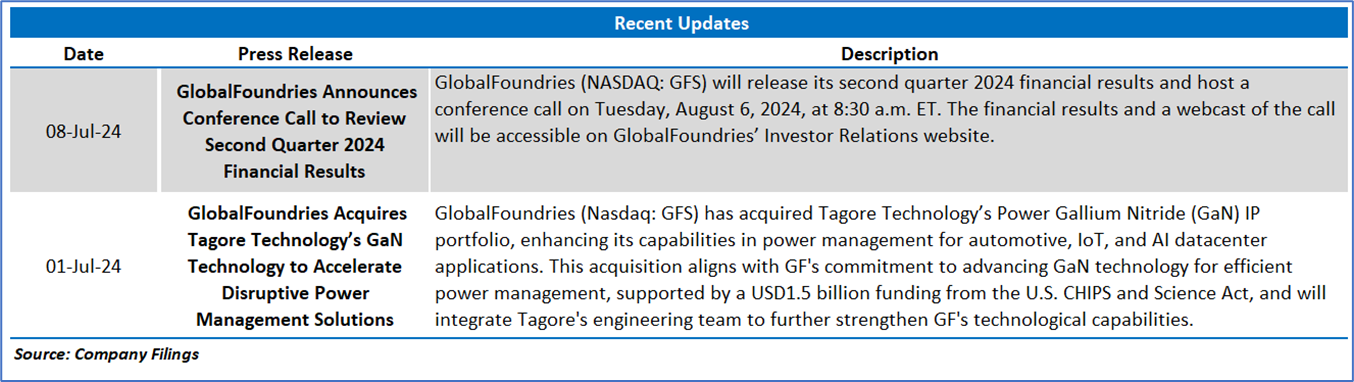
2.1 Recent Updates:
The below picture gives an overview of the recent updates:
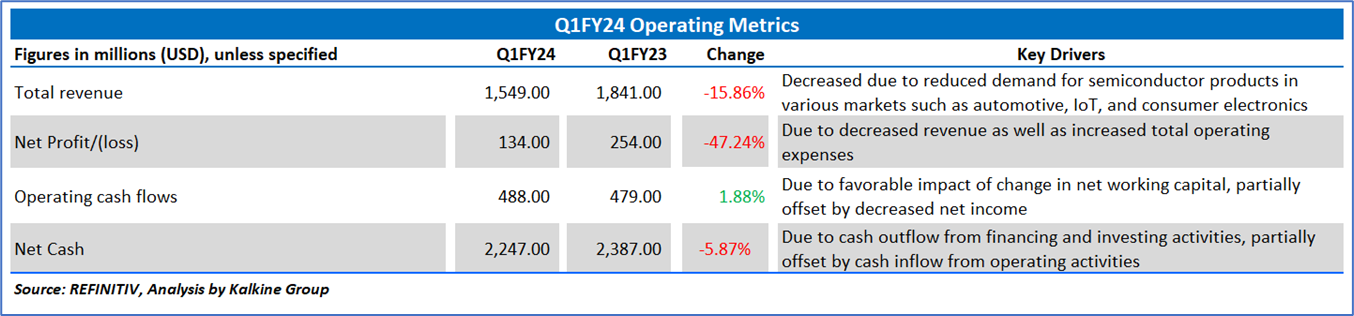
2.2 Insights of Q1FY24:
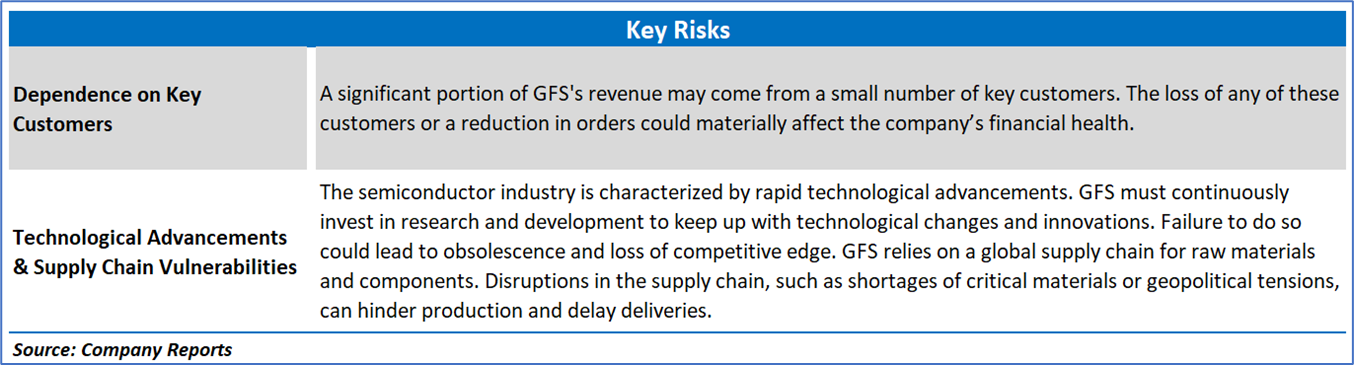
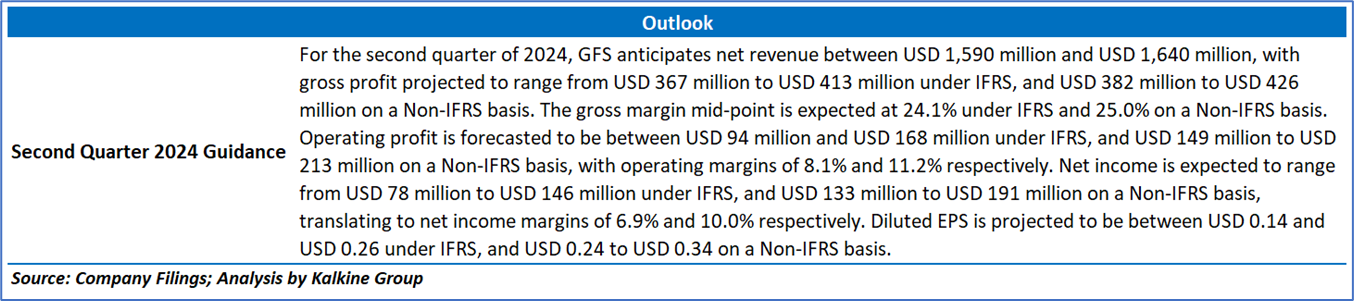
Section 3: Key Risks & Outlook:
Section 4: Stock Recommendation Summary:
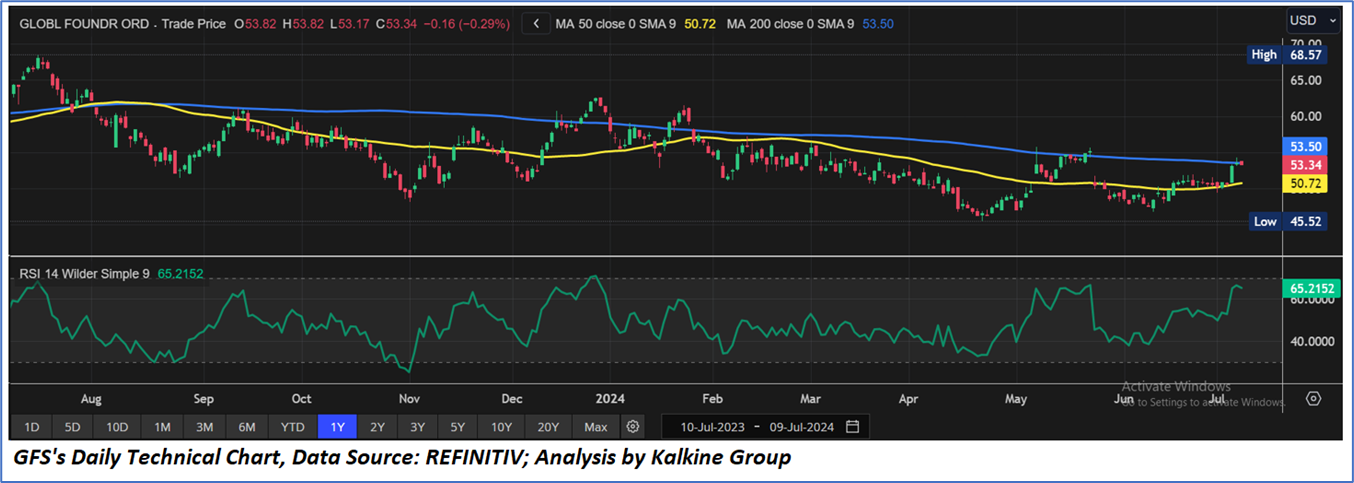
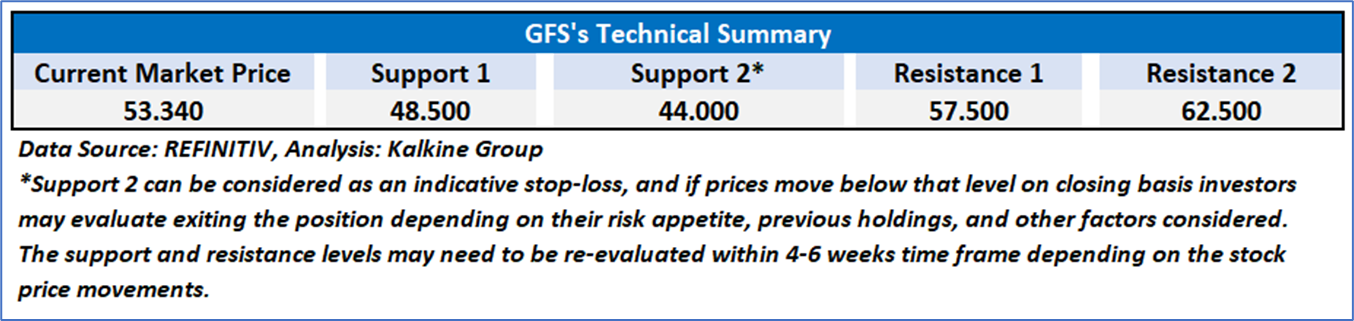
4.1 Price Performance and Technical Summary:
Stock Performance:
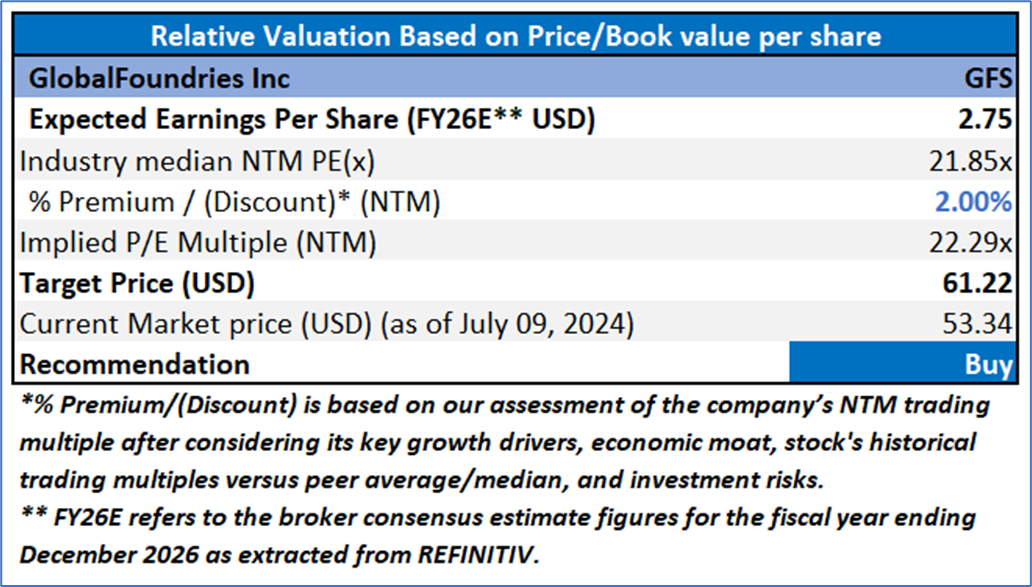
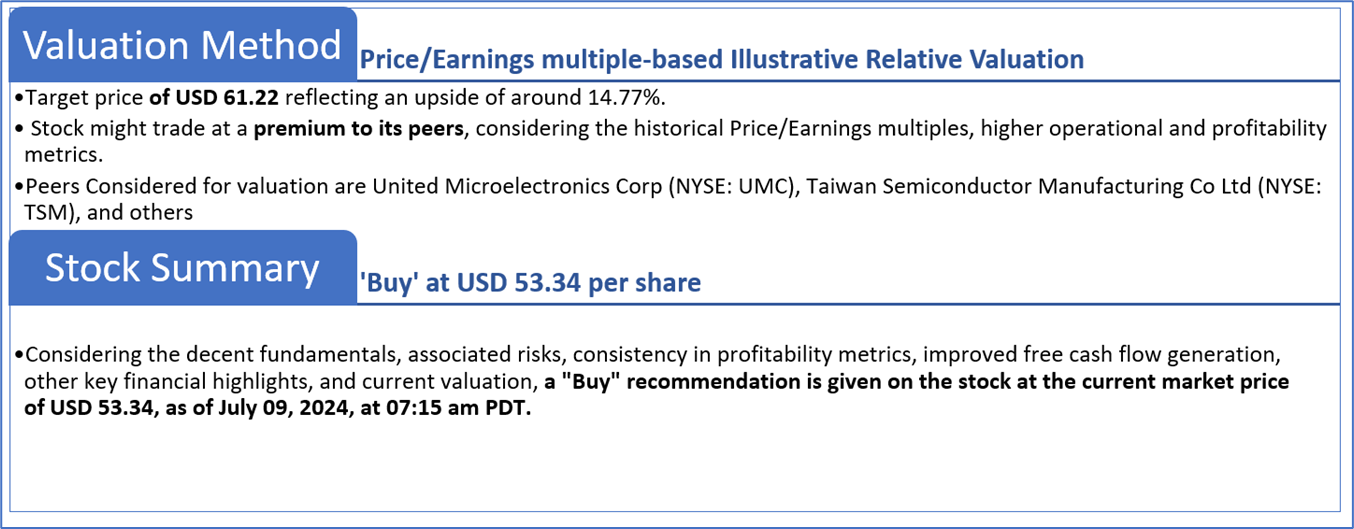
4.2 Fundamental Valuation
Valuation Methodology: Price/Earnings Multiple Based Relative Valuation
Markets are trading in a highly volatile zone currently due to certain macroeconomic issues and geopolitical tensions prevailing. Therefore, it is prudent to follow a cautious approach while investing.
Note 1: Past performance is not a reliable indicator of future performance.
Note 2: The reference date for all price data, currency, technical indicators, support, and resistance levels is July 09, 2024. The reference data in this report has been partly sourced from REFINITIV.
Note 3: Investment decisions should be made depending on an individual's appetite for upside potential, risks, holding duration, and any previous holdings. An 'Exit' from the stock can be considered if the Target Price mentioned as per the Valuation and or the technical levels provided has been achieved and is subject to the factors discussed above.
Note 4: The report publishing date is as per the Pacific Time Zone.
Technical Indicators Defined: -
Support: A level at which the stock prices tend to find support if they are falling, and a downtrend may take a pause backed by demand or buying interest. Support 1 refers to the nearby support level for the stock and if the price breaches the level, then Support 2 may act as the crucial support level for the stock.
Resistance: A level at which the stock prices tend to find resistance when they are rising, and an uptrend may take a pause due to profit booking or selling interest. Resistance 1 refers to the nearby resistance level for the stock and if the price surpasses the level, then Resistance 2 may act as the crucial resistance level for the stock.
Stop-loss: It is a level to protect against further losses in case of unfavorable movement in the stock prices.
Disclaimer This report has been issued by Kalkine New Zealand Limited (FSP691351) (NZBN:9429047678101) (“Kalkine”). Kalkine is a Financial Advice Provider (“FAP”) and is authorised by a Class 1 Financial Advice Provider Licence issued by Financial Markets Authority (“FMA”) to provide financial advice. Kalkine provides only general financial advice through its research reports following a person becoming a member. The reports contain buy/sell/hold and other recommendations in relation to equity securities, managed funds and other managed investment schemes and other financial advice products. The recommendations and opinions in this report and on Kalkine website do not take into account any of your investment objectives, financial situation or needs. Before you make a decision about whether to acquire a financial product, you should obtain the Product Disclosure Statement from the product issuer. You should consider the appropriateness of advice taking into account your own objectives, financial situation and needs and seek independent financial advice before making any financial decisions. If you act on the advice in the research reports, you may have to pay fees, expenses or other amounts (but not to Kalkine). Further information about the complaints and dispute resolution process, as well as information about Kalkine’s duties are available on Kalkine’s website. Please read our Financial Advice Provider (FAP) disclosure statement and Complaints Handling Guide, which are available on the website.
Past performance is not a reliable indicator of future performance.
 Please wait processing your request...