Section 1: Company Overview and Fundamentals
1.1 Company Overview:
Genco Shipping & Trading Limited (NYSE: GNK) is a dry bulk shipping company engaged in the global transport of commodities by sea. It offers comprehensive logistics services through its internally managed commercial operations platform.
Kalkine’s Dividend Income Report covers the Company Overview, Key positives & negatives, Investment summary, Key investment metrics, Top 10 shareholding, Business updates and insights into company recent financial results, Key Risks & Outlook, Price performance and technical summary, Target Price, and Recommendation on the stock.
Price Performance:

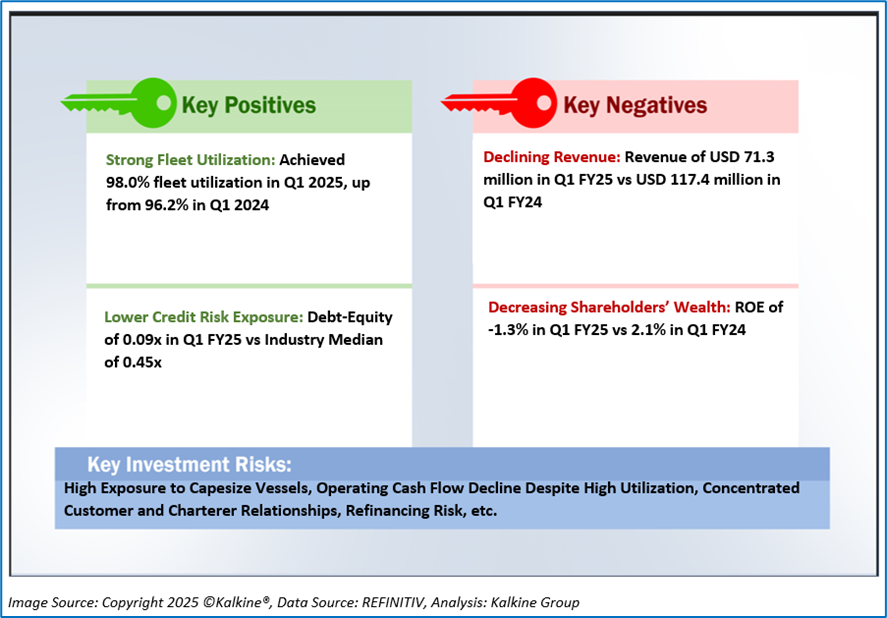
1.2 The Key Positives, Negatives, and Investment summary

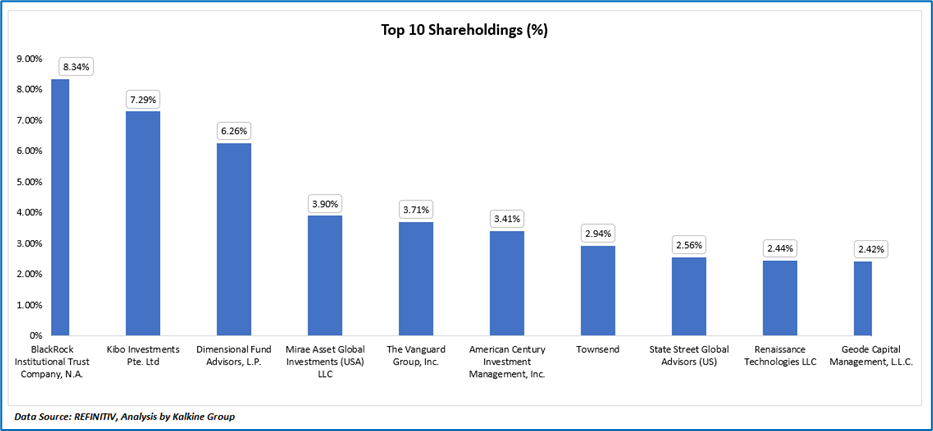
1.3 Top 10 shareholders:
The top 10 shareholders together form ~ 43.25% of the total shareholding, signifying concentrated shareholding. BlackRock Institutional Trust Company, N.A. and Kibo Investments Pte. Ltd are the biggest shareholders, holding the maximum stake in the company at ~8.34% and ~7.29%, respectively.
1.4 Dividend payments with impressive dividend yield:
The dividend distribution for GNK over 5-year period appears consistent and shareholder-friendly, reflecting company's commitment to returning capital. The consistency in dividend payouts throughout the entire period from 2020 to 2025 is notable even during periods of declining share prices, particularly from mid-2022 onwards, when the stock began trending lower. The dividends were highest during 2022 and early 2023, coinciding with the stock’s peak prices and likely supported by strong earnings from favorable dry bulk shipping rates. While the share price has since declined, the company maintained its dividend payout rhythm, suggesting a disciplined capital return policy and a potentially strong balance sheet. This approach may appeal to income-focused investors but also raises questions about sustainability if earnings remain under pressure in a weaker freight market.

1.5 Key Metrics
The chart illustrates a steady decline in both revenue and net income from Q1 FY24 to Q1 FY25, with revenue falling from USD 117.4 million to USD 71.3 million, a 39% drop because of lower time charter equivalent (TCE) rates and a reduced operating fleet, Genco faced weaker market conditions in the drybulk sector during the first quarter of 2025. On the other hand, net income turned from a profit of USD 18.8 million in Q1 FY24 to a net loss of USD 11.9 million in Q1 FY25. While the company maintained positive earnings throughout FY24, profitability consistently weakened each quarter, culminating in a sharp downturn in Q1 FY25, attributed to reducing voyage revenues, increased operating costs per vessel, and a softer freight market environment adversely affected Genco’s margins and overall profitability.

Section 2: Business Updates and Financial Highlights
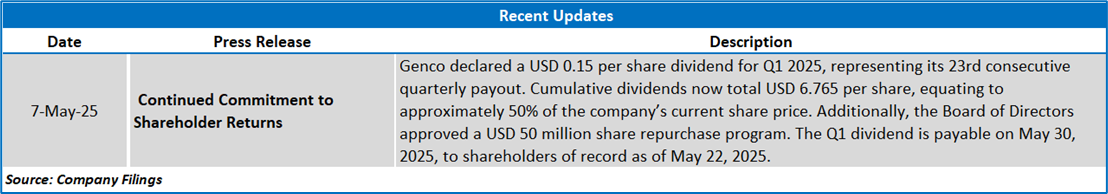
2.1 Recent Updates:
The below picture gives an overview of the recent updates:
2.2 Insights of Q1 FY25:

Section 3: Key Risks and Outlook:


Section 4: Stock Recommendation Summary:
4.1 Technical Summary:
Price Performance:


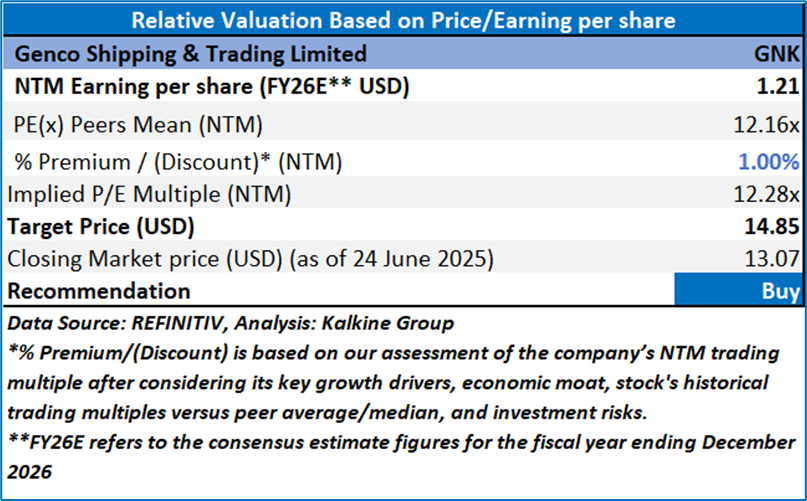
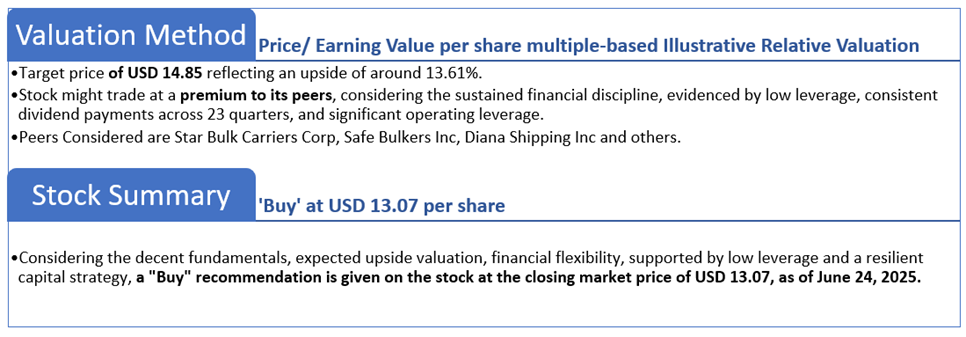
4.2 Fundamental Valuation
Valuation Methodology: Price/Earnings Per Share Multiple Based Relative Valuation
Markets are trading in a highly volatile zone currently due to certain macroeconomic issues and geopolitical tensions prevailing. Therefore, it is prudent to follow a cautious approach while investing.
Note 1: Past performance is not a reliable indicator of future performance.
Note 2: The reference date for all price data, currency, technical indicators, support, and resistance levels is June 24, 2025. The reference data in this report has been partly sourced from REFINITIV.
Note 3: Investment decisions should be made depending on an individual's appetite for upside potential, risks, holding duration, and any previous holdings. An 'Exit' from the stock can be considered if the Target Price mentioned as per the Valuation and or the technical levels provided has been achieved and is subject to the factors discussed above.
Note 4: The report publishing date is as per the Pacific Time Zone.
Technical Indicators Defined: -
Support: A level at which the stock prices tend to find support if they are falling, and a downtrend may take a pause backed by demand or buying interest. Support 1 refers to the nearby support level for the stock and if the price breaches the level, then Support 2 may act as the crucial support level for the stock.
Resistance: A level at which the stock prices tend to find resistance when they are rising, and an uptrend may take a pause due to profit booking or selling interest. Resistance 1 refers to the nearby resistance level for the stock and if the price surpasses the level, then Resistance 2 may act as the crucial resistance level for the stock.
Stop-loss: It is a level to protect against further losses in case of unfavorable movement in the stock prices.
Disclaimer This report has been issued by Kalkine New Zealand Limited (FSP691351) (NZBN:9429047678101) (“Kalkine”). Kalkine is a Financial Advice Provider (“FAP”) and is authorised by a Class 1 Financial Advice Provider Licence issued by Financial Markets Authority (“FMA”) to provide financial advice. Kalkine provides only general financial advice through its research reports following a person becoming a member. The reports contain buy/sell/hold and other recommendations in relation to equity securities, managed funds and other managed investment schemes and other financial advice products. The recommendations and opinions in this report and on Kalkine website do not take into account any of your investment objectives, financial situation or needs. Before you make a decision about whether to acquire a financial product, you should obtain the Product Disclosure Statement from the product issuer. You should consider the appropriateness of advice taking into account your own objectives, financial situation and needs and seek independent financial advice before making any financial decisions. If you act on the advice in the research reports, you may have to pay fees, expenses or other amounts (but not to Kalkine). Further information about the complaints and dispute resolution process, as well as information about Kalkine’s duties are available on Kalkine’s website. Please read our Financial Advice Provider (FAP) disclosure statement and Complaints Handling Guide, which are available on the website.
Past performance is not a reliable indicator of future performance.
 Please wait processing your request...