
Section 1: Company Overview and Fundamentals
1.1 Company Overview:
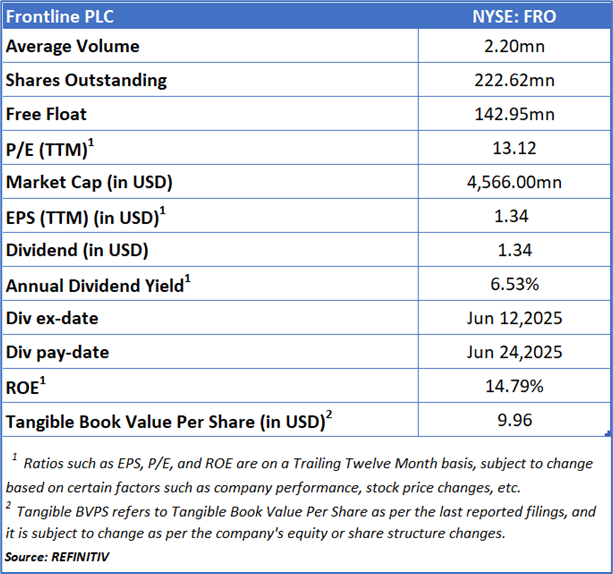
Frontline PLC (NYSE: FRO) headquartered in Cyprus, operates within the global transportation industry, specializing in the maritime shipment of crude oil and refined petroleum products. The company manages an international fleet comprising VLCCs, Suezmax, and LR2/Aframax tankers, which are primarily used for the seaborne transport of oil and related cargo across global trade routes.
Kalkine’s Dividend Income Report covers the Company Overview, Key positives & negatives, Investment summary, Key investment metrics, Top 10 shareholding, Business updates and insights into company recent financial results, Key Risks & Outlook, Price performance and technical summary, Target Price, and Recommendation on the stock.
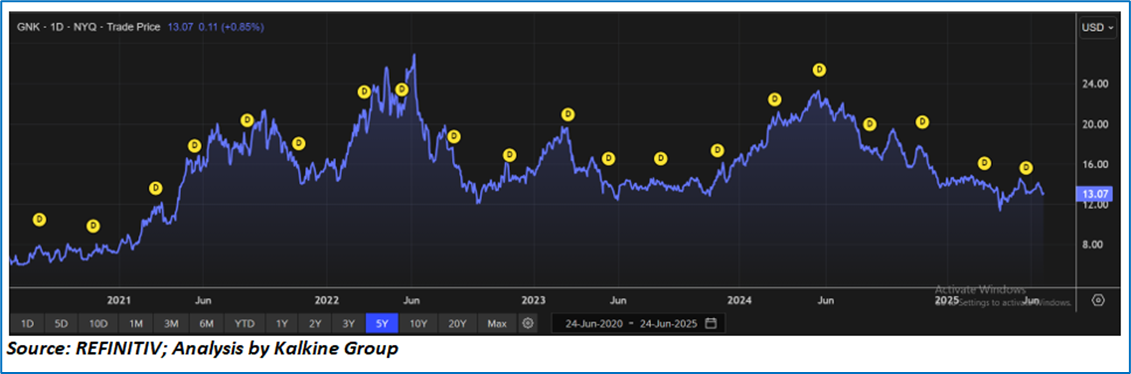
Price Performance:
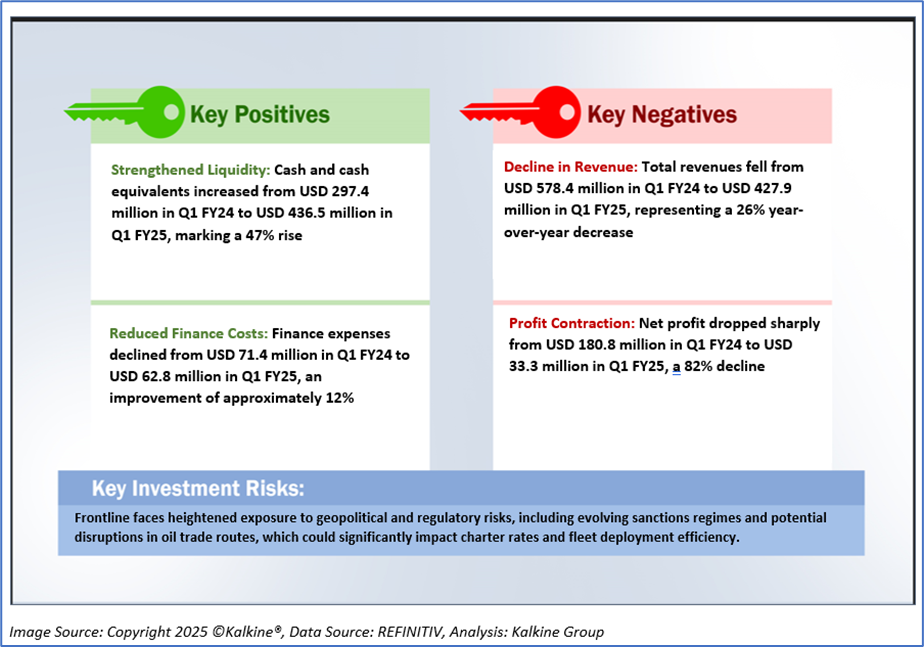
1.2 The Key Positives, Negatives, and Investment summary
1.3 Top 10 shareholders:
The top 10 shareholders together form ~ 52.44% of the total shareholding, signifying concentrated shareholding. Hemen Holding Limited and Folketrygdfondet are the biggest shareholders, holding the maximum stake in the company at ~35.55% and ~5.55%, respectively.

1.4 Dividend payments with impressive dividend yield:
Over the past five years, Frontline PLC has maintained a consistent quarterly dividend distribution pattern, with 20 dividends paid between 2020 and 2025. The stock has offered a notably high dividend yield, often ranging between 7% and 12% depending on market conditions. At price peaks, such as in mid-2023 when the stock traded around USD 25, the estimated annualized yield was approximately 11.2%, while during troughs like early 2024 at around USD 16, the yield still held around 7.5%. As of August 2025, with the stock price at USD 20.51 and assuming a quarterly dividend of USD 0.50, the forward dividend yield stands close to 9.8%, reinforcing Frontline’s appeal as a high-yield income stock throughout fluctuating market cycles.
1.5 Key Metrics
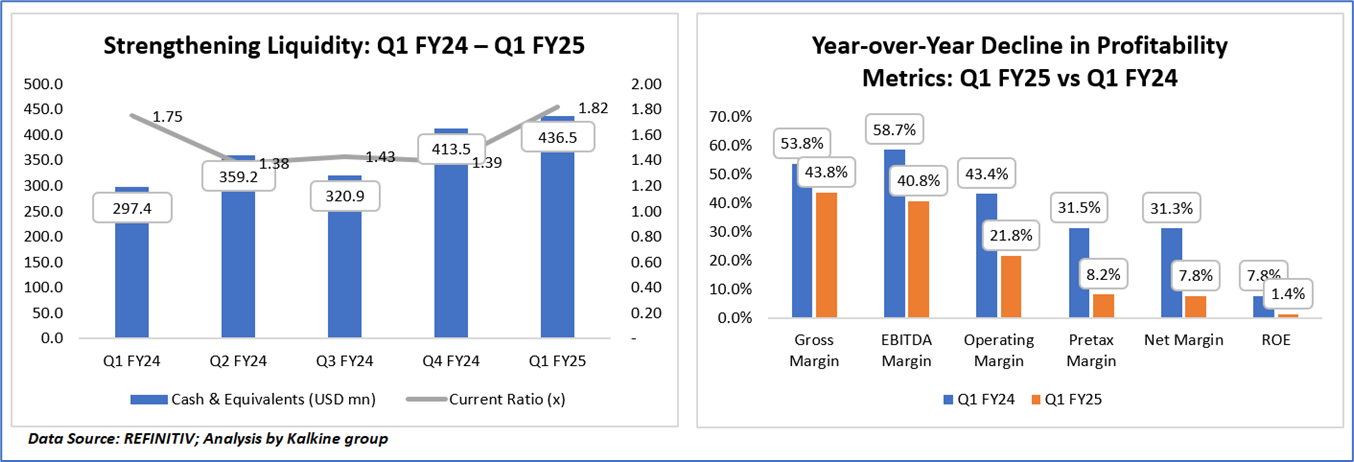
In Q1 FY25, Frontline Plc experienced a notable decline across all key profitability metrics compared to Q1 FY24. The drop in gross, EBITDA, operating, pretax, and net margins was primarily driven by weaker TCE rates, reduced voyage income, and lower overall revenue. Despite maintaining cost discipline, fixed operating expenses weighed more heavily on profitability due to a smaller revenue base. Additionally, losses on derivatives and marketable securities, along with muted charter activity, further compressed margins. As a result, return on equity also fell significantly, reflecting the sharp decline in net income and reduced shareholder returns.
Despite declining profitability, Frontline PLC illustrates a steady improvement in Frontline Plc’s liquidity over five quarters, with cash and equivalents rising from USD 297.4 million in Q1 FY24 to USD 436.5 million in Q1 FY25. Despite some fluctuations mid-year, strategic refinancing and disciplined cash management helped the current ratio increase significantly to 1.82x by Q1 FY25. This reflects the company's stronger short-term solvency and enhanced financial flexibility, supported by reduced near-term debt obligations and consistent operating cash flow.
Section 2: Business Updates and Financial Highlights
2.1 Recent Updates:
The below picture gives an overview of the recent updates:

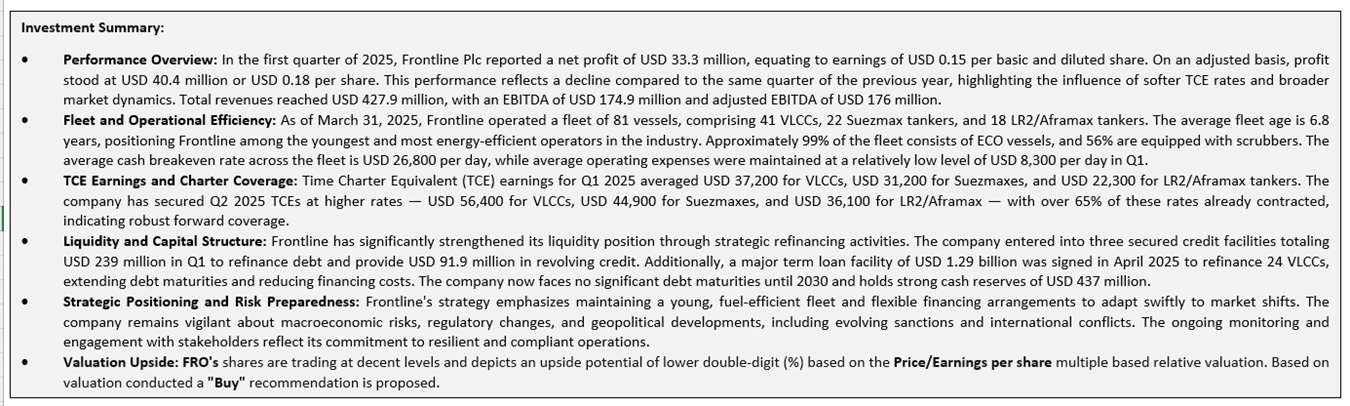
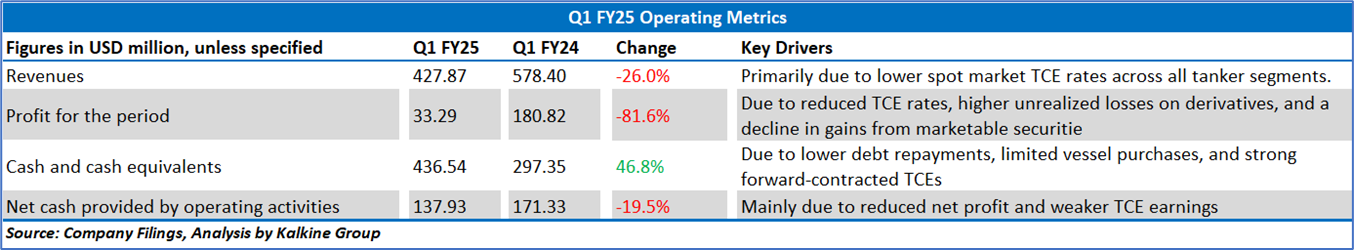
2.2 Insights of Q1 FY25:
Section 3: Key Risks and Outlook:

Section 4: Stock Recommendation Summary:
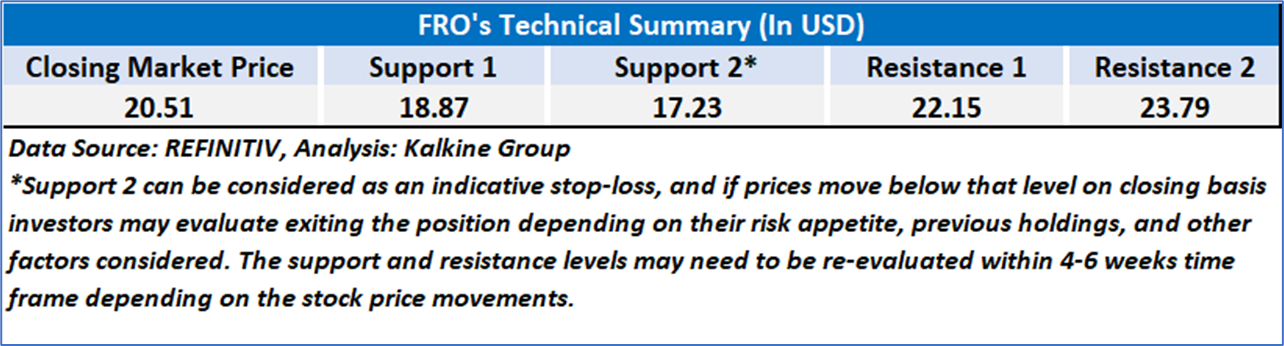
4.1 Technical Summary:
Price Performance:

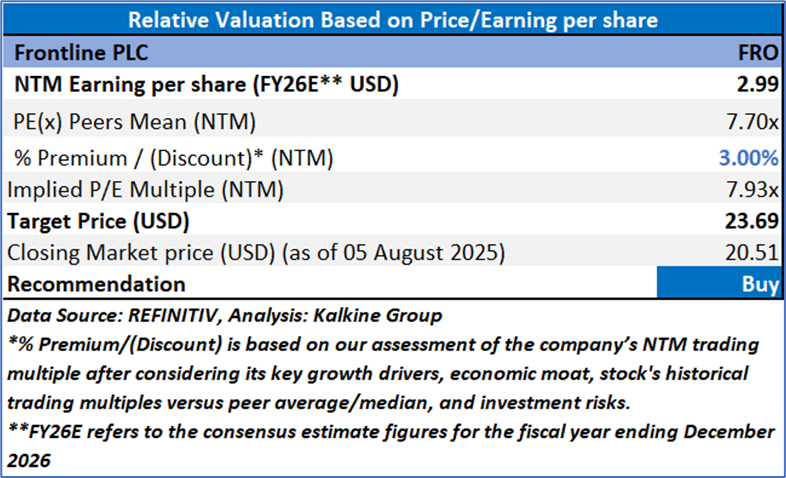
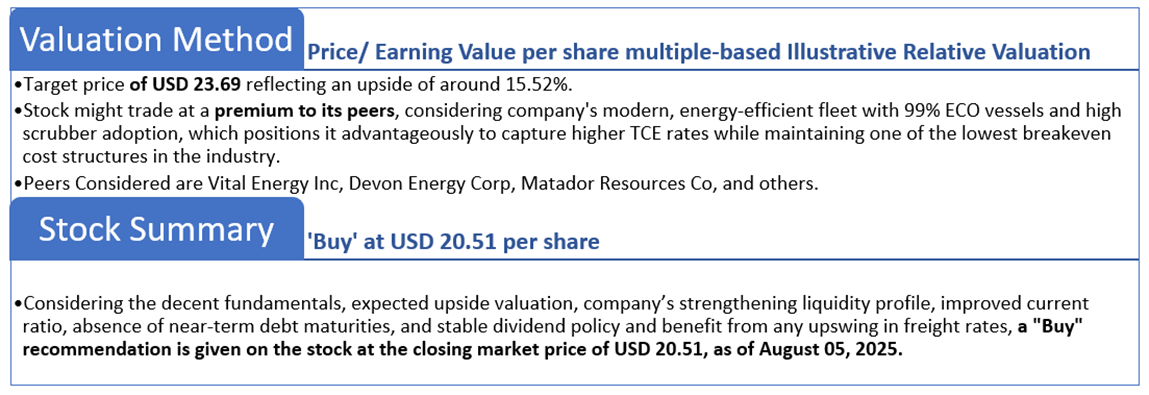
4.2 Fundamental Valuation
Valuation Methodology: Price/Earnings Per Share Multiple Based Relative Valuation
Markets are trading in a highly volatile zone currently due to certain macroeconomic issues and geopolitical tensions prevailing. Therefore, it is prudent to follow a cautious approach while investing.
Note 1: Past performance is not a reliable indicator of future performance.
Note 2: The reference date for all price data, currency, technical indicators, support, and resistance levels is August 05, 2024. The reference data in this report has been partly sourced from REFINITIV.
Note 3: Investment decisions should be made depending on an individual's appetite for upside potential, risks, holding duration, and any previous holdings. An 'Exit' from the stock can be considered if the Target Price mentioned as per the Valuation and or the technical levels provided has been achieved and is subject to the factors discussed above.
Note 4: The report publishing date is as per the Pacific Time Zone.
Technical Indicators Defined: -
Support: A level at which the stock prices tend to find support if they are falling, and a downtrend may take a pause backed by demand or buying interest. Support 1 refers to the nearby support level for the stock and if the price breaches the level, then Support 2 may act as the crucial support level for the stock.
Resistance: A level at which the stock prices tend to find resistance when they are rising, and an uptrend may take a pause due to profit booking or selling interest. Resistance 1 refers to the nearby resistance level for the stock and if the price surpasses the level, then Resistance 2 may act as the crucial resistance level for the stock.
Stop-loss: It is a level to protect against further losses in case of unfavorable movement in the stock prices.
Disclaimer This report has been issued by Kalkine New Zealand Limited (FSP691351) (NZBN:9429047678101) (“Kalkine”). Kalkine is a Financial Advice Provider (“FAP”) and is authorised by a Class 1 Financial Advice Provider Licence issued by Financial Markets Authority (“FMA”) to provide financial advice. Kalkine provides only general financial advice through its research reports following a person becoming a member. The reports contain buy/sell/hold and other recommendations in relation to equity securities, managed funds and other managed investment schemes and other financial advice products. The recommendations and opinions in this report and on Kalkine website do not take into account any of your investment objectives, financial situation or needs. Before you make a decision about whether to acquire a financial product, you should obtain the Product Disclosure Statement from the product issuer. You should consider the appropriateness of advice taking into account your own objectives, financial situation and needs and seek independent financial advice before making any financial decisions. If you act on the advice in the research reports, you may have to pay fees, expenses or other amounts (but not to Kalkine). Further information about the complaints and dispute resolution process, as well as information about Kalkine’s duties are available on Kalkine’s website. Please read our Financial Advice Provider (FAP) disclosure statement and Complaints Handling Guide, which are available on the website.
Past performance is not a reliable indicator of future performance.
 Please wait processing your request...