
Company Overview: Fletcher Building Limited is a holding company. The Company is involved in the manufacturing and distribution of building materials, and residential and commercial construction. Its segments include Building Products, International, Distribution, Residential and Land Development, and Construction. The Building Products segment is a manufacturer, distributor and marketer of building products used both commercially and in residential markets. The International segment includes laminates and panels businesses that manufacture and distribute decorative surface laminates. The Distribution segment consists of building, plumbing, pipeline and steel distribution businesses in Australia and New Zealand. The Residential and Land Development segment develops land holdings for both residential and commercial use, and is a residential home builder. The Construction segment includes Fletcher Construction, a general contractor in New Zealand and the South Pacific.
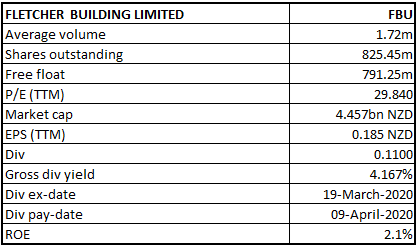
FBU Details
FY20 Performance Weighted Towards Second Half Earnings: Dual-listed company, Fletcher Building Limited (NZX: FBU) is engaged predominantly in manufacturing and distribution of building materials, and residential and commercial construction in Australia and New Zealand. The company operates in various divisions, including Building Products, Construction, Infrastructure Products, Distribution, and Laminates & Panels. It's New Zealand core businesses outside of Steel delivered a decent performance in the first half of FY20, with improved operating margins in several areas and earnings in line to the last year. In Steel, trading conditions remain challenging though the company has witnessed improvement in volumes and margins as it enters the second half. Residential house sales have been benefiting from strong demand. Moreover, construction has secured new work in target areas, with no change to the legacy project provisions. In Australian market, the company is witnessing benefits of the cost out programme. Moreover, it has assessed its portfolio and decided to divest the Rocla business and it is now focused on driving growth and operational performance in its other Australian businesses. The sale process is expected to complete within calendar year 2020.
Moving forward, decent liquidity levels and strong balance sheet are expected to help the overall company in achieving long-term growth objectives.
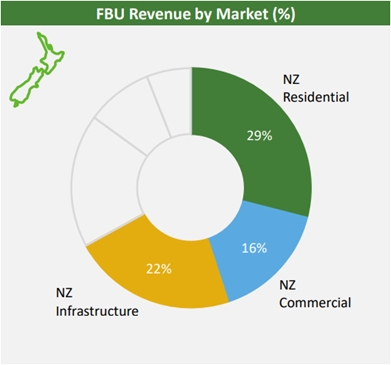
Data on Revenue from NZ Market (Source: Company Reports)
Top 10 Shareholders: The top 10 shareholders have been highlighted in the table, which together form around 41.94% of the total shareholding. Perpetual Investment Management Limited and Schroder Investment Management (Australia) Ltd. hold maximum interests in the company at 9.99% and 6.46%, respectively.
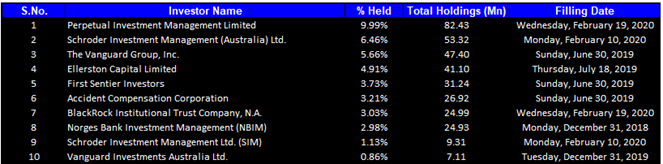
Top 10 Shareholders (Source: Thomson Reuters)
A Quick Look at Key Metrics: Its gross margin, EBITDA margin and net margin for H1FY20 stood at 27.8%, 10.0% and 2.2%, better than the H1FY19 results of 27.3%, 7.7% and 2.0%, respectively, implying improvement in the company fundamentals. Its current ratio for H1FY20 stood at 1.93x, better than the industry median of 1.28x, which implies that the company is in a good position to address its short-term obligations. Moreover, decent liquidity position might help the company to make deployments towards strategic growth objectives which could help in gaining traction among the market players.
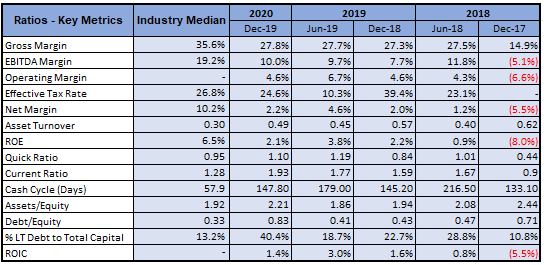
Key Metrics (Source: Thomson Reuters)
H1FY20 Key Highlights for The Period Ended December 31, 2019: Group revenue for the period was reported at $3,961 million, in line with market conditions. The decrease of 5% in revenue can be attributed to reduced revenue on legacy construction projects and tougher market conditions in Australia. The Building Products division reported gross revenue of $645 million for the period, a decline of 4% than previous year. The company stated that revenue performance in the division was mixed. The businesses primarily selling into residential finishing trades (Winstone Wallboards, Tasman Insulation, Laminex) have performed well. In the pipes (Iplex, Humes) and steel businesses, gross revenue declined by a total of $27 million due to a softening of civil, infrastructure and early trade work, combined with challenging trading conditions in the steel sector.
The company’s reported EBIT before significant items for the period stood at $219 million, as compared to $248 million in the previous corresponding period. Trading cashflow from continuing operations (excluding legacy projects) increased from $36 million in H1FY19 to $88 million in H1FY20, due to continued focus as well as drive on improving the working capital. In September 2019, the company began with on-market share buyback of up to NZ$300 million to deliver value to shareholders. It made a good progress and, as at 31st December 2019, acquired 27.9 million shares for $141 million, representing 3.3% of issued capital. The Board has declared an interim dividend of 11 cents per share with payment date on April 9, 2020.
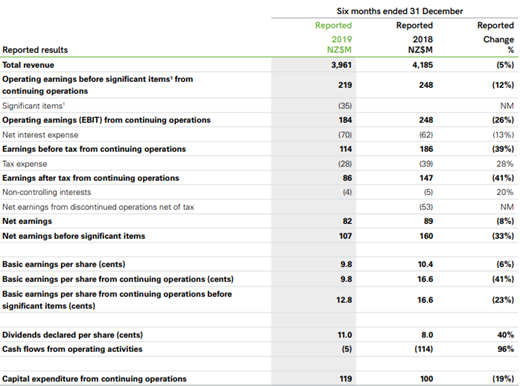
H1FY20 Income Statement (Source: Company Reports)
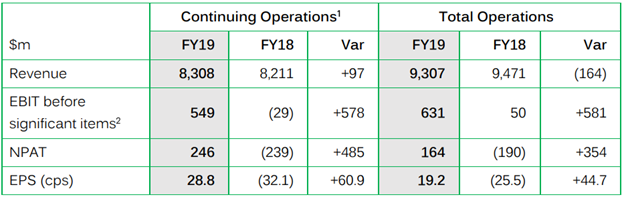
FY19 Key Highlights for The Period Ended June 30, 2019: Revenue from continuing operations for the period improved by 1.2% to $8,308 million. In New Zealand, FBU’s core building products and distributions businesses delivered good results, maintaining strong market positions and revenues despite operating in a highly competitive environment. In Australia, the performance reflected difficult market conditions. However, it was added that turnaround plans are underway to reset the businesses and deliver growth in FY 2020. Net Profit After Tax for the period was reported at $164 million, as compared to loss of $190 million in previous year. Total EBIT before significant items for the period was reported at $631 million, within the company’s earnings guidance range and compared to $50 million in the previous year.
During the period, sale of international businesses Roof Tile Group and Formica were completed ahead of schedule and the proceeds received were above expectations. The sale of Formica for the consideration of NZ$1.2 billion strengthened the company’s balance sheet.
FY19 Key Metrics (Source: Company Reports)
What to Expect: As per the release, group EBIT (excluding significant items) for FY20 has been anticipated in the range of $515 million to $565 million with earnings weighted towards the second half of financial year 2020, owing to the Australian cost out programme benefit, residential settlements and improved steel performance flowing through.
New Zealand Market FY20 Outlook: NZ residential is expected to be similar to the first half, and civil expected to trend slightly lower. Residential activity levels seem to be steady year-on-year, with consents growth weighted to multi-unit dwellings (smaller floor area, typology mix change), standalone housing flat on total floor area basis, and new subdivision trending slightly lower. With respect to Infrastructure, there is robust long term outlook helped by $12 billion government infrastructure package.
Australia Market FY20 Outlook: With respect to Residential, it was added that there are expectations of around 150-160k approvals in FY 2020 (i.e. down 20% YoY). However, recovery from FY 2021 is expected. Coming to the Infrastructure, it was added that activity is weak with respect to key sectors, especially water and roading. However, there has been government commitment of $100 billion spend over the span of next ten years.
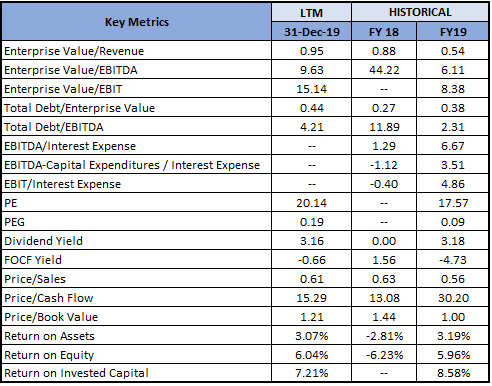
Key Valuation Metrics (Source: Thomson Reuters)
Valuation Methodology: EV/Sales multiple Based Relative Valuation
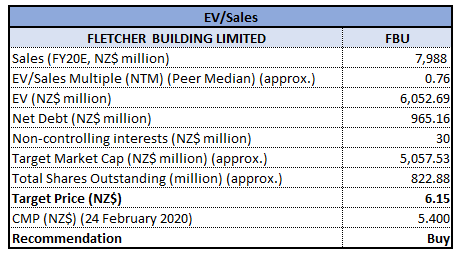
EV/Sales multiple Based Relative Valuation (Source: Thomson Reuters)
Note: All forecasted figures and peers have been taken from Thomson Reuters, NTM-Next Twelve Months
Technical Analysis:
Monthly Chart:
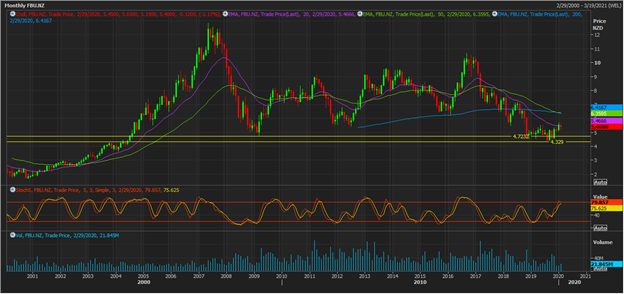
(Source: Thomson Reuters)
Weekly Chart:
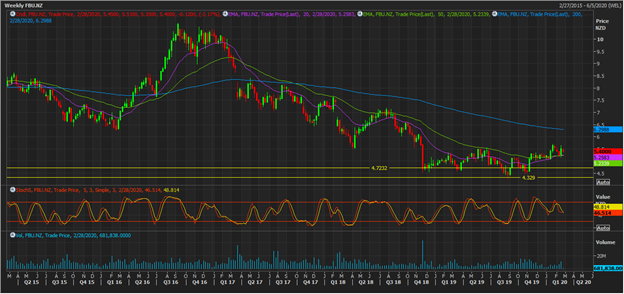
(Source: Thomson Reuters)
On both the charts, the stock has rebound from a strong support zone of $4.329-$4.7232, indicating probability for a trend reversal. 20 EMA can be seen crossing 50 EMA from below on weekly timeframe chart, suggesting buying pressure on the stock. The stock may test resistance level at around 200 EMA, break-on which a fresh upside rally can be observed.
Note: EMA – Exponential Moving Average
Stock Recommendation: The company has been making investments in innovation and local manufacturing to drive long-term, sustainable growth for its shareholders. The company’s balance sheet is robust, and its leverage ratio is below the bottom end of the target range. The company key personnel has stated that there has been significant improvement in the earnings and the cash flows were strong at the end of FY 2019. Resultantly, the Board approved a final dividend for the year amounting to 15 cents per share (unimputed and unfranked). When combined with 8 cents per share of interim dividend, the total dividend stood at 23 cents per share for FY19.
Considering the company’s business model, H1FY20 performance, decent margins, FY20 guidance, we have valued the stock using a relative valuation method, i.e., EV/Sales Multiple, and arrived at a target price of lower double-digit growth (in % terms). Hence, we give a “Buy” recommendation on the stock at the current market price of $5.400, down by 2.17% on February 24, 2020.
.png)
FBU Daily Technical Chart (Source: Thomson Reuters)
Disclaimer
Kalkine New Zealand Limited is authorised to provide class advice only. The information on this site does not take into account any of your investment objectives, financial situation or needs. Before you make a decision about whether to acquire a financial product, you should obtain the Product Disclosure Statement from the product issuer. You should consider the appropriateness of advice taking into account your own objectives, financial situation and needs and seek independent financial advice before making any financial decisions.
Past performance is not a reliable indicator of future performance.
 Please wait processing your request...