
Company Overview: Fletcher Building Limited (NZX: FBU) is involved in the manufacturing and distribution of building materials and residential, and commercial constructions. It is dual-listed on NZX and ASX and operates through six divisions – Building Products, Distribution, Concrete, Residential and Development, Construction, and Australia. The company is the major investor in local manufacturing in NZ. In Australia, the company has significant operations in the manufacture and distribution of building products.
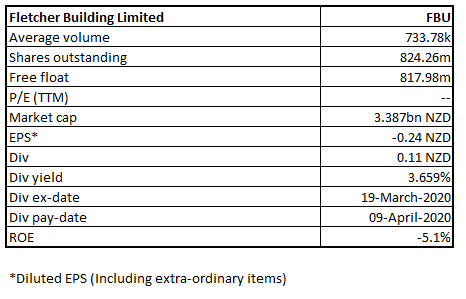
FBU Details
Provider of Building Solutions: Fletcher Building Limited (NZX: FBU) deals in building products and construction materials and services. It operates across Australia, Asia, the Americas, Europe, and the South Pacific. It is dual-listed on NZX and ASX. The company has a market capitalization of ~$3.387 billion as on 2nd November 2020.
Results Performance (Year Ended 30th June 2020)
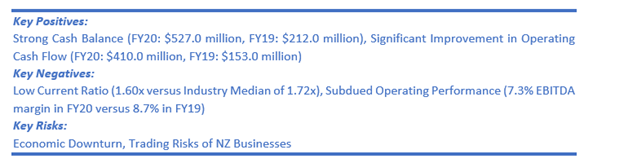
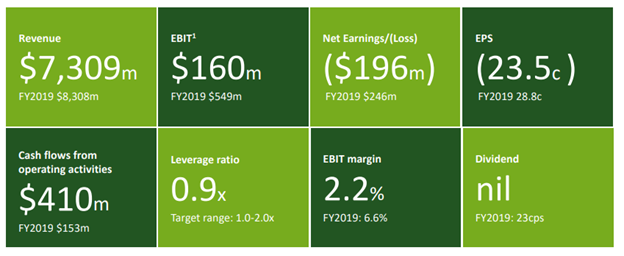
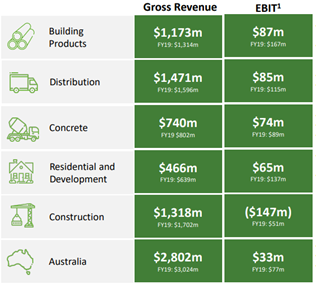
The company’s total revenue for the full-year period was reported at $7,309 million, a decline of 21% (y-o-y). EBIT before significant items for the period stood at $160 million. Net Loss After Tax for the period stood at $196 million, as compared to a profit of $164 million in FY19. Its net debt at the end of the period stood at $497 million, with a liquidity position of $1.6 billion. The lockdown in New Zealand and Australia had a significant impact on the earnings of the company. The Board of Directors has canceled the interim dividend and has not declared a final dividend for FY20.
Income Statement (Source: Company Reports)
Divisional Performance in FY20:
Key Data (Source: Company Reports)
Top 10 Shareholders: The top 10 shareholders have been highlighted in the table, which together forms around 42.19% of the total shareholding. Perpetual Investment Management Limited and Schroder Investment Management (Australia) Ltd. are holding maximum stake in the company at 9.97% and 6.47%, respectively, as shown in the table below:
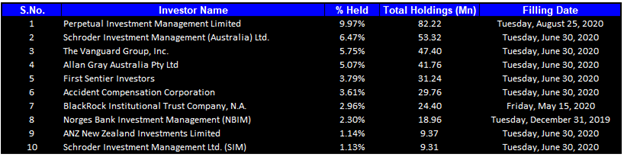
Top 10 Shareholders (Source: Refinitiv (Thomson Reuters))
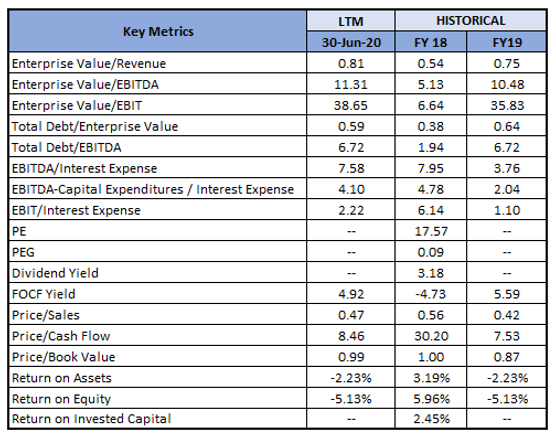
A Quick Look at Key Metrics: The company witnessed modest decline in gross margin and EBITDA margin over FY19, however, it remained above 2017-18 levels. There was an improvement in cash cycle which was 149.7 days for FY20, better than the previous year, implying that the company managed to improve its short-term liquidity position.
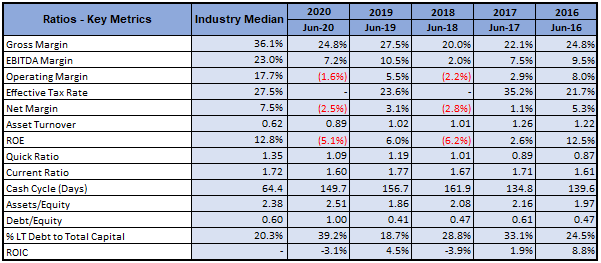
Key Metrics (Source: Refinitiv (Thomson Reuters))
Outlook:
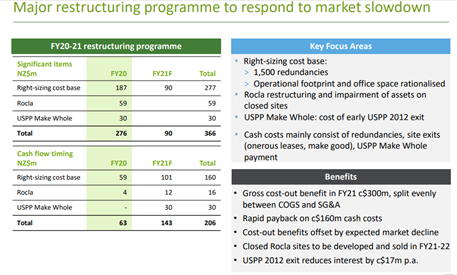
Despite the uncertainty and disruption in markets and the broader economy, the company will continue to focus on investing in its digital and innovation strategies while also looking for opportunities to grow its market share. Keeping in view the challenging environment, the company has taken difficult but necessary decisions to reduce its cost base including rationalization across its supply chain, logistics and procurement activities and reduction in property footprint. It expects to reduce its cost base (permanent) of around $300 million per annum divided between COGS and SG&A.
Key Data (Source: Company Reports)
In New Zealand, the company’s key sectors are expected to remain strong. In Australia, the combination of the residential markets returning to growth from the second half FY21, as well as increased levels of infrastructure spend, might give rise to demand for building materials. The company’s focus is towards profitable growth in residential and development and progressively build apartment capability as well as volumes. The company expects industrial land development at a run rate of $25 million p.a. due to delayed FY20 settlements. The focus is also towards stabilizing construction and completing historical construction order book.
Key Valuation Metrics (Source: Refinitiv (Thomson Reuters))
Valuation Methodology: P/E Multiple Based on Relative Valuation (Illustrative)
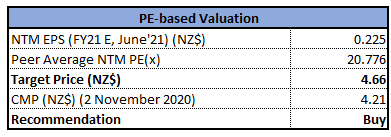
P/E Multiple Based Valuation (Source: Refinitiv (Thomson Reuters))
Note: All forecasted figures and peers have been taken from Thomson Reuters, NTM-Next Twelve Months
Technical Overview:
Weekly Chart –
.png)
Source: Refinitiv (Thomson Reuters)
Note: Purple colour lines are Bollinger Bands® with the upper band suggesting overbought status while the lower band oversold status, and yellow lines are Fibonacci retracement lines which measure price rebound and backtrack. https://www.bollingerbands.com/
After three consecutive weeks of softer close, the stock on the first trading session of the ongoing week has given a stronger close at $4.21 which is near its high of $4.24, exhibiting strong positive sentiment. The technical indicator RSI with around 74 reading though suggests strong bullish momentum, it also suggests that the stock has entered into the overbought zone thereby limiting room for the upside.
Going forward, the stock may have resistance around the previous high of $4.48 whereas support could be around the 38.2% retracement level of $4.03.
Stock Recommendation:
FBU is well-positioned to capitalize on opportunities that are expected to arise with the increased construction activities. The company is focused on improving profitability so that it could deliver shareholder value. The company has reported good cash flow and low leverage ratio of 0.9x which is below the target range of 1.0x-2.0x. Further, the net debt position is getting supported by the strong trading cash flow.
.png)
Key Data (Source: Company Reports)
We have applied Price to Earnings (P/E) Multiple Based Relative Valuation (on an illustrative basis) and have arrived at the target price which reflects the potential upside of low double-digit (in % terms).
The stock price of FBU gave a return of ~17.03% in the past six months and ~23.96% in 3 months. For the purpose of valuations, we have considered peers like Boral Ltd (ASX: BLD), James Hardie Industries PLC (ASX: JHX) and Adbri Ltd (ASX: ABC).
Considering the aforesaid facts and future development plans, we give a “Buy” recommendation on the stock at the current market price of NZ$4.21 per share, up by 2.68% on 2nd November 2020.
.png)
FBU Daily Technical Chart (Source: Refinitiv (Thomson Reuters))
Disclaimer
Kalkine New Zealand Limited is authorised to provide class advice only. The information on this site does not take into account any of your investment objectives, financial situation or needs. Before you make a decision about whether to acquire a financial product, you should obtain the Product Disclosure Statement from the product issuer. You should consider the appropriateness of advice taking into account your own objectives, financial situation and needs and seek independent financial advice before making any financial decisions.
Past performance is not a reliable indicator of future performance.
 Please wait processing your request...