
Company Overview: Fletcher Building Limited (NZX: FBU) is involved in the manufacturing of building products and operates retail business that distribute these products. It is dual listed on NZX and ASX and operates through six divisions – Building Products, Distribution, Concrete, Residential and Development, Construction, and Australia. The company is the major investor in local manufacturing in NZ. In Australia, the company has significant operations in the manufacture and distribution of building products.
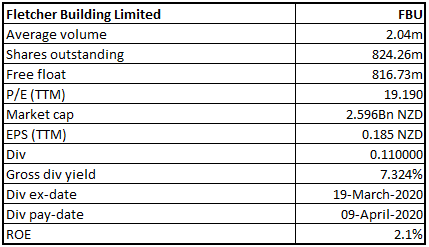
FBU Details
Investment Ideas:
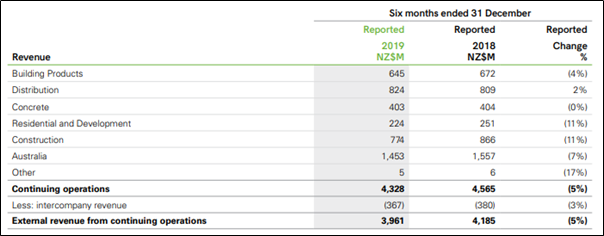
1HFY20 Results In-Line with Guidance: Fletcher Building Limited (NZX: FBU) is involved in the business of building and has a market capitalisation amounting to around $2.59 billion. The company earlier released decent set of numbers for 1H FY 2020 which were in line with the guidance provided in November 2019. The business is now stabilised and focused, providing the foundation to drive consistent performance and growth into the future. The company reported revenue of $3,961 million, down by 5% on 1HFY19, mainly led by reduced revenue on legacy construction projects and the tough market conditions in Australia. EBIT before significant items on continuing operations stood at $219 million, and net earnings stood at $82 million. Both these metrics declined relative to the prior half, partly due to the market and partly due to a more significant first half/second half skew in expected profits for FY20. The company declared an interim dividend of 11 cents per share, up by 40% from 1HFY19.
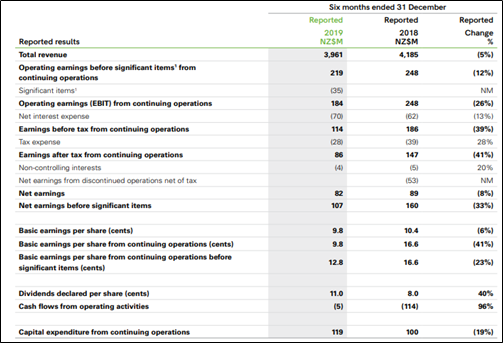
Financial Results (Source: Company Reports)
As per the release dated February 19, 2020, in September 2019, the company started on-market share buyback of up to NZ$300 million to deliver value to its shareholders. The company continues to make good progress and it has made the acquisition of 27.9 million shares for the consideration of $141 million, which implies 3.3% of the issued capital. The company’s EBIT (excluding significant items) for FY 2020 has been anticipated to be between $515 million- $565 million with earnings weighted towards 2H because of Australian cost out programme benefit, residential settlements as well as improved steel performance.
Top 10 Shareholders: The top 10 shareholders have been highlighted in the table, which together forms around 31.25% of the total shareholding. Perpetual Investment Management Limited and Schroder Investment Management (Australia) Ltd are holding maximum interests in the company at 9.99% and 6.46%, respectively (as shown in the table below).
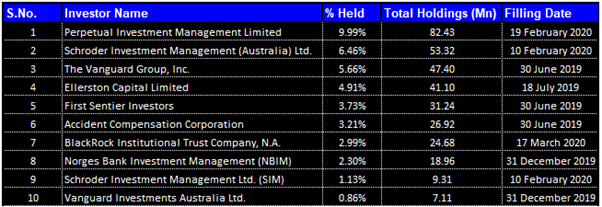
Top 10 Shareholders (Source: Thomson Reuters)
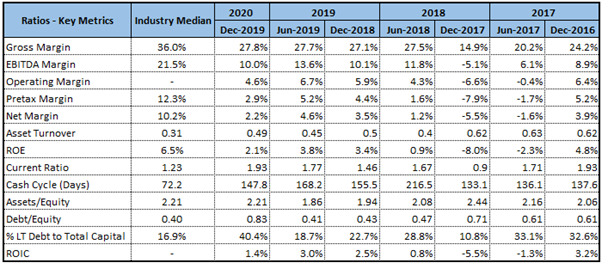
Brief Overview of Key Metrics: In 1HFY20, the company’s gross margins stood at 27.8%, up from 27.1% in 1HFY19. This indicates a healthy financial condition of the company and implies that the company has improved to make reasonable profits on sales as long as it keeps its overhead costs in control. The company’s EBITDA margin stood at 10.0% in 1HFY20, marginally low as compared to 1HFY19. The company's current ratio stood at 1.93x which is higher than industry median figure of 1.23x and, therefore, it can be said that FBU can meet its short-term obligations.
Strong Divisional Performance in NZ Market: In New Zealand, market activity levels remained steady YoY in terms of volumes. While headline residential consents increased, the mix of these continued to move to multi-unit, higher density dwellings. However, the outlook remains strong, supported by the $12 billion infrastructure package announced by the Government in January 2020.
In Building Products, the company has experienced strong volume growth and improved operating performance across plasterboard, insulation and laminates. In contrast, steel business has faced challenging business environment.
In Distribution, revenue increased in line with market activity over 1st half. This occurred against the background of highly competitive market conditions in the key Auckland market, which, along with higher wage, property and freight costs, impacted earnings.
In New Zealand’s residential market, the company saw strong demand for housing mainly in the mid-price category of $600k to $900k.
The Construction division witnessed revenue growth of 3% on a YoY basis as flow of new work increased. The division has been successfully stabilised as well as it is now securing new work with the more balanced risk profile.
The Australian market remained challenging, with residential consents contracting to around 150k to 160k approvals per annum, commercial activity remaining steady, and infrastructure activity was weaker than expected, particularly in water and roading.
Divisional Performance (Source: Company Reports)
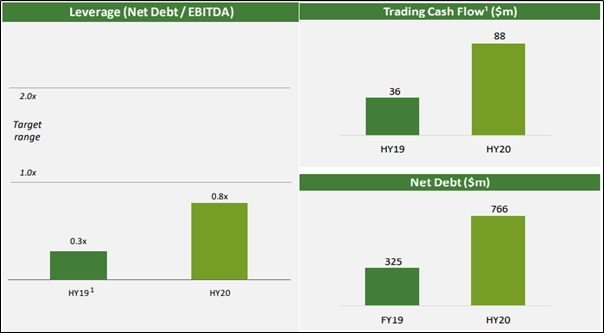
Financial Position in 1HFY20: The company’s balance sheet remains strong, with a leverage ratio below the bottom end of the target range at 0.8x. Trading cash flow from continuing operations, excluding legacy projects increased from $36 million to $88 million led by continued focus and drive on improving working capital. The company had a strong cash position with undrawn credit of $925 million and cash on hand of $570 million. The net debt of the company stood at $766 million in 1HFY20, up from $325 million in FY19 mainly led by share buyback of $141 million, and legacy project cash outflows. Around 61% of the total borrowings have fixed interest rates with an average duration of 2.3 years.
Key Numbers (Source: Company Reports)
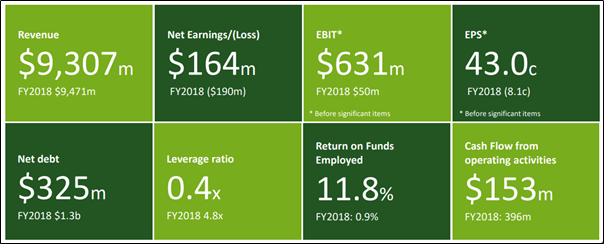
Solid Results for FY19: In FY19, the company delivered solid results. During the year, the company returned to profits, ended the year with a strong balance sheet and reinstated dividends. The company reported revenue of $9.3 billion and net earnings of $164 million during the year. The EBIT was in line with the guidance provided at $631 million. The company also improved its financial position during the year. The company’s net debt decreased from $1.3 billion in June 2018 to $325 million in June 2019, mainly due to divestment of Formica.
During the year, the company paid a total dividend of 23 cents per share, which comprises of a final dividend of 15 cents per share and interim dividend of 8 cents per share.
FY19 Results (Source: Company Reports)
Divisional Performance in FY19: The New Zealand businesses delivered growth of 3% in gross revenue, while operating earnings (excluding B+I) before significant items declined by $31 million or 6% compared to the prior year. The distribution and materials divisions recorded revenue in line with the prior year, while operating earnings declined by 7% or $27 million.
The Residential and Development division delivered earnings 1% higher than the prior period. The housing business continued its strong growth with house sales rising to 755 units. The Construction division grew revenue by 1% as a decrease from the continued wind down of the B+I legacy projects was offset by strong activity levels across the rest of the division.
In Australia, gross revenue declined by 2% and operating earnings before significant items declined by $57 million or 50% compared to the prior year.
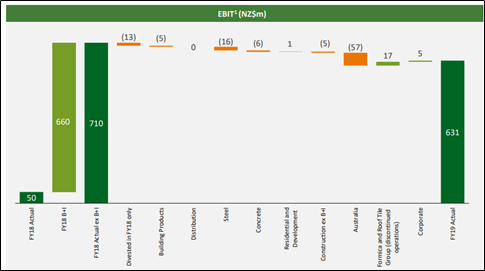
FY19 vs FY18 EBIT earnings bridge (Source: Company Reports)
What to Expect From FBU: The company expects that the medium-term outlook will remain supportive with economic forecasters expecting key markets to grow for the next few years at least. In New Zealand, the company’s key sectors are expected to remain strong. In Australia, the combination of residential market returning to growth from FY21, as well as increasing levels of infrastructure spend, resulted in forecasters expecting the relatively robust outlook in the medium term. As the population of New Zealand and Australia is also growing, supported by continued immigration, the company should see a supportive backdrop for ongoing GDP growth in both countries.
With respect to outlook, EBIT before significant items for FY20 is expected to be in between $515 million to $565 million. The residential business is expected to grow slightly as compared to the previous period, and the company expects Land Development to return to a $25 million p.a. EBIT run rate. The construction earnings will be broadly stable driven mainly by the upcoming roading season.
Valuation Methodology:
P/E Based Valuation
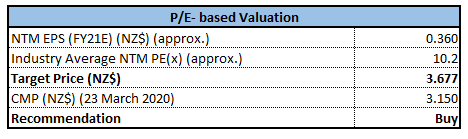
P/E Based Valuation (Source: Thomson Reuters)
Note: All forecasted figures and peers have been taken from Thomson Reuters, NTM-Next Twelve Months.
Technical Overview:
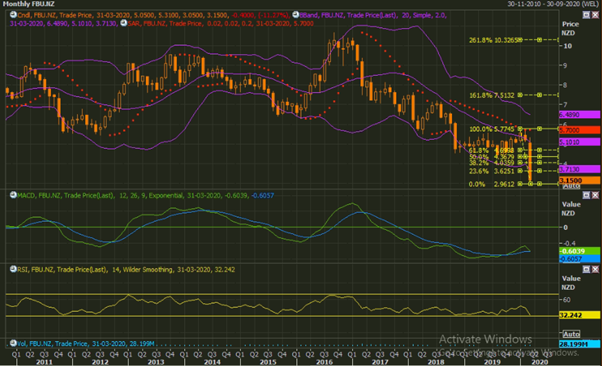
Source: Thomson Reuters
Weekly Chart –
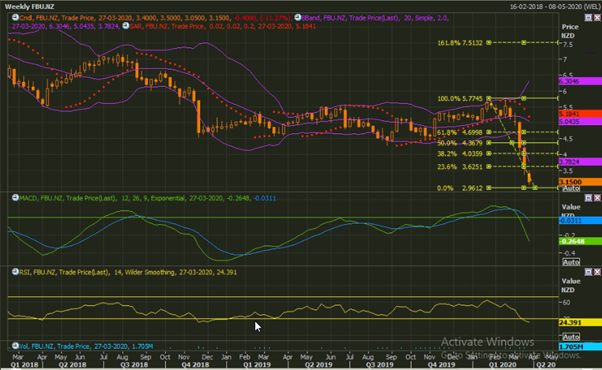
Source: Thomson Reuters
Daily Chart –
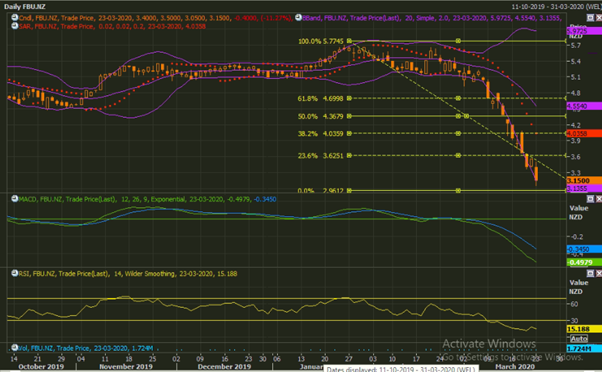
Source: Thomson Reuters
Note: Purple colour lines are Bollinger bands, yellow lines are retracement lines and orange colour dotted line is Parabolic SAR.
The stock was maintaining bullish momentum from Nov. 2019 and made the high around $5.77 in the month Feb. 2020, but closing was lower than January 2020 close for the stock thereby indicating that price correction is in the offing. It is in on-going month of March 2020 that the stock is witnessing sharper correction more so because of overall pessimism developed with the spread of CoronaVirus which has engulfed global economies.
From technical indicators performance perspective, while bearish cross-over for MACD and RSI suggesting oversold status for the stock on all timeframe of charts thereby exhibiting weaker trend for the stock in near-term, the highly oversold status for the stock leaves with lesser scope for the stock to experience further fall while giving the rise of possibility of technical rebound in the stock prices.
We believe that the stock could have good support around $3.00 while on technical rebound it may have to face resistance around $3.65.
Stock Recommendation: In the time period of FY15 to FY19, the company’s gross profit has grown at a CAGR of 2.01%. Currently, the stock is trading below the average of 52-week low and high of $3.370 and $5.700, respectively. This offers a decent opportunity for the shareholders to accumulation. Considering the growth opportunities, current trading levels and decent outlook, we have valued the stock using Price to Earnings based relative valuation approach and have arrived at a target price of lower double-digit growth (in percentage terms).
Hence, we recommend a “Buy” rating on the stock at the current market price of NZ$3.150.
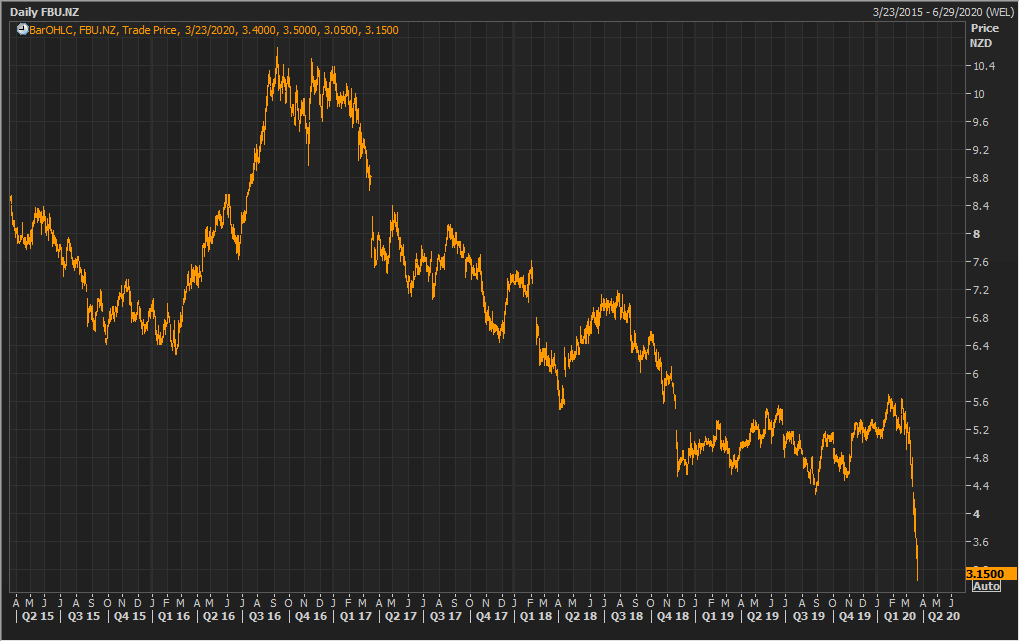
FBU Daily Technical Chart (Source: Thomson Reuters)
Disclaimer
Kalkine New Zealand Limited is authorised to provide class advice only. The information on this site does not take into account any of your investment objectives, financial situation or needs. Before you make a decision about whether to acquire a financial product, you should obtain the Product Disclosure Statement from the product issuer. You should consider the appropriateness of advice taking into account your own objectives, financial situation and needs and seek independent financial advice before making any financial decisions.
Past performance is not a reliable indicator of future performance.
 Please wait processing your request...