
Company Overview: Fisher & Paykel Healthcare Corporation Limited (NZX: FPH) is involved in designing, manufacturing, and marketing of medical device products and systems, which are used in respiratory care, acute care, surgery, and the treatment of obstructive sleep apnea. The company has a diverse market presence including North American segment (including the United States and Canada); European segment (including the United Kingdom, France, Germany, Sweden, Turkey, and Russia); Asia-Pacific segment (including Australia, Japan, India, China, South Korea, Taiwan, and Hong Kong); and Other segment (including New Zealand, Latin America, Africa, the Middle East, and other countries).
FPH Details
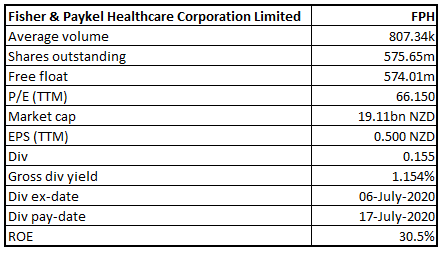
Results Driven by Increased Demand from Hospital and Homecare products: Fisher & Paykel Healthcare Corporation Limited (NZX: FPH) is a primary marketer, manufacturer, and designer of systems and products for usage in surgery, acute care, respiratory care, and the treatment of obstructive sleep apnea. It has a market capitalization of ~$19.111 billion as on September 14, 2020.
Looking at the past performance over FY16 to FY20, the top-line and the bottom-line of the company grew with a compounded annual growth rate (CAGR) of 11.57% and 18.97%, respectively. The total revenue of the company increased from $815.5 million in FY16 to $1,263.7 million in FY20. Net income increased from $143.4 million in FY16 to $287.3 million in FY20.
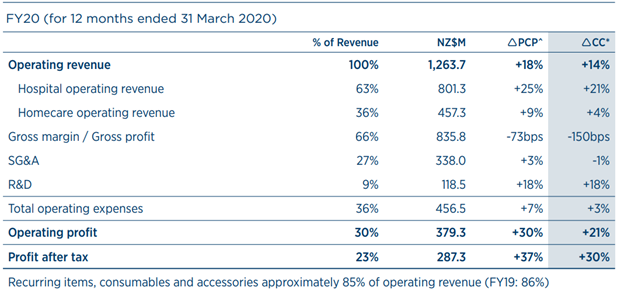
Stellar FY20 Financial Performance: The company’s FY20 results were already on track to deliver strong growth before the impact of COVID-19 on its operations. Due to the increased demand for Hospital and Homecare products, 2HFY20 saw the company register better-than-expected financial performance. Operating revenue stood at $1.26 billion, up 18 percent as compared to last year, or 14 percent in a constant currency basis. Net profit after tax stood at $287 million, up 37 percent over the previous year, or 30 percent in constant currency. The growth in revenue was largely driven by an increase in the demand for products to treat COVID-19 patients, increase in the use of Optiflow™ nasal high flow therapy and strong hardware sales during the year.
Besides, the company had to double/triple the output of its hospital hardware products over just a few months at the end of the year to cater to increased demand for the same. The operating revenue for Hospital products increased by 25% to $801.3 million and revenue for Homecare products rose 9% to $457 million.
The company expects to increase dividends as earnings grow while keeping its debt-to-debt-plus equity ratio in the range of +5% to -5%.
During the financial year, the company under the Homecare product group introduced its F&P ViteraTM OSA full face mask into the US market and launched the new F&P EvoraTM compact nasal mask in Australasia, Europe, and Canada. Both of these masks have been well-received.
Key Data (Source: Company Reports)
Top 10 Shareholders: The top 10 shareholders have been highlighted in the table, which together forms around 22.34% of the total shareholding. The Vanguard Group, Inc. and Capital Research Global Investors are holding maximum stake in the company at 5.24% and 4.80%, respectively, as provided in the table below:
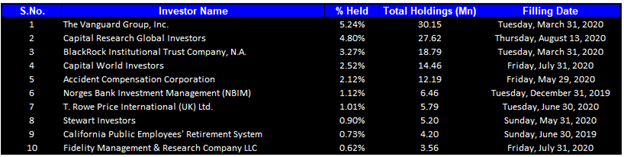
Top 10 Shareholders (Source: Refinitiv (Thomson Reuters))
A Quick Look at Key Metrics: Its EBITDA margin and net margin for FY20 stood at 34.8% and 22.7%, better than the industry median of 24.1% and 13.2%, respectively, implying an improvement in operating efficiency of the company. ROE for FY20 stood at 30.5%, better than the industry median of 17.4%, implying that the company generated better returns for its shareholders than its peer group. Its return on invested capital for FY20 stood at 27.1%.
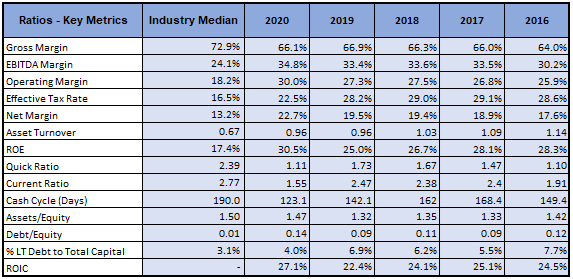
Key Metrics (Source: Refinitiv (Thomson Reuters))
What to Expect: For the first 3 months of FY2021, there has been an acceleration in hospital product group growth, with hardware growth of more than 300 percent, as well as hospital consumables tracking at over a one-third increase, in comparison to the first 3 months of FY20. Homecare products are also witnessing mask resupply levels returning closer to the expected level of FY20. Considering the current trading conditions, full-year operating revenue for the 2021 financial year is expected to be $1.48 billion, and net profit after tax is anticipated at $325 million to $340 million.
Healthcare Sector Outlook: As per the release dated 13th May 2020 by the Medical Technology Association of New Zealand, The New Zealand HealthTech sector has shown steady growth over the past five years, with exports driving success. HealthTech companies generated $1.9 billion in revenue, with a five-year CAGR of 9.1% and global exports of healthcare technology accounted for $1.6 billion, or 87.5% of revenue.
With the outbreak of COVID-19, there has been a surge in demand for smart care, centered around patients and technologies.
Valuation Methodology: EV/Sales Multiple Based Relative Valuation (Illustrative)
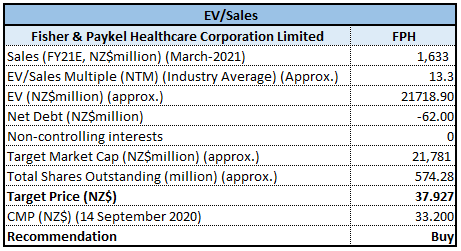
EV/Sales Multiple Based Relative Valuation (Source: Refinitiv (Thomson Reuters))
Note: All forecasted figures and peers have been taken from Thomson Reuters, NTM-Next Twelve Months
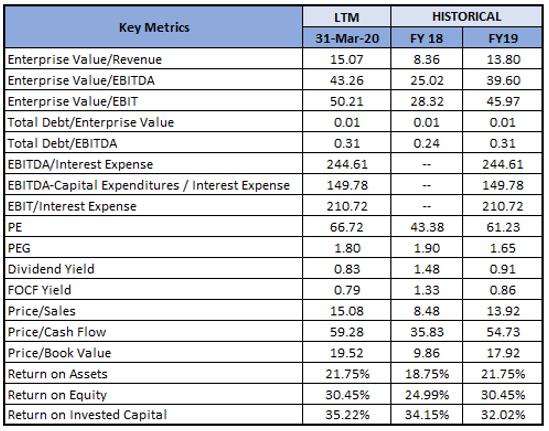
Key Valuation Metrics (Source: Refinitiv (Thomson Reuters))
Technical Overview:
Weekly Chart –
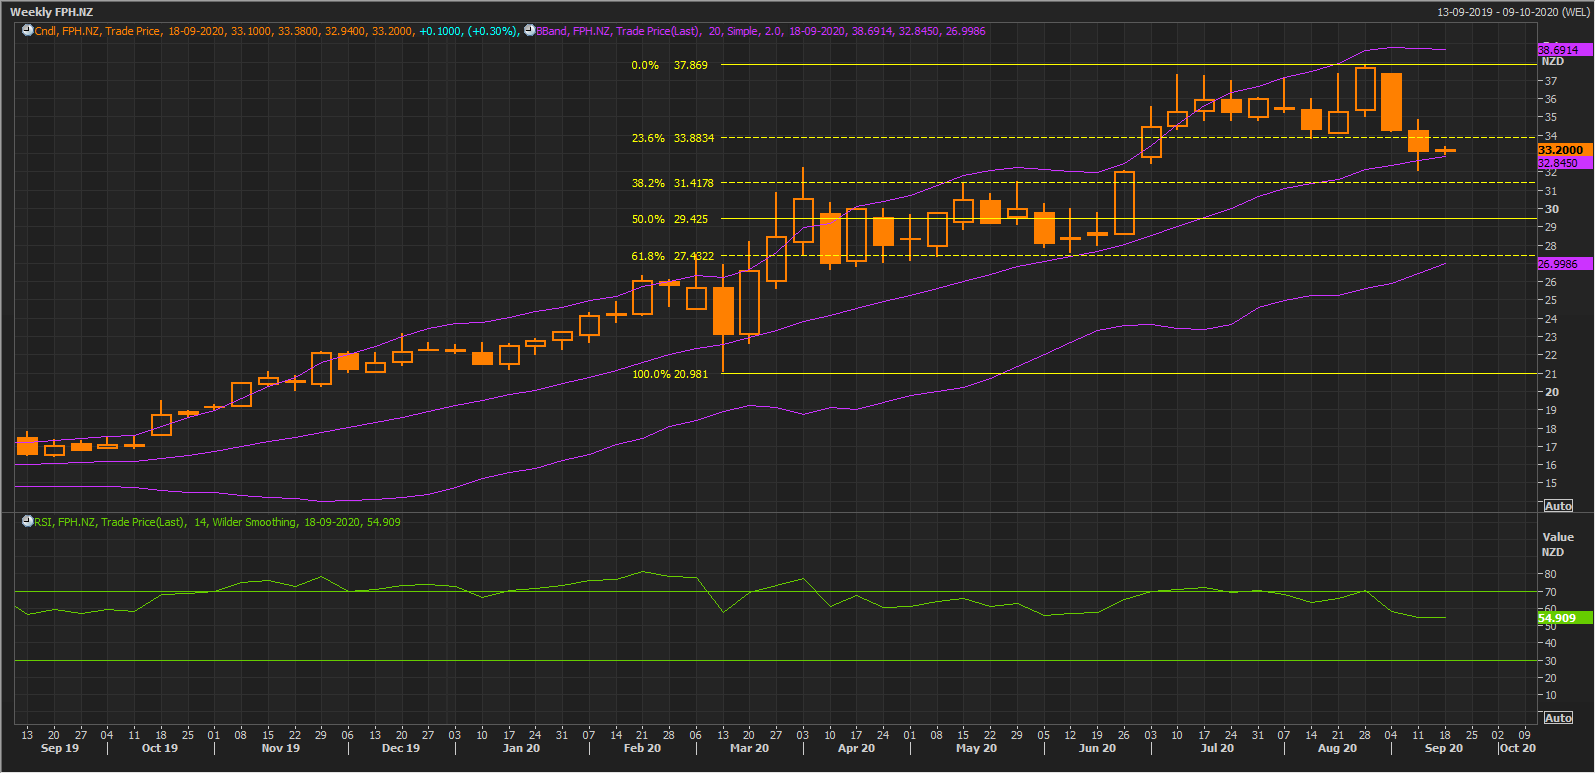
Source: Refinitiv (Thomson Reuters)
Note: Purple colour lines are Bollinger Bands with the upper band suggesting overbought status while the lower band oversold status, and yellow lines are Fibonacci retracement lines which measure price rebound and backtrack.
The stock on the first trading day of the ongoing week has given close at $33.20 which is above the previous week close and towards confirmation of the ‘Bullish Harami’ pattern, suggesting a bullish reversal for the stock. The technical indicator RSI with a reading around 55 indicates strong bullish momentum for the stock.
Going forward, the stock may have resistance around the previous high of $37.86 whereas on price retreat, it will find strong support around the 50% retracement level of $31.41.
Stock Recommendation: The company’s top-line and bottom-line improved over the years. It maintains a decent liquidity position at the end of FY20 while displaying significant profitability margins. Operations in various geographical regions provide the company diverse source of revenue streams. As the spending in the healthcare sector is expected to increase dramatically due to priority being attached to health, all the associated companies are expected to enhance their earnings in the upcoming periods.
We have applied EV/Sales Multiple Based Relative Valuation (on an illustrative basis) and the target price reflects a rise of lower double-digit (in % terms).
Considering the aforesaid facts, recent update and FY20 results, we give a “Buy” recommendation on the stock at the current market price of NZ$33.200 per share, up by 0.30% on September 14, 2020.
.png)
FPH Daily Technical Chart (Source: Refinitiv (Thomson Reuters))
Disclaimer
Kalkine New Zealand Limited is authorised to provide class advice only. The information on this site does not take into account any of your investment objectives, financial situation or needs. Before you make a decision about whether to acquire a financial product, you should obtain the Product Disclosure Statement from the product issuer. You should consider the appropriateness of advice taking into account your own objectives, financial situation and needs and seek independent financial advice before making any financial decisions.
Past performance is not a reliable indicator of future performance.
 Please wait processing your request...