
Section 1: Company Overview and Fundamentals
1.1 Company Overview:
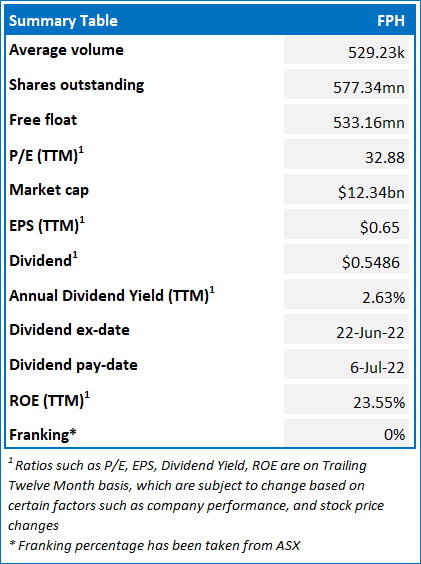
Fisher & Paykel Healthcare Corporation Limited (NZX: FPH) is engaged in designing, manufacturing, and marketing products and systems which find usage in surgery, acute care, respiratory care, and the treatment of obstructive sleep apnea.
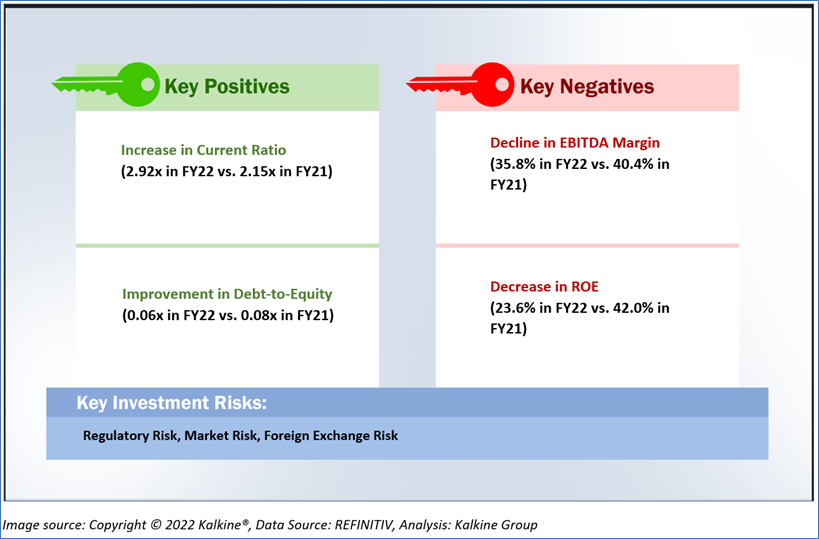
1.2 The Key Positives, Negatives, Investment Highlights and Risks
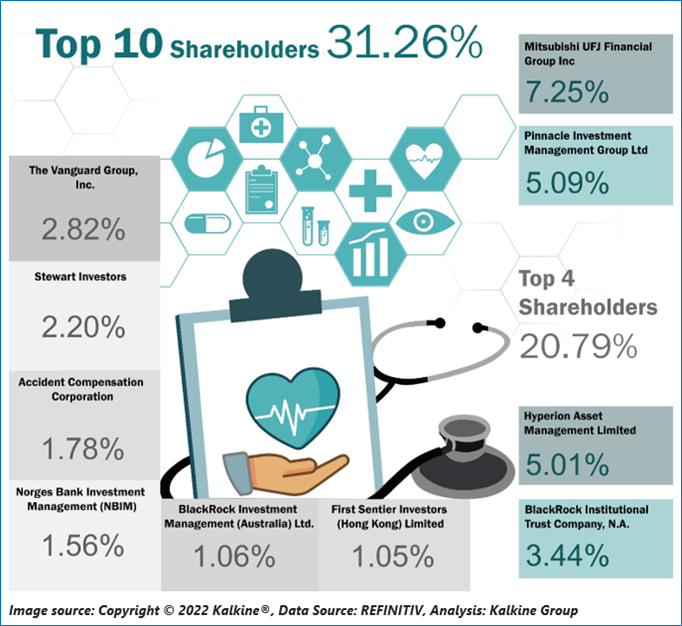
1.3 Top 10 Shareholders: The top 10 shareholders have been highlighted in the chart, which together forms ~31.26% of the total shareholding.
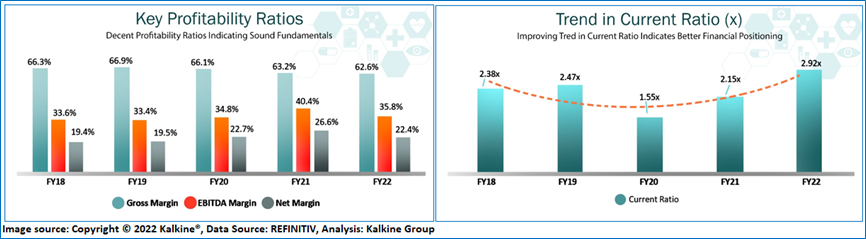
1.4 Key Metrics:
The company has posted a decent uptick in current ratio to 2.92x in FY22 from 2.15x in FY21. Notably, the company’s debt to equity ratio also improved to 0.06x in FY22 from 0.08x in FY21, depicting reasonable leverage position of the company.
Section 2: Business Updates and Financial Highlights
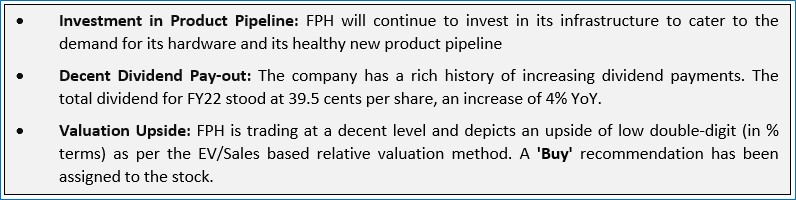
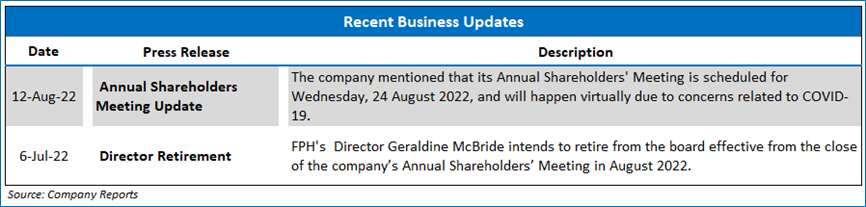
2.1 Recent Updates:
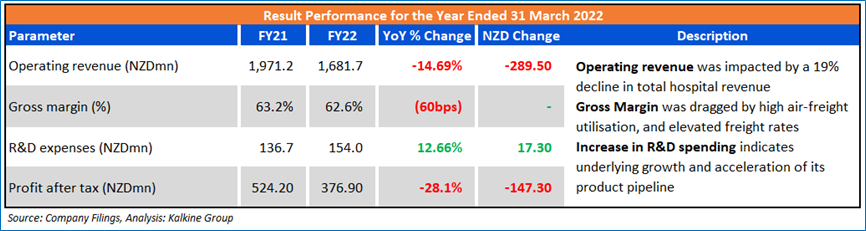
2.2 Financial Highlights:
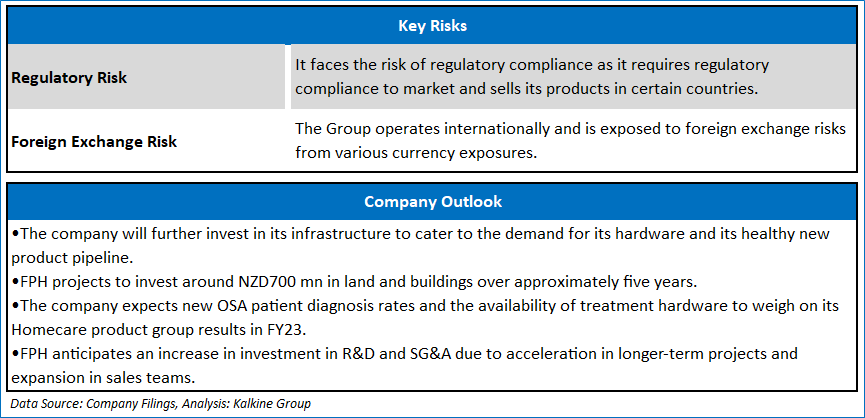
Section 3: Key Risks and Outlook:
Section 4: Stock Recommendation Summary:
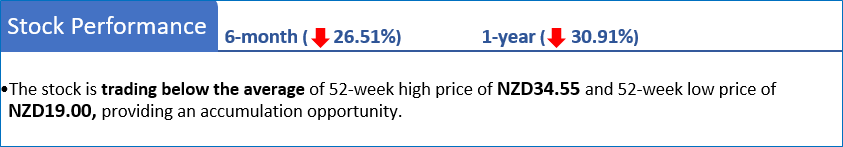
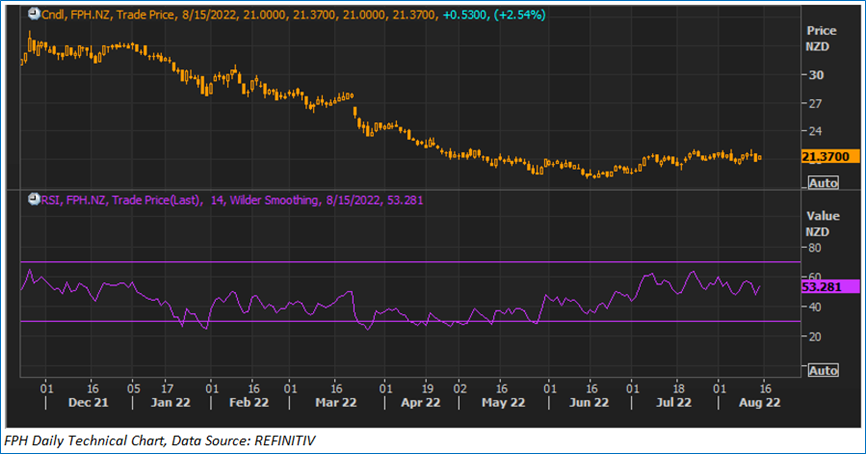
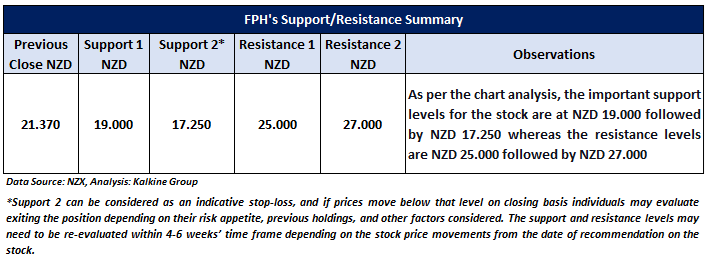
4.1 Price Performance and Technical Summary:
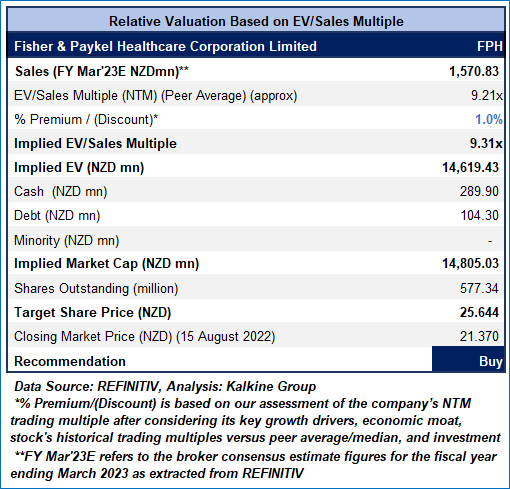
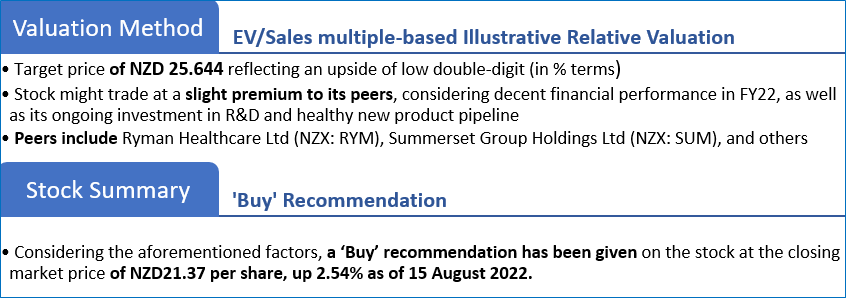
4.2 Fundamental Valuation
Valuation Methodology: EV/Sales Multiple Based Relative Valuation (Illustrative)
Markets are trading in a highly volatile zone currently due to certain macro-economic issues and geopolitical tensions prevailing. Therefore, it is prudent to follow a cautious approach while investing.
Note 1: Past performance is not a reliable indicator of future performance.
Note 2: The reference date for all price data, currency, technical indicators, support, and resistance levels is August 15, 2022. The reference data in this report has been partly sourced from REFINITIV.
Note 3: Investment decisions should be made depending on an individual's appetite for upside potential, risks, holding duration, and any previous holdings. An 'Exit' from the stock can be considered if the Target Price mentioned as per the Valuation and or the technical levels provided has been achieved and is subject to the factors discussed above.
Technical Indicators Defined: -
Support: A level at which the stock prices tend to find support if they are falling, and a downtrend may take a pause backed by demand or buying interest. Support 1 refers to the nearby support level for the stock and if the price breaches the level, then Support 2 may act as the crucial support level for the stock.
Resistance: A level at which the stock prices tend to find resistance when they are rising, and an uptrend may take a pause due to profit booking or selling interest. Resistance 1 refers to the nearby resistance level for the stock and if the price surpasses the level, then Resistance 2 may act as the crucial resistance level for the stock.
Stop-loss: It is a level to protect further losses in case of unfavourable movement in the stock prices.
Disclaimer
Kalkine New Zealand Limited is authorised to provide general advice only. The information on this website does not take into account any of your investment objectives, financial situation or needs. Before you make a decision about whether to acquire a financial product, you should obtain the Product Disclosure Statement from the product issuer. You should consider the appropriateness of advice taking into account your own objectives, financial situation and needs and seek independent financial advice before making any financial decisions.
Past performance is not a reliable indicator of future performance.
 Please wait processing your request...