
Company Overview: Fisher & Paykel Healthcare Corporation Limited (NZX: FPH) is engaged in designing, manufacturing, and marketing products and systems which find usage in surgery, acute care, respiratory care, and the treatment of obstructive sleep apnea.
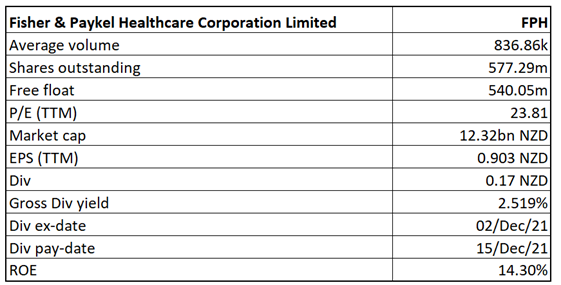
FPH Details
The market capitalisation of the company stood at ~$12.32 billion on 2nd May 2022.
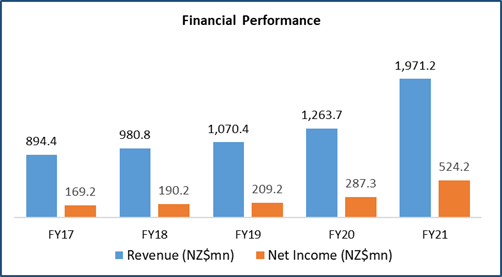
Looking at the past performance over FY17 to FY21, FPH’s top line grew with a compounded annual growth rate (CAGR) of 21.8%. Total Revenue of the company improved from $894.4 million in FY17 to $1,971.2 million in FY21. Net Income improved from $169.2 million in FY17 to $524.2 million in FY21.
Exhibit 1: Financial Statistics
Source: Analysis by Kalkine Group
Result Performance for H1FY22 (For the Half Year Ended 30 September 2021)
Top 10 Shareholders:
The top 10 shareholders have been highlighted in the table, which together forms ~22.43% of the total shareholding.
Exhibit 2: Top 10 Shareholders
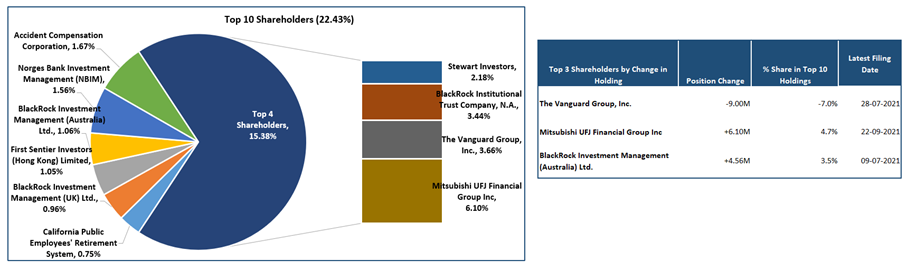
Source: Analysis by Kalkine Group
A Quick Look at Key Metrics:
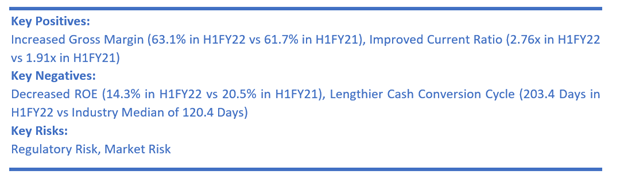
In FY 2021, the company has posted net margin of 26.6% as compared to the industry median of 19.8%. Therefore, it could be said that FPH is possessing decent capabilities to convert its top line into bottom line as compared to the broader industry. The company has posted ROE of 42.0% in FY 2021 as compared to the industry median of 15.0%.
Exhibit 3: Key Metrics
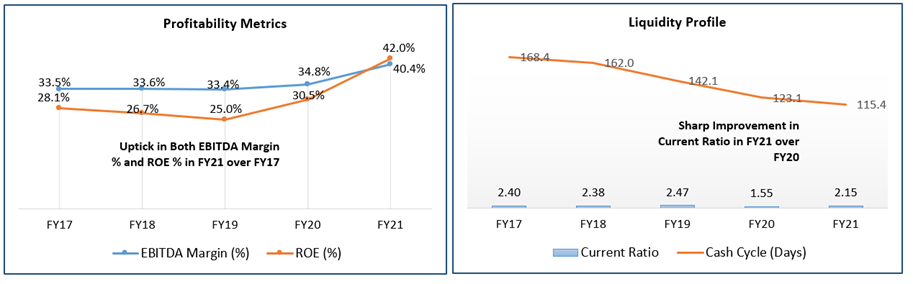
Analysis by Kalkine Group
Recent Update:
On 14 April 2022, the company announced that it plans to release its financial results for the year ended 31 March 2022 on 25th May 2022. In the separate release, the company mentioned that it will hold an Investor Day on 26 May 2022 following its financial results announcement on 25 May.
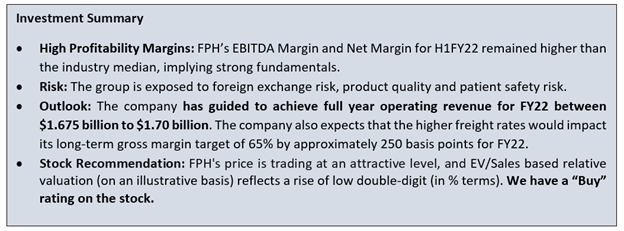
Outlook:
The company recently provided revenue guidance for the financial year ending 31 March 2022, wherein, it expects to achieve full year operating revenue for FY22 in the range of $1.675 billion to $1.70 billion. Further, the elevated freight rates are expected to impact its long-term gross margin target of 65% by approximately 250 basis points in FY22.
Meanwhile, FPH remains assured that its business is better positioned to deliver a positive change in clinical practice and improving outcomes for respiratory patients in general over the long term.
In its Homecare product group, FPH is witnessing growth in sales of its OSA masks that is currently tracking above its first half growth rate regardless of supply constraints of treatment hardware in the market.
Risks:
The company is exposed to broader risks like product quality and patient safety. Further, it faces the risk of regulatory compliance as it requires regulatory compliance to market and sell its products in certain countries. The Group operates internationally and is exposed to foreign exchange risk arising from various currency exposures.
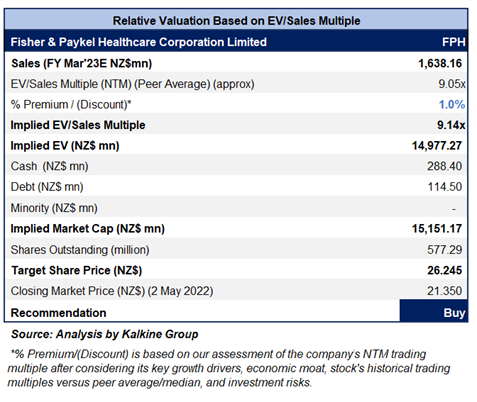
Valuation Methodology: EV/Sales Based Relative Valuation (Illustrative)
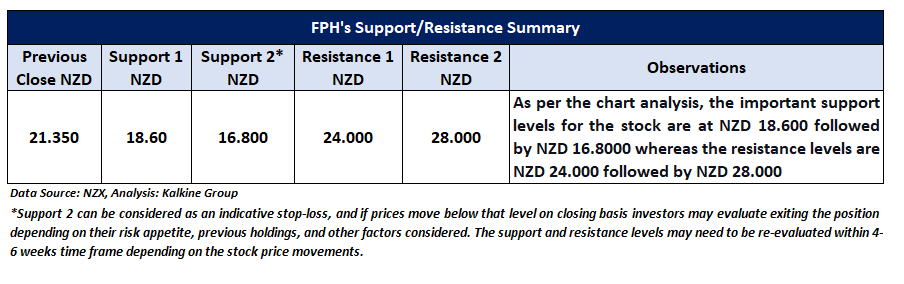
Technical Overview:
Chart:
.png)
Source: REFINITIV
Note: Purple Color Line Reflects RSI (14-Period)
Stock Performance:
The stock has been valued using an EV/Sales based relative valuation (on an illustrative basis) and the target price so arrived reflects a rise of low double-digit (in % terms). A slight premium has been applied to EV/Sales Multiple (NTM) (Peer Average) considering decent financial performance in H1FY22 along with the better progress in its strategic initiatives as well as strong new product pipeline.
The company is anticipated to invest approximately $700 million in land and buildings over the next five years.
Markets are trading in a highly volatile zone currently due to certain macro-economic issues and geopolitical tensions prevailing. Therefore, it is prudent to follow a cautious approach while investing.
Considering the aforementioned factors, we give a “Buy” recommendation on the stock at the closing market price of $21.350 per share, down by 0.70% on 2nd May 2022.
Note 1: The reference data in this report has been partly sourced from REFINITIV.
Note 2: Investment decisions should be made depending on the investors’ appetite on upside potential, risks, holding duration, and any previous holdings. Investors can consider exiting from the stock if the Target Price mentioned as per the analysis has been achieved and subject to the factors discussed above alongside support levels provided.
Technical Indicators Defined:-
Support: A level where-in the stock prices tend to find support if they are falling, and downtrend may take a pause backed by demand or buying interest.
Resistance: A level where-in the stock prices tend to find resistance when they are rising, and uptrend may take a pause due to profit booking or selling interest.
Stop-loss: It is a level to protect further losses in case of unfavourable movement in the stock prices.
Disclaimer
Kalkine New Zealand Limited is authorised to provide general advice only. The information on this website does not take into account any of your investment objectives, financial situation or needs. Before you make a decision about whether to acquire a financial product, you should obtain the Product Disclosure Statement from the product issuer. You should consider the appropriateness of advice taking into account your own objectives, financial situation and needs and seek independent financial advice before making any financial decisions.
Past performance is not a reliable indicator of future performance.
 Please wait processing your request...