
This report is an updated version of the report published on 4th April 2022 at 4:38 PM (GMT +12)
Company Overview: Fisher & Paykel Healthcare Corporation Limited (NZX: FPH) designs, manufactures and markets medical device products and systems for use in respiratory care, acute care, surgery and the treatment of obstructive sleep apnea. The Company’s segment includes North America, which includes all activities controlled by entities or employees based in the United States and Canada; Europe, which includes all activities controlled by entities or employees based in the United Kingdom, France, Germany, Sweden, Turkey and Russia, and Asia-Pacific, which includes all activities controlled by entities or employees based in Australia, Japan, India, China, South Korea, Taiwan and Hong Kong.
Fisher & Paykel Healthcare Corporation Limited
.png)
FPH Details
Fisher & Paykel Healthcare Corporation Limited (NZX: FPH) is engaged in designing, manufacturing, and marketing products and systems which find usage in surgery, acute care, respiratory care, and the treatment of obstructive sleep apnea. The market capitalisation of the company stood at ~$14.25 billion on 4th April 2022.
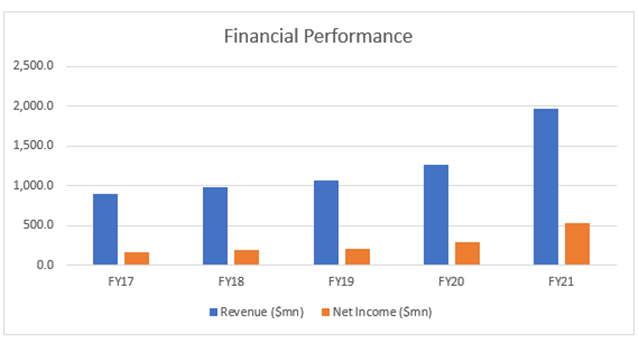
Looking at the past performance over FY17 to FY21, FPH’s top line grew with a compounded annual growth rate (CAGR) of 21.84%. Total Revenue of the company improved from $894.4 million in FY17 to $1.97 billion in FY21. Net Income improved from $169.2 million in FY17 to $524.2 million in FY21.
Exhibit 1: Financial Statistics
Source: Analysis by Kalkine Group
Result Performance for H1FY22 (6 Months Ended 30 September 2021)
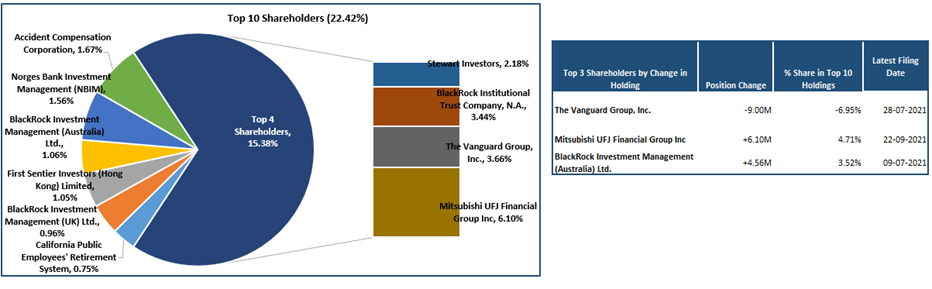
Top 10 Shareholders:
The top 10 shareholders have been highlighted in the table, which together forms ~22.42% of the total shareholding.
Exhibit 2: Top 10 Shareholders
Source: Analysis by Kalkine Group
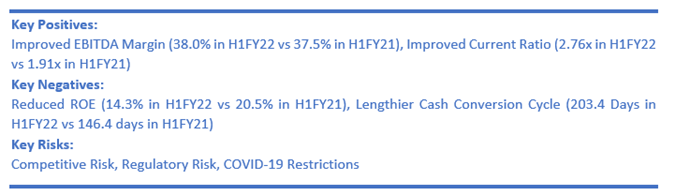
A Quick Look at Key Metrics:
In FY 2021, the company has posted net margin of 26.6% as compared to the industry median of 18.2%. Therefore, it could be said that FPH is possessing decent capabilities to convert its top line into bottom line as compared to the broader industry. The company has posted ROE of 42% in FY 2021.
Exhibit 3: Key Metrics
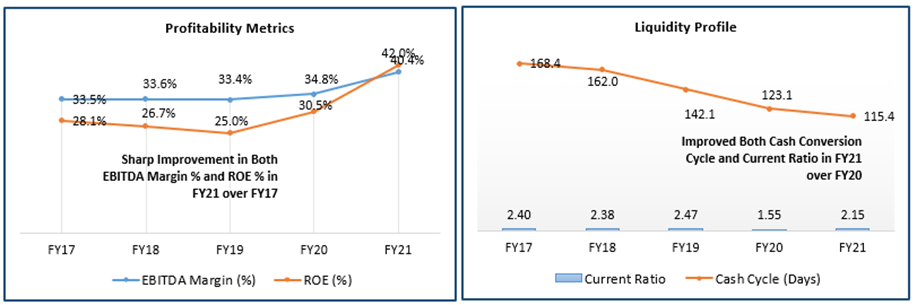
Analysis by Kalkine Group
Recent Update:
On 23 March 2022, FPH provided an update on its performance and its FY22 revenue guidance. Its hospital consumables revenue for the second half is tracking to be similar to the Hospital Consumables revenue that was reported in H1FY22, which is consistent with reports of the increased Omicron footprint and its associated lower respiratory intervention requirements, as well as the relatively mild flu season in the Northern Hemisphere.
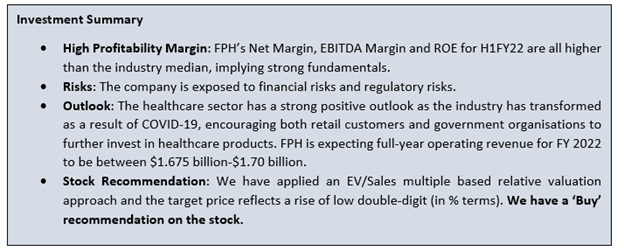
The company is expecting full-year operating revenue for the 2022 financial year to be in the range of $1.675 billion to $1.70 billion.
Outlook:
Fisher & Paykel understands the situation of the current economy and is prepared for the ongoing local surges in COVID-19 cases.
In the Homecare product group, growth in sales of OSA masks is currently tracking above the H1 growth rate despite the supply constraints of treatment hardware in the market. Notably, the freight rates are elevated and, for the 2022 financial year, are expected to impact the long-term gross margin target of 65% by ~250 basis points.
Risks:
The company is exposed to credit, market, and liquidity risk that arises in the normal course of the business. Fisher & Paykel is operating in the highly competitive industry and a decrease in market share could affect the company’s overall business.
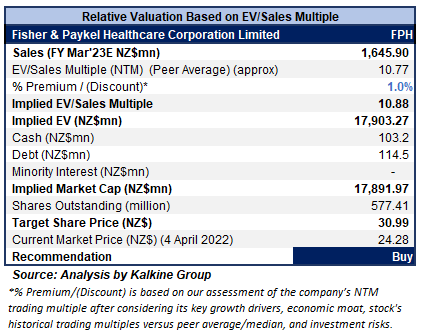
Valuation Methodology: EV/Sales Based Relative Valuation (Illustrative)
Technical Overview:
Chart:
.png)
Source: REFINITIV
Note: Purple Color Line Reflects RSI (14-Period)
Stock Performance:
Despite ongoing impacts on the business, the company has a solid roadmap ahead for any further disruptions. Regardless of how COVID-19 effects unfold, FPH is well-placed to contribute to the positive change in clinical practice as well as improving outcomes for the respiratory patients in general over the long term.
The stock has been valued using EV/Sales based relative valuation (on an illustrative basis) and the target price so arrived reflects a rise of low double-digit (in % terms). A slight premium has been applied to EV/Sales Multiple (NTM) (Peer Average) considering the decent outlook as well as better liquidity.
Markets are trading in a highly volatile zone currently due to certain macro-economic issues and geopolitical tensions prevailing. Therefore, it is prudent to follow a cautious approach while investing.
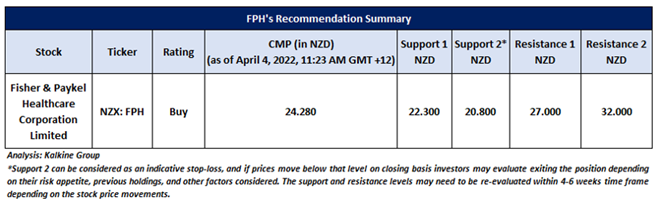
Considering the above facts and its current trading levels, we give a “Buy” recommendation on the stock at the current market price of NZ$24.28 per share (New Zealand Time: 11:23 AM (GMT +12)) on 4th April 2022.
Note 1: The reference data in this report has been partly sourced from REFINITIV.
Note 2: Investment decisions should be made depending on the investors’ appetite on upside potential, risks, holding duration, and any previous holdings. Investors can consider exiting from the stock if the Target Price mentioned as per the analysis has been achieved and subject to the factors discussed above alongside support levels provided.
Technical Indicators Defined:-
Support: A level where-in the stock prices tend to find support if they are falling, and downtrend may take a pause backed by demand or buying interest.
Resistance: A level where-in the stock prices tend to find resistance when they are rising, and uptrend may take a pause due to profit booking or selling interest.
Stop-loss: It is a level to protect further losses in case of unfavourable movement in the stock prices.
Disclaimer
Kalkine New Zealand Limited is authorised to provide general advice only. The information on this website does not take into account any of your investment objectives, financial situation or needs. Before you make a decision about whether to acquire a financial product, you should obtain the Product Disclosure Statement from the product issuer. You should consider the appropriateness of advice taking into account your own objectives, financial situation and needs and seek independent financial advice before making any financial decisions.
Past performance is not a reliable indicator of future performance.
 Please wait processing your request...