
Company Overview: Medical device products designer and manufacturer, Fisher & Paykel Healthcare Corporation Limited (NZX: FPH) provides its services for respiratory care, acute care, surgery and the treatment of obstructive sleep apnea. Its important market is in North America, which includes all activities controlled by entities or employees based in the United States and Canada; Europe, which includes all activities controlled by entities or employees based in the United Kingdom, France, Germany, Sweden, Turkey and Russia, and Asia-Pacific, which includes all activities controlled by entities or employees based in Australia, Japan, India, China, South Korea, Taiwan and Hong Kong, and Other segment includes New Zealand, Latin America, Africa, the Middle East and other countries.
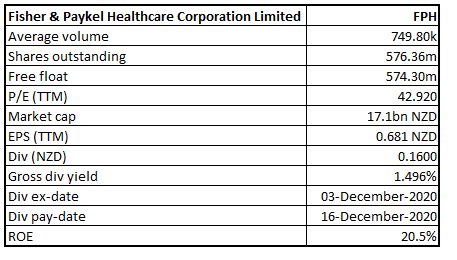
FPH Details
.png)
Fisher & Paykel Healthcare Corporation Limited (NZX: FPH) is a primary marketer, manufacturer and designer of products and systems for usage in surgery, acute care, respiratory care, and the treatment of obstructive sleep apnea. The company has a market capitalisation of ~$17.1 billion on 1st March 2021.
Looking at the performance over FY16 to FY20, top-line and bottom-line of the company grew with a compounded annual growth rate (CAGR) of 11.57% and 18.97%, respectively. The total revenue of the company improved from $815.5 million in FY16 to $1,263.7 million in FY20. Net income improved from $143.4 million in FY16 to $287.3 million in FY20.
Update on Performance of Nine Months (Till 31 December 2020)
Operating revenue for the nine months was up by 73% wherein Hospital product operating revenue grew by 113%, Hospital hardware revenue grew by 446%, and Hospital consumable revenue grew by 54% in constant currency over the same period last year. This can be attributed to elevated hospitalization rates for COVID-19 where the entire world witnessed influx of COVID-19 patients requiring hospitalization for respiratory treatment.
Operating revenue of the Homecare products during the period grew by 6% over the same period last year as a result of increased use of products used in the treatment of obstructive sleep apnea and respiratory support in the home.
Results Performance (Half-Year ended 30th September 2020)
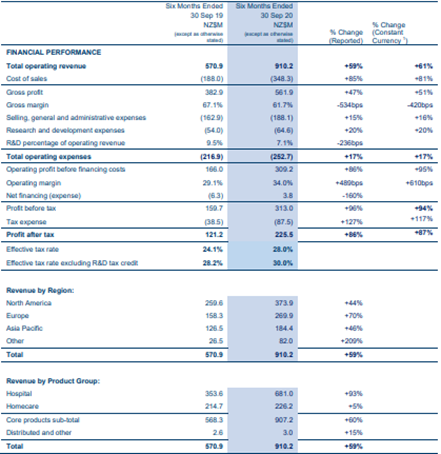
Operating revenue for the period stood at $910.2 million, an increase of 61% in constant currency over the previous corresponding period (pcp), which can be attributed to the strong demand for the company’s Hospital hardware, in particular its OptiflowTM and AirvoTM systems, reflecting a shift in clinical practice toward using nasal high flow therapy as a front-line treatment for Covid-19 patients in the hospital. Net profit after tax for the period stood at $225.5 million, an increase of 86% over the same period in the previous financial year.
Operating revenue in the Hospital product group, which includes products used in acute and chronic respiratory care and surgery grew 93% over the same period last year to $681.0 million, or 94% growth in constant currency. Revenue growth for new applications consumables, i.e., products used in non-invasive ventilation, Optiflow nasal high flow therapy and surgical applications, grew by 43% (by constant currency). Homecare operating revenue grew by 6%, whereas revenue in OSA masks increased by 3% in constant currency over the same period last year.
The gross margin in the period reduced to 61.7% because of increased use of air freight and the elevated costs associated with it. The Board of Directors approved an interim dividend of 16 cents per ordinary share, an increase of 33% on the interim dividend last year with a record date of 4 December and a payment date of 16 December 2020.
Exhibit 1: Income Statement
Key Data (Source: Company Reports)
Results Performance (Year Ended March 31, 2020)
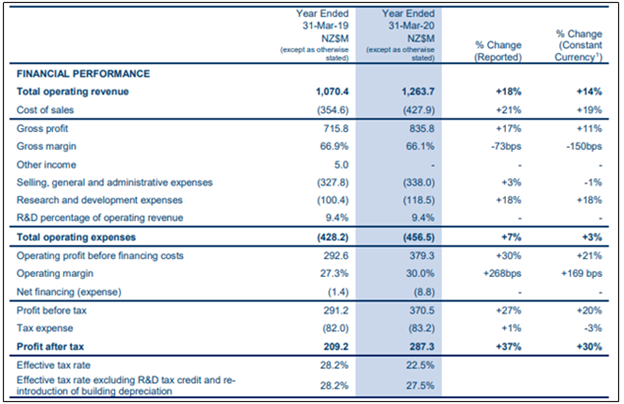
Operating revenue stood at $1.26 billion, up 14% in constant currency as compared to last year, mainly due to the increased demand for products to treat COVID-19 patients, driving the demand for Optiflow™ nasal high flow therapy and hospital hardware. The revenue for Homecare products grew by 4% in constant currency over the same period last year. Its gross margin for the period declined by 73 bps (basis points) to 66.1%, mainly due to additional air freight costs required to acquire an increased supply of raw materials and expedite finished goods to customers for patient use towards the end of the financial year, along with the additional start-up costs of the company’s second Mexico manufacturing facility. Net profit after tax stood at $287 million, up 30% in constant currency over the previous year.
Exhibit 2: Key Financial Metrics
Key Data (Source: Company Reports)
Top 10 Shareholders: The top 10 shareholders have been highlighted in the table, which together forms around 20.69% of the total shareholding. The Vanguard Group, Inc. and Capital Research Global Investors are holding a maximum stake in the company at 5.23% and 4.79%, respectively, as provided in the table below:
Exhibit 3: Top 10 Shareholders
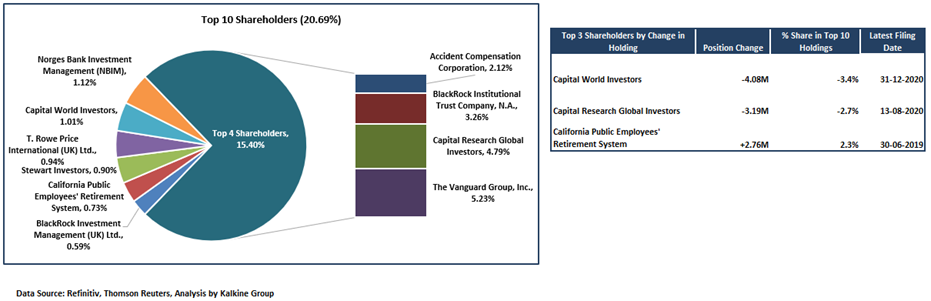
(Source: Refinitiv (Thomson Reuters)), Analysis by Kalkine Group
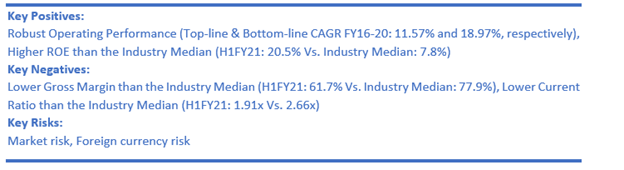
A Quick Look at Key Metrics: The company’s gross margin and EBITDA margin for H1FY21 stood at 61.7% and 37.5%, respectively reflecting strong operating efficiency. The company has witnessed an improvement in liquidity profile which could help the company moving forward.
Exhibit 4: Key Metrics
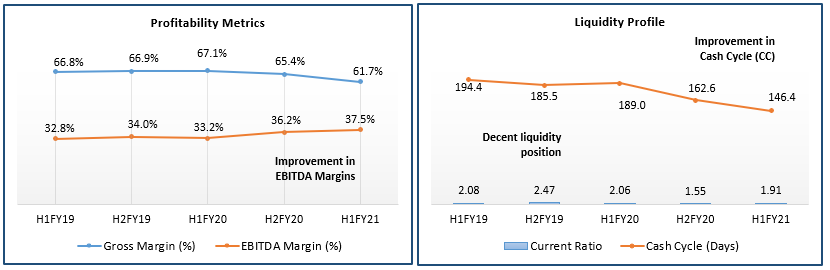
(Source: Refinitiv (Thomson Reuters)), Analysis by Kalkine Group
Outlook:
Performance of nine months of the company reflects on robust demand for the company’s products. The company expects hospital hardware sales and usage to continue to increase. However, it expects OSA diagnosis in Homecare to reduce going ahead which would likely be offset by strong growth in its product use for nasal high flow therapy in the home. The company has also resolved to continue to accelerate investment in manufacturing capacity.
The company expects revenue and net profit after tax for FY21 to be higher than the previous assumptions. The company at the time of the release of its interim results had provided its guidance on FY21 operating revenue to be ~$1.72 billion and net profit after tax to be between ~$400 million to ~$415 million. This guidance was based on exchange rates of NZD:USD 0.69 and NZD:EUR 0.58.
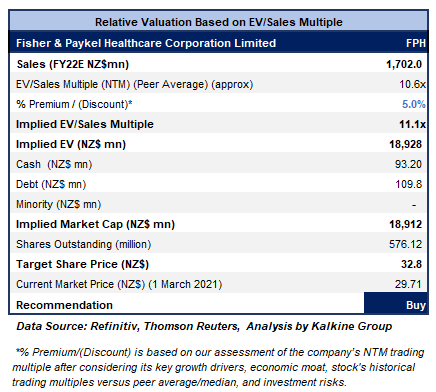
Valuation Methodology: EV/Sales Based Relative Valuation (Illustrative)
Technical Overview:
Weekly Chart –
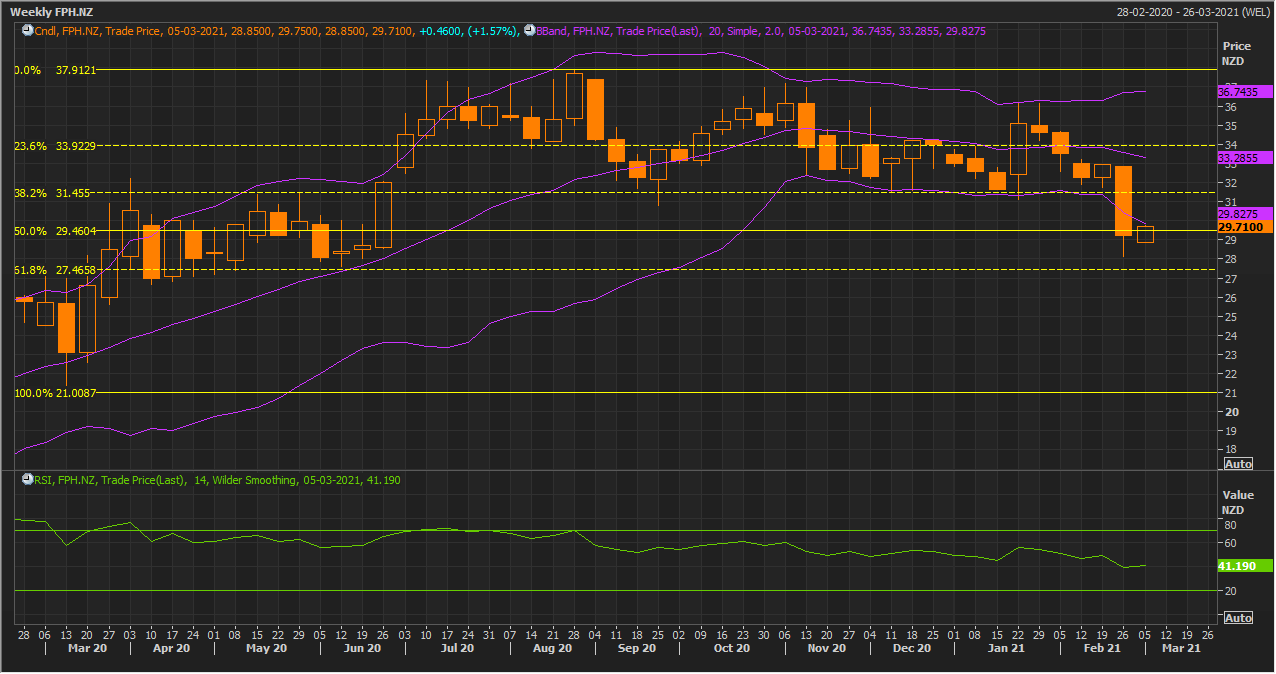
Source: Refinitiv (Thomson Reuters)
Note: Purple colour lines are Bollinger Bands® with the upper band suggesting overbought status while the lower band oversold status, and yellow lines are Fibonacci retracement lines which measure price rebound and backtrack. https://www.bollingerbands.com/
After a sharp sell-off in the previous week, the stock has given a stronger close on the first trading session of the ongoing week, forming the chart pattern which resembles a ‘Bullish Harami’ pattern. The technical indicator RSI with a reading around 41 and a flattish curve at the end, points at flattening of neutral momentum for the stock.
Going forward, the stock may have resistance around the 38.2% retracement level of $31.45 whereas support could be around the previous week’s low of $28.00.
Stock Recommendation:
The company has a strong balance sheet which enables it to invest in manufacturing capacity. It also enjoys a healthy demand for its products across the segments. The stock of FPH has witnessed a rise of ~14.97% in the time span of previous one year.
We have applied EV/Sales multiple Based relative valuation (on an illustrative basis) and the target price reflects a rise of low double-digit (in % terms). We have applied a slight premium to EV/Sales (NTM) (Peer Average) considering its decent outlook as the company is anticipating that revenue and net profit after tax for the 2021 financial year might be higher than implied by the previous assumptions.
Considering the aforesaid facts, we give a “Buy” recommendation on the stock at the current market price of NZ$29.710 per share, up by 1.57% on March 1, 2021.
.png)
FPH Daily Technical Chart (Source: Refinitiv (Thomson Reuters))
Disclaimer
Kalkine New Zealand Limited is authorised to provide class advice only. The information on this site does not take into account any of your investment objectives, financial situation or needs. Before you make a decision about whether to acquire a financial product, you should obtain the Product Disclosure Statement from the product issuer. You should consider the appropriateness of advice taking into account your own objectives, financial situation and needs and seek independent financial advice before making any financial decisions.
Past performance is not a reliable indicator of future performance.
 Please wait processing your request...