
Section 1: Company Overview and Fundamentals
1.1 Company Overview:
First Commonwealth Financial Corporation (NYSE: FCF) is a financial holding company. The Company’s operating subsidiaries include First Commonwealth Bank (the Bank), First Commonwealth Insurance Agency, Inc. (FCIA) and FRAMAL. It provides a diversified array of consumer and commercial banking services through its subsidiary, FCB.
Kalkine’s Dividend Income Report covers the Company Overview, Key positives & negatives, Investment summary, Key investment metrics, Top 10 shareholding, Business updates and insights into company recent financial results, Key Risks & Outlook, Price performance and technical summary, Target Price, and Recommendation on the stock.
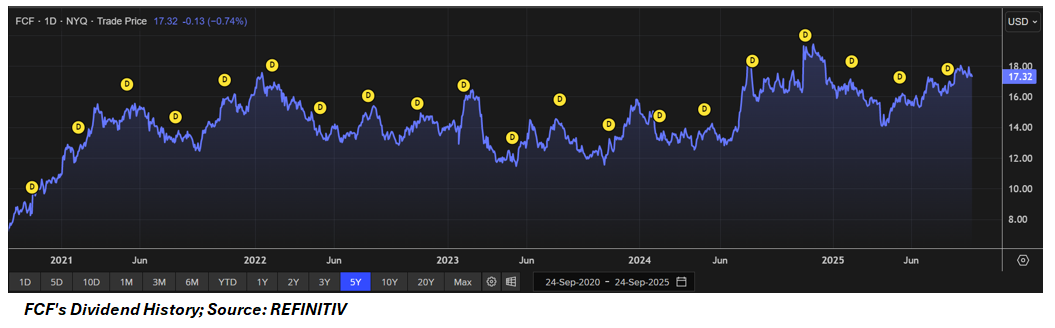
Price Performance:
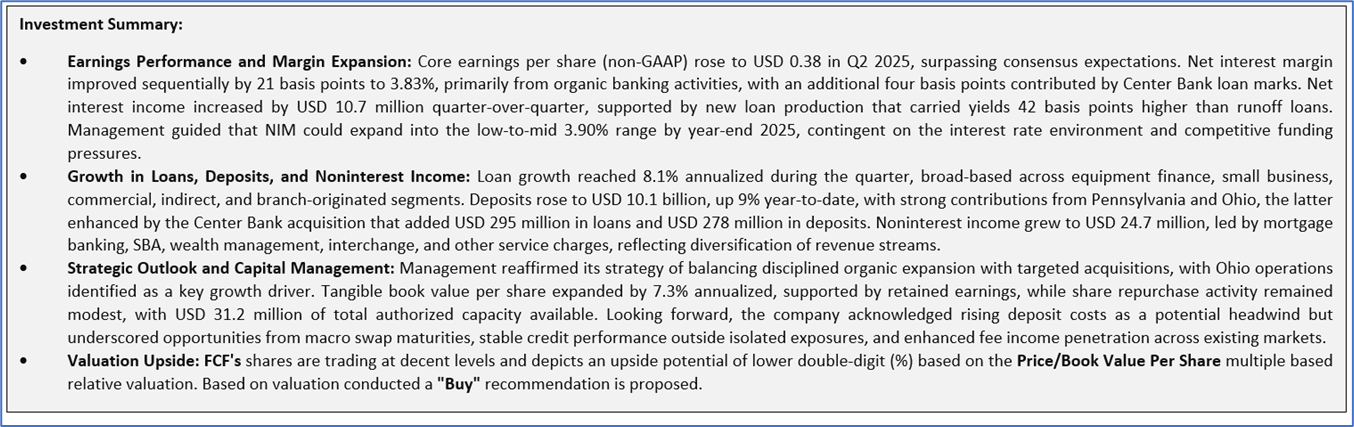
The Key Positives, Negatives, and Investment summary
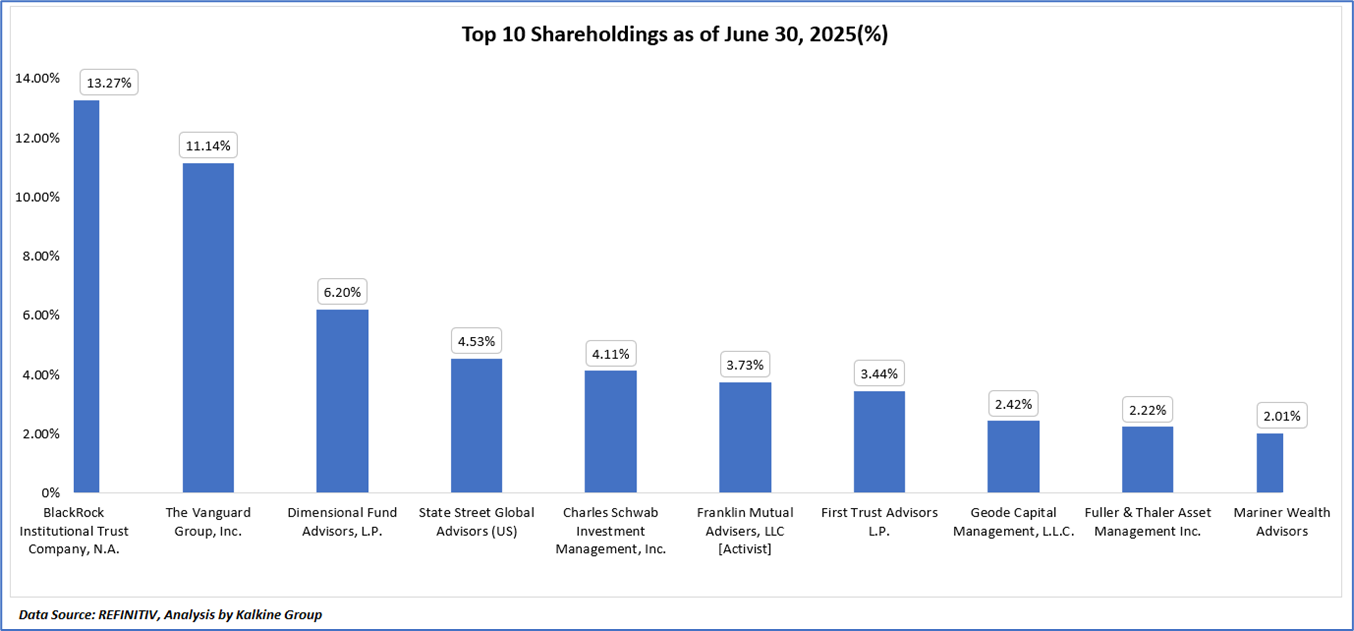
1.3 Top 10 shareholders:
The top 10 shareholders together form 53.07% of the total shareholding, signifying concentrated shareholding. BlackRock Institutional Trust Company, N.A., and The Vanguard Group, Inc., Inc. are the biggest shareholders, holding the maximum stake in the company at ~13.27% and ~11.14%, respectively.
1.4 Dividend payments with impressive dividend yield:
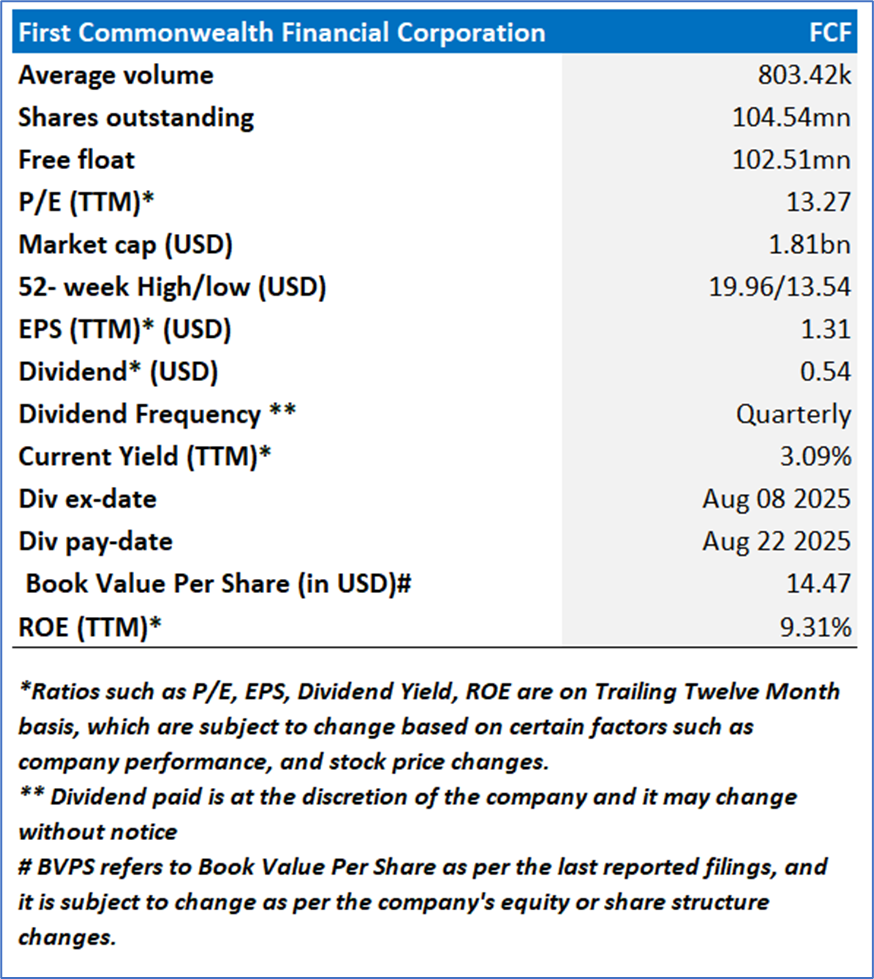
First Commonwealth Financial Corporation (FCF) maintains a consistent and shareholder-friendly dividend policy, as evidenced by its recent declaration of a quarterly common stock dividend of USD 0.135 per share, marking a 3.9% increase from the second quarter of 2024, payable on August 22, 2025, to shareholders of record as of August 8, 2025, with a projected annual yield of 3.3% based on the July 28, 2025, closing market price of USD 16.31. This reflects the company's commitment to returning value to investors, supported by a history of stable dividend payments that have grown modestly over time, underpinned by robust capital ratios of 14.4% (Total), 12.7% (Tier I), 10.7% (Leverage), and 12.0% (Common Equity Tier I) as of June 30, 2025, all exceeding Basel III requirements. Additionally, the Board of Directors' authorization of a USD 25 million share repurchase program on July 29, 2025, further demonstrates FCF's strategy to enhance shareholder value through both dividends and capital management, leveraging its strong financial position to balance reinvestment with returns. Historically, FCF has prioritized maintaining a sustainable payout ratio, adjusting dividends in line with earnings growth and economic conditions, which has fostered investor confidence in its long-term stability as a community bank.
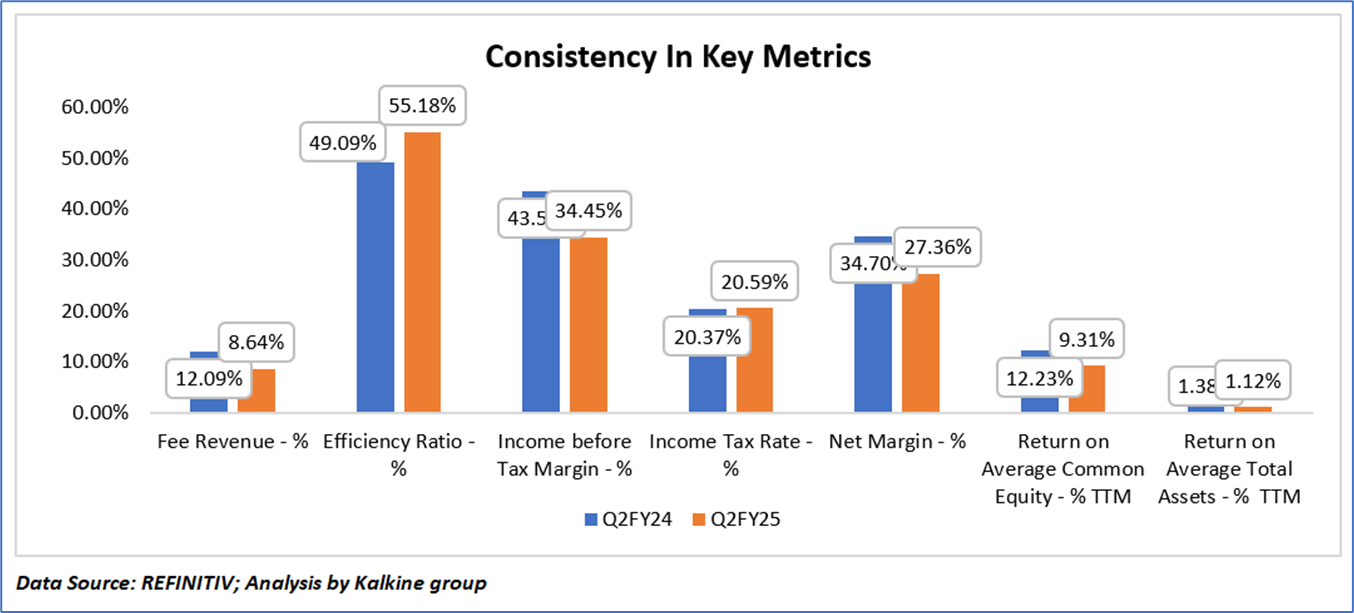
1.5 Key Metrics
First Commonwealth Financial Corporation (FCF) exhibits a mixed financial performance when comparing key metrics from Q2 FY24 to Q2 FY25, reflecting both challenges and areas of resilience. Fee revenue as a percentage of total income declined from 12.09% in Q2 FY24 to 8.64% in Q2 FY25, suggesting a potential reduction in noninterest income streams, possibly due to competitive pressures or the full implementation of the Durbin amendment impacting interchange fees. The efficiency ratio deteriorated from 49.09% to 55.18%, indicating a rise in operating expenses relative to revenue, which may be attributed to integration costs from the Center Bank acquisition and higher salaries, potentially straining cost management efforts. Income before tax margin contracted significantly from 43.58% to 34.45%, and net margin decreased from 34.70% to 27.36%, driven by increased provision expenses (USD 12.6 million in Q2 2025) and a slight uptick in the income tax rate from 20.37% to 20.59%, reflecting a challenging profitability environment. Over the trailing twelve months (TTM), return on average common equity fell from 12.23% to 9.31%, and return on average total assets dropped from 1.38% to 1.12%, signaling a decline in overall return efficiency, likely influenced by the USD 40.1 million increase in nonperforming loans and margin compression from higher deposit costs, though the company’s strong capital ratios (e.g., 14.4% Total Capital) and deposit growth to USD 10.1 billion provide a foundation for potential recovery with strategic adjustments.
Section 2: Business Updates and Financial Highlights
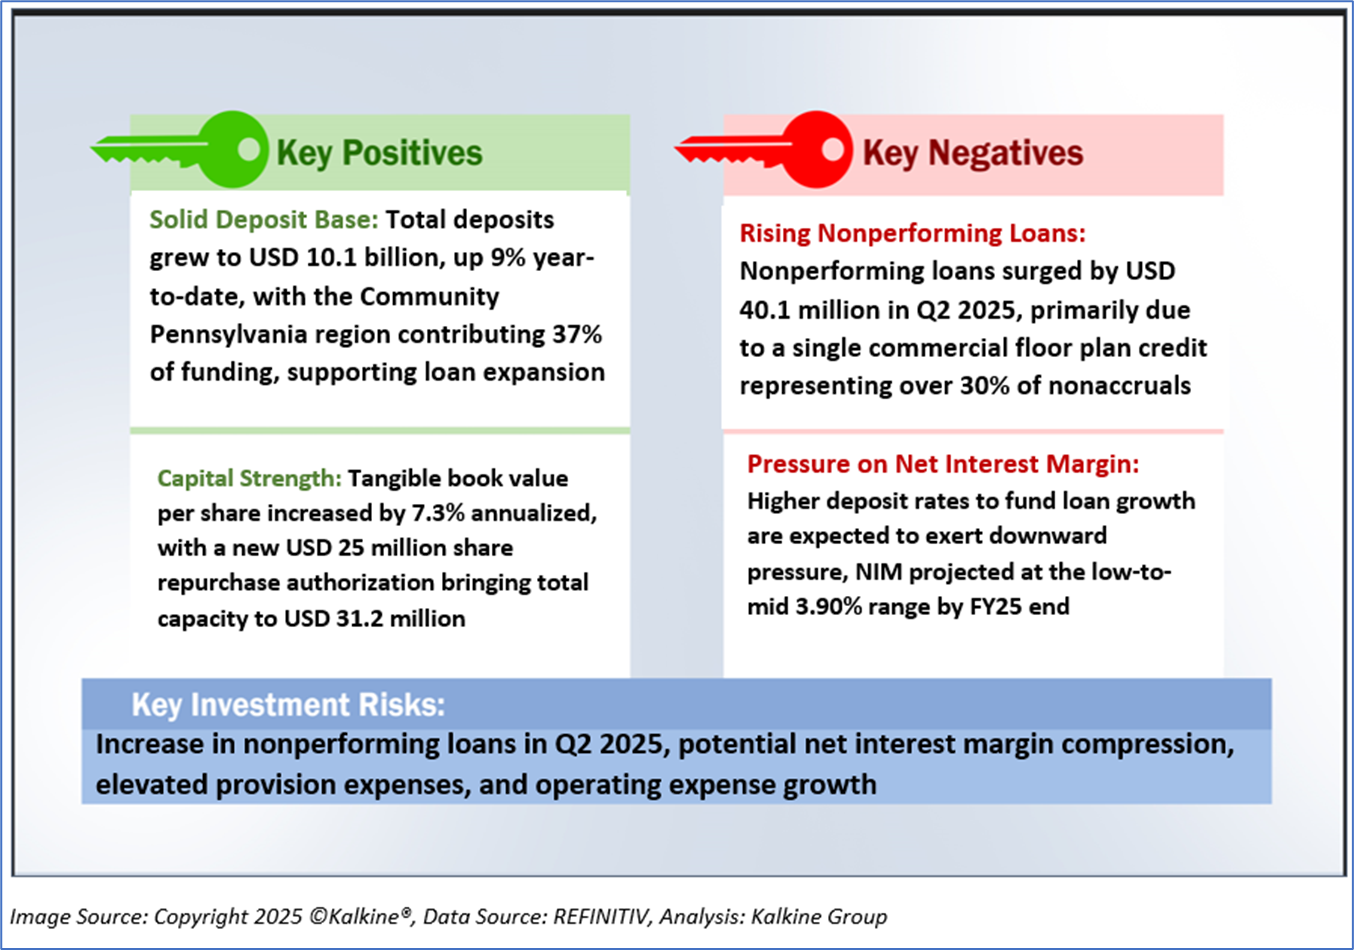
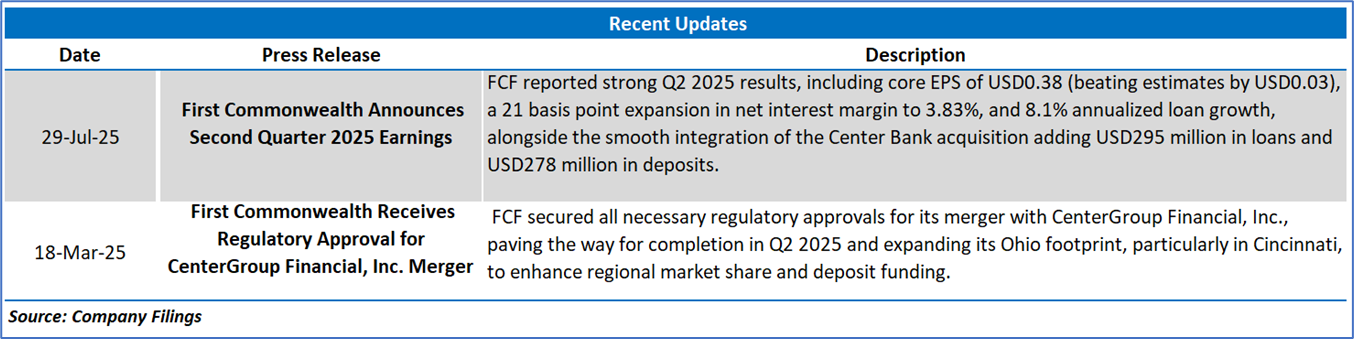
2.1 Recent Updates:
The below picture gives an overview of the recent updates:
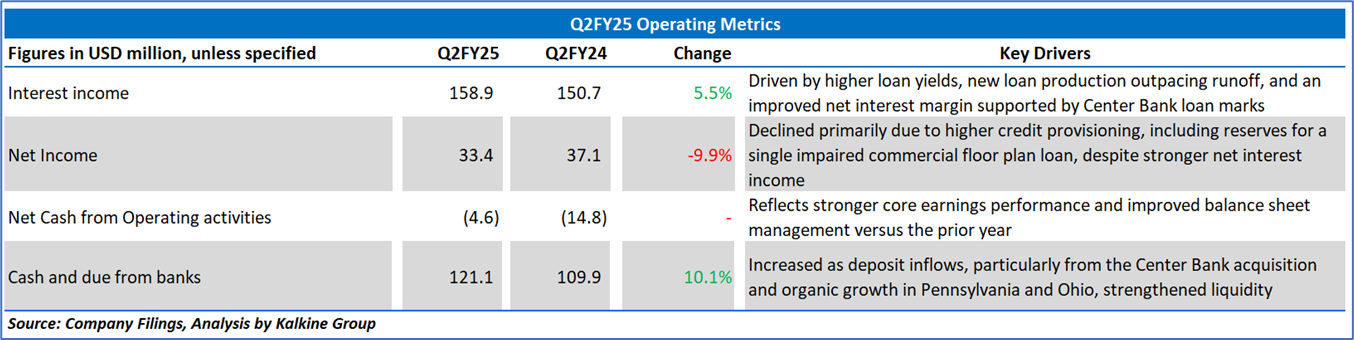
2.2 Insights of Q2FY25:
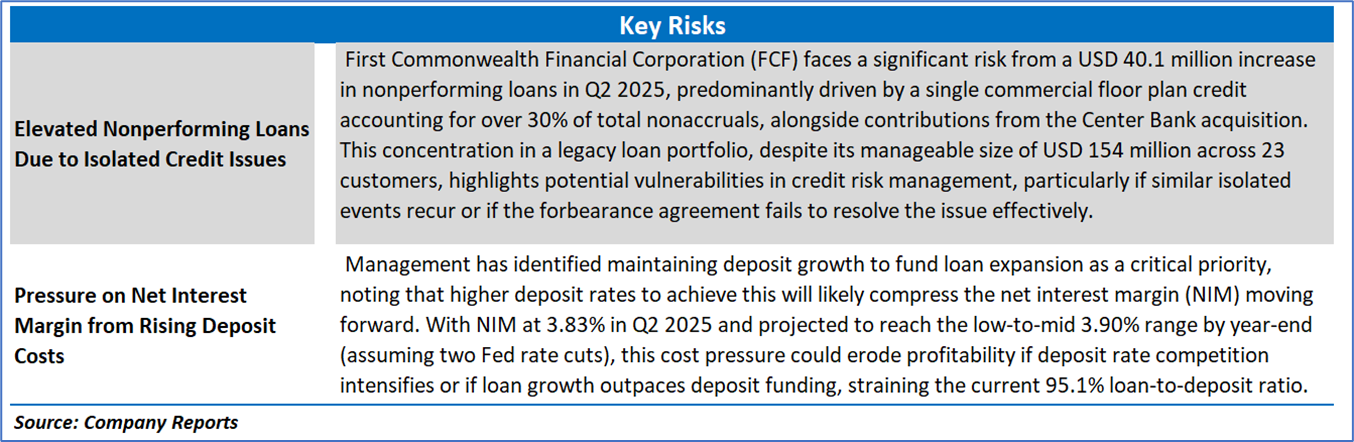
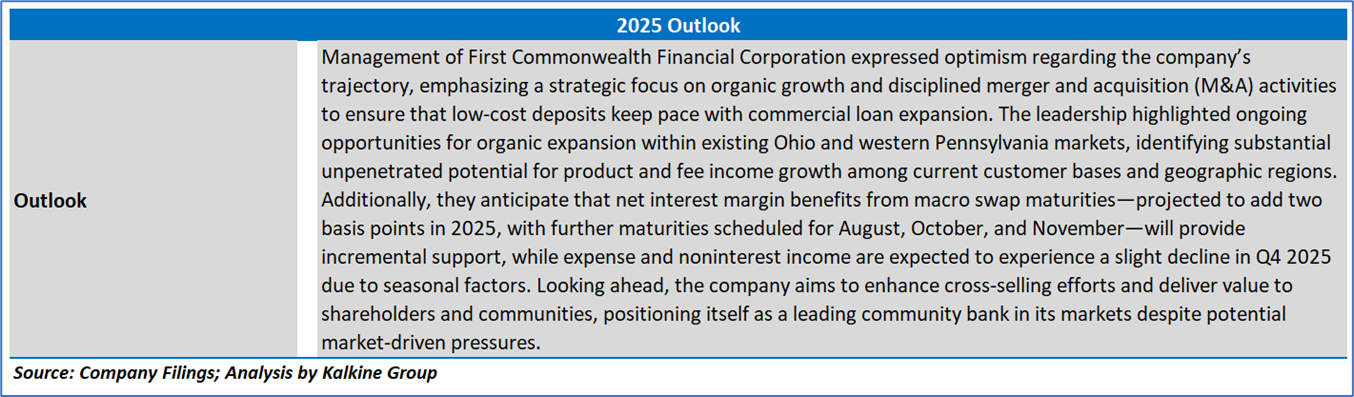
Section 3: Key Risks and Outlook:
Section 4: Stock Recommendation Summary:
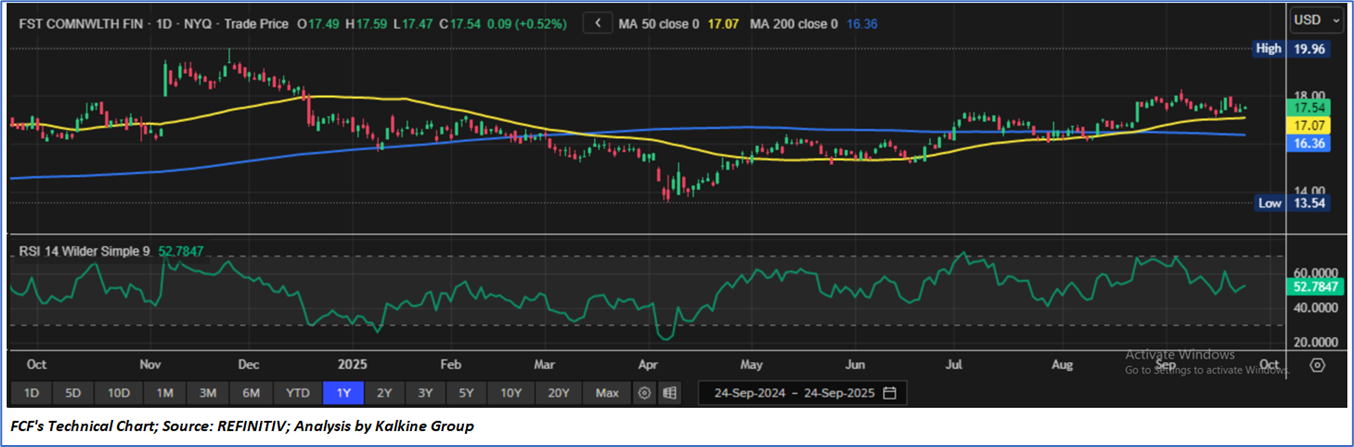
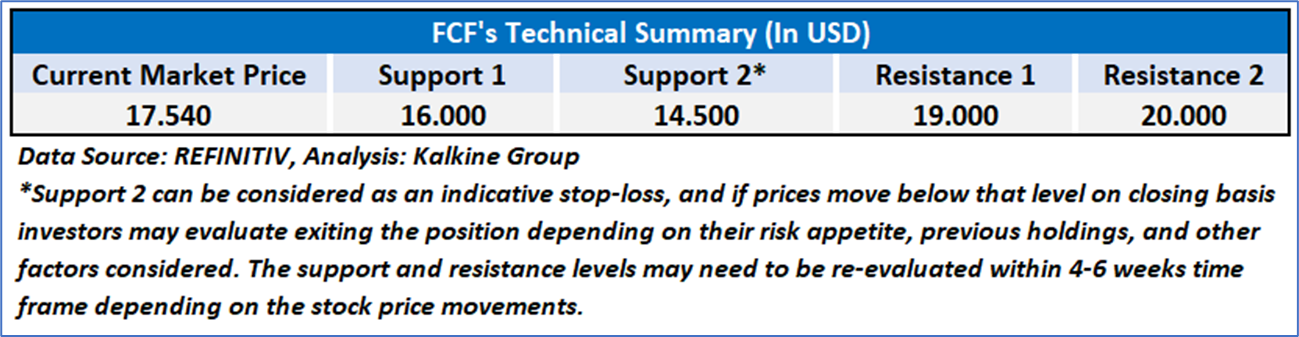
4.1 Technical Summary:
Price Performance:
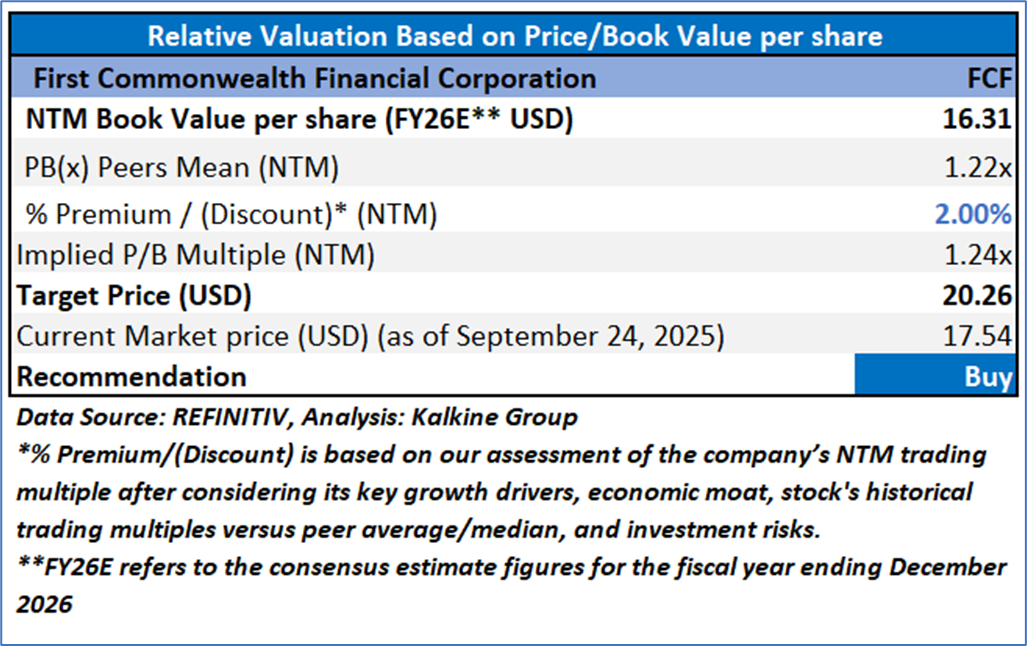
4.2 Fundamental Valuation
Valuation Methodology: Price/Book Value Per Share Multiple Based Relative Valuation
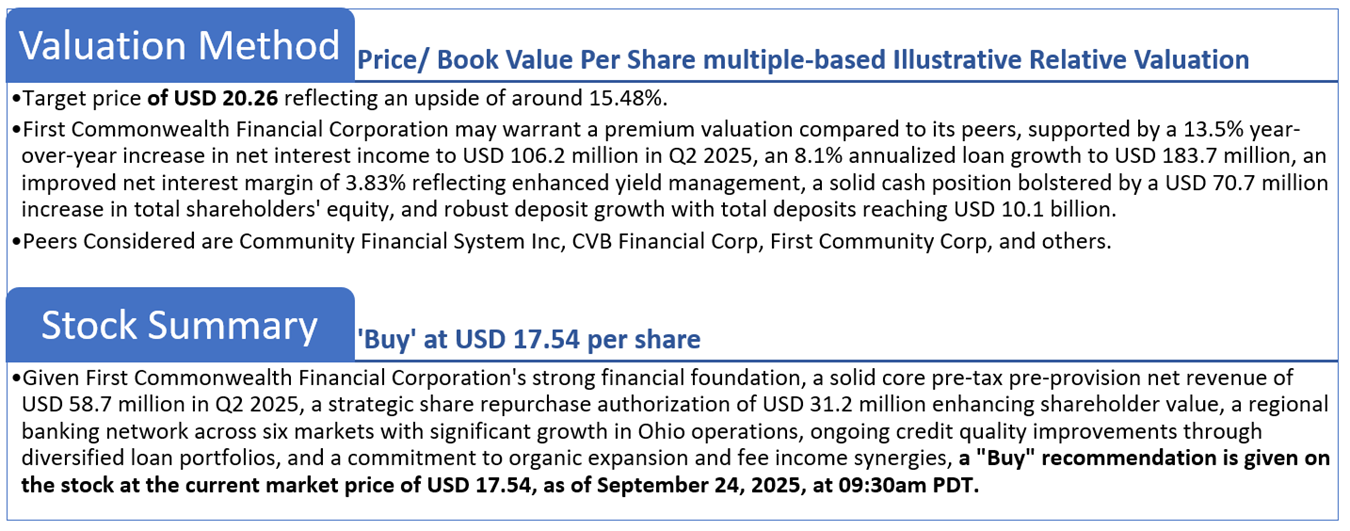
Markets are trading in a highly volatile zone currently due to certain macroeconomic issues and geopolitical tensions prevailing. Therefore, it is prudent to follow a cautious approach while investing.
Note 1: Past performance is not a reliable indicator of future performance.
Note 2: The reference date for all price data, currency, technical indicators, support, and resistance levels is September 24, 2025. The reference data in this report has been partly sourced from REFINITIV.
Note 3: Investment decisions should be made depending on an individual's appetite for upside potential, risks, holding duration, and any previous holdings. An 'Exit' from the stock can be considered if the Target Price mentioned as per the Valuation and or the technical levels provided has been achieved and is subject to the factors discussed above.
Note 4: The report publishing date is as per the Pacific Time Zone.
Technical Indicators Defined: -
Support: A level at which the stock prices tend to find support if they are falling, and a downtrend may take a pause backed by demand or buying interest. Support 1 refers to the nearby support level for the stock and if the price breaches the level, then Support 2 may act as the crucial support level for the stock.
Resistance: A level at which the stock prices tend to find resistance when they are rising, and an uptrend may take a pause due to profit booking or selling interest. Resistance 1 refers to the nearby resistance level for the stock and if the price surpasses the level, then Resistance 2 may act as the crucial resistance level for the stock.
Stop-loss: It is a level to protect against further losses in case of unfavorable movement in the stock prices.
Disclaimer This report has been issued by Kalkine New Zealand Limited (FSP691351) (NZBN:9429047678101) (“Kalkine”). Kalkine is a Financial Advice Provider (“FAP”) and is authorised by a Class 1 Financial Advice Provider Licence issued by Financial Markets Authority (“FMA”) to provide financial advice. Kalkine provides only general financial advice through its research reports following a person becoming a member. The reports contain buy/sell/hold and other recommendations in relation to equity securities, managed funds and other managed investment schemes and other financial advice products. The recommendations and opinions in this report and on Kalkine website do not take into account any of your investment objectives, financial situation or needs. Before you make a decision about whether to acquire a financial product, you should obtain the Product Disclosure Statement from the product issuer. You should consider the appropriateness of advice taking into account your own objectives, financial situation and needs and seek independent financial advice before making any financial decisions. If you act on the advice in the research reports, you may have to pay fees, expenses or other amounts (but not to Kalkine). Further information about the complaints and dispute resolution process, as well as information about Kalkine’s duties are available on Kalkine’s website. Please read our Financial Advice Provider (FAP) disclosure statement and Complaints Handling Guide, which are available on the website.
Past performance is not a reliable indicator of future performance.
 Please wait processing your request...