This report is an updated version of the report published on 31 October 2025 at 11:38 AM AEDT.
Section 1: Company Overview, Low Carbon Emission Initiatives and Fundamental Insights
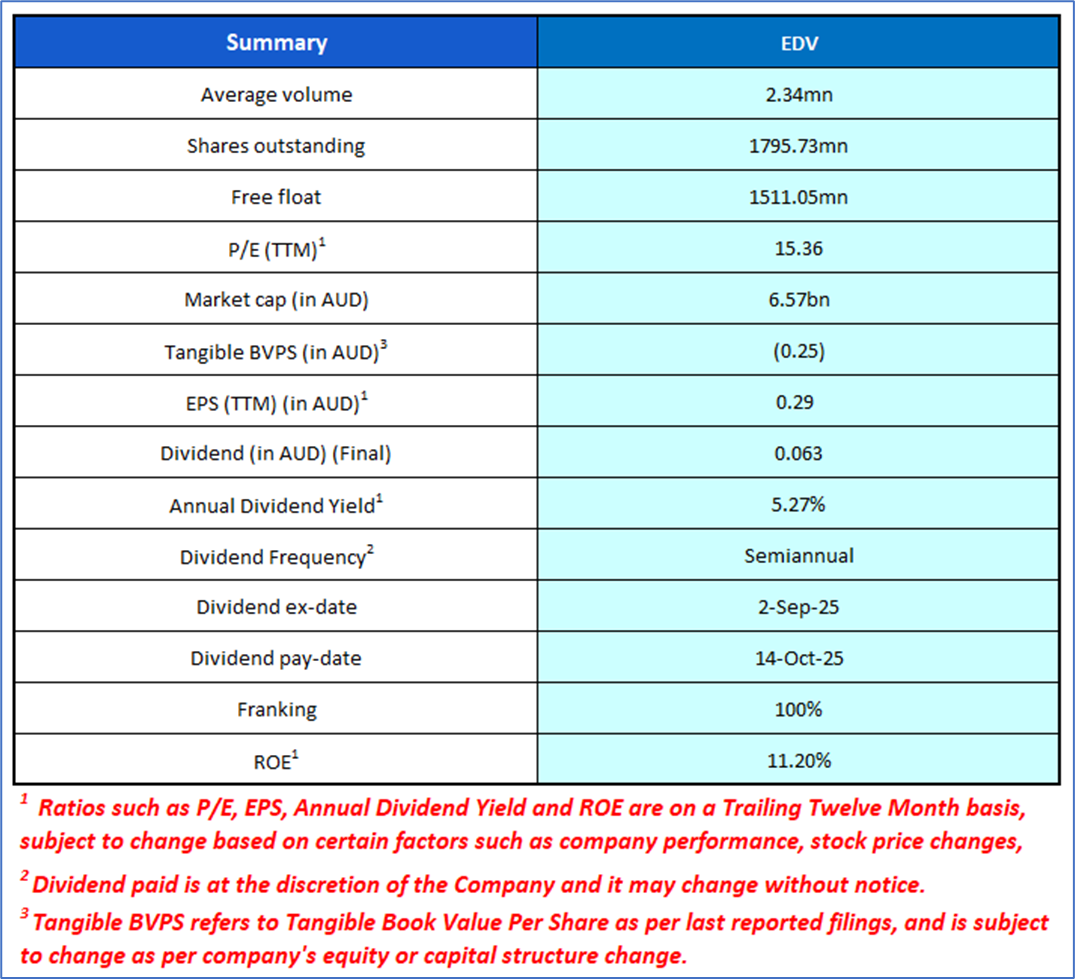
Section 1.1: Endeavour Group Limited (ASX: EDV) is Australia’s retail drinks and hospitality business. It operates well-known brands including Dan Murphy’s, BWS, ALH Hotels, and Pinnacle Drinks, supported by over 30,000 employees across Australia and New Zealand. Kalkine’s Low Carbon Research Report covers the Investment Highlights, Low Carbon Emission Initiatives, Key Financial Metrics, Risks, and Technical Analysis along with the Valuation, Target Price, and Recommendation on the stock.
Section 1.2: Why Low Carbon Emission Matters?
The shift toward a low-carbon economy is one of the most significant challenges of current time, spurred by the urgent need to combat climate change and reduce the environmental impact of corporate activities. This report covers the ASX-listed low-carbon emission company, Endeavour Group Ltd (ASX: EDV), that is committed to sustainability and responsible environmental practices.
Carbon and Waste Management - Key Metrics
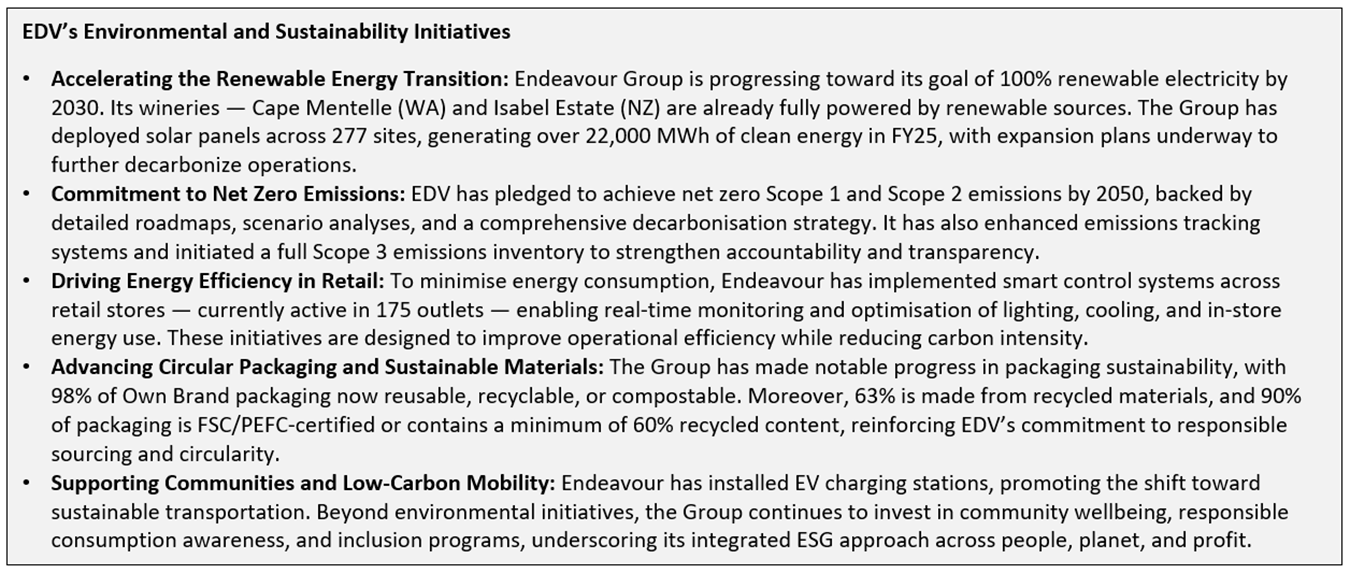
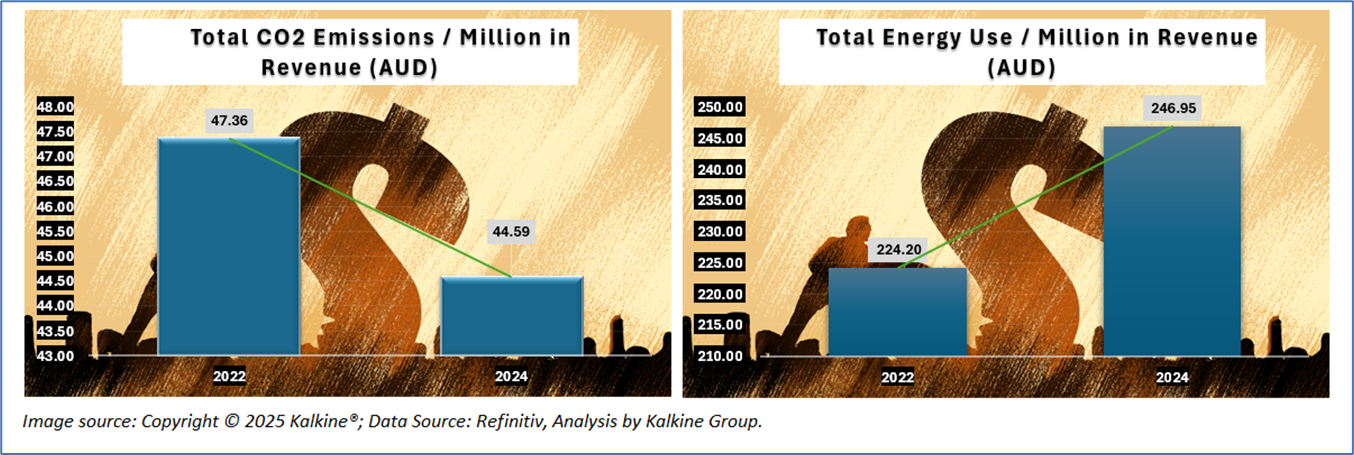
The image below highlights Endeavour Group’s total CO₂ emissions per million in revenue decreased from 47.36 in 2022 to 44.59 in 2024, reflecting roughly a 5.8% reduction. The reduction aligns with EDV’s sustainability roadmap—particularly its renewable energy adoption and solar power expansion across 277 sites, as well as efficiency gains from energy-smart control systems and refrigeration upgrades. It signals progress toward the company’s 2050 net zero target for Scope 1 and 2 emissions.
In contrast, total energy use per million in revenue rose from 224.20 in 2022 to 246.95 in 2024, indicating an approximate 10.1% increase. This rise could be attributed to several factors:
Thus, while total energy use grew, the carbon impact per unit of energy declined, suggesting a cleaner energy mix and improved emissions management.
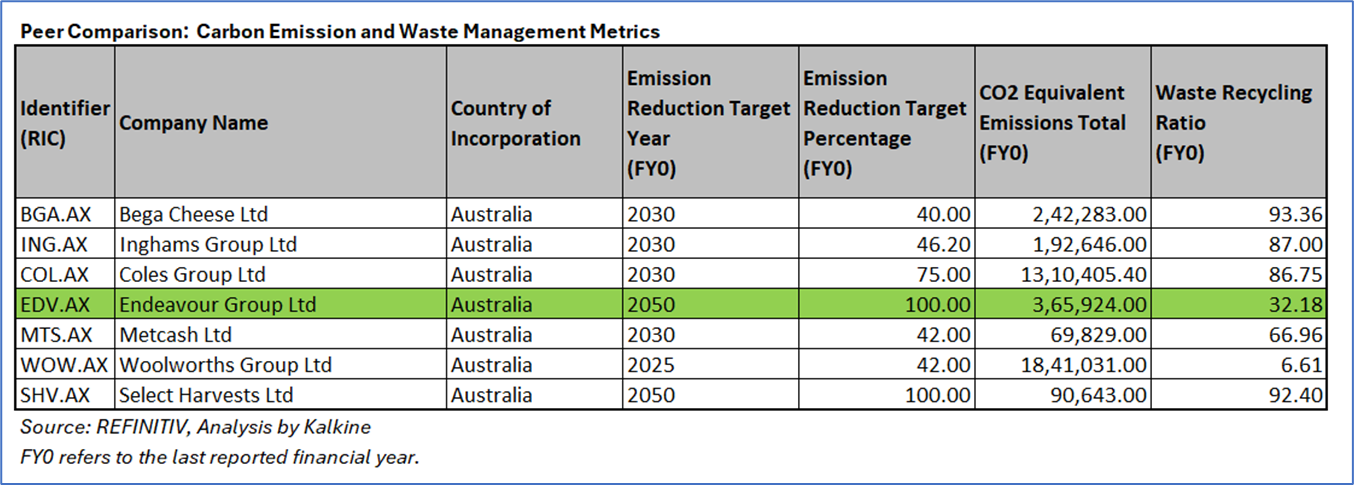
Peer Comparison: Carbon Emission and Waste Management Metrics
The peer comparison chart below highlighted that Endeavour Group as set one of the most ambitious carbon reduction goals among its Australian retail and hospitality peers — targeting 100% emissions reduction (net zero) by 2050, aligning with its long-term sustainability roadmap outlined in the 2025 Sustainability Report. While EDV’s total CO₂ equivalent emissions of ~365,924 tonnes remain higher than most peers due to its extensive retail and hotel operations, the company’s proactive decarbonisation measures — including 277 solar-enabled sites, transition to renewable electricity by 2030, and energy efficiency programs in 175 stores — demonstrate tangible progress toward lowering carbon intensity. Its waste recycling ratio of 32.18%, however, trails major retailers like Coles and Woolworths, reflecting the greater challenge of achieving circularity across diversified venues such as hotels, liquor stores, and production units. EDV’s sustainability initiatives — particularly its 98% recyclable Own Brand packaging and expanded recycling partnerships — indicate that waste recovery and circular packaging remain key focus areas to elevate performance closer to top-tier industry benchmarks.
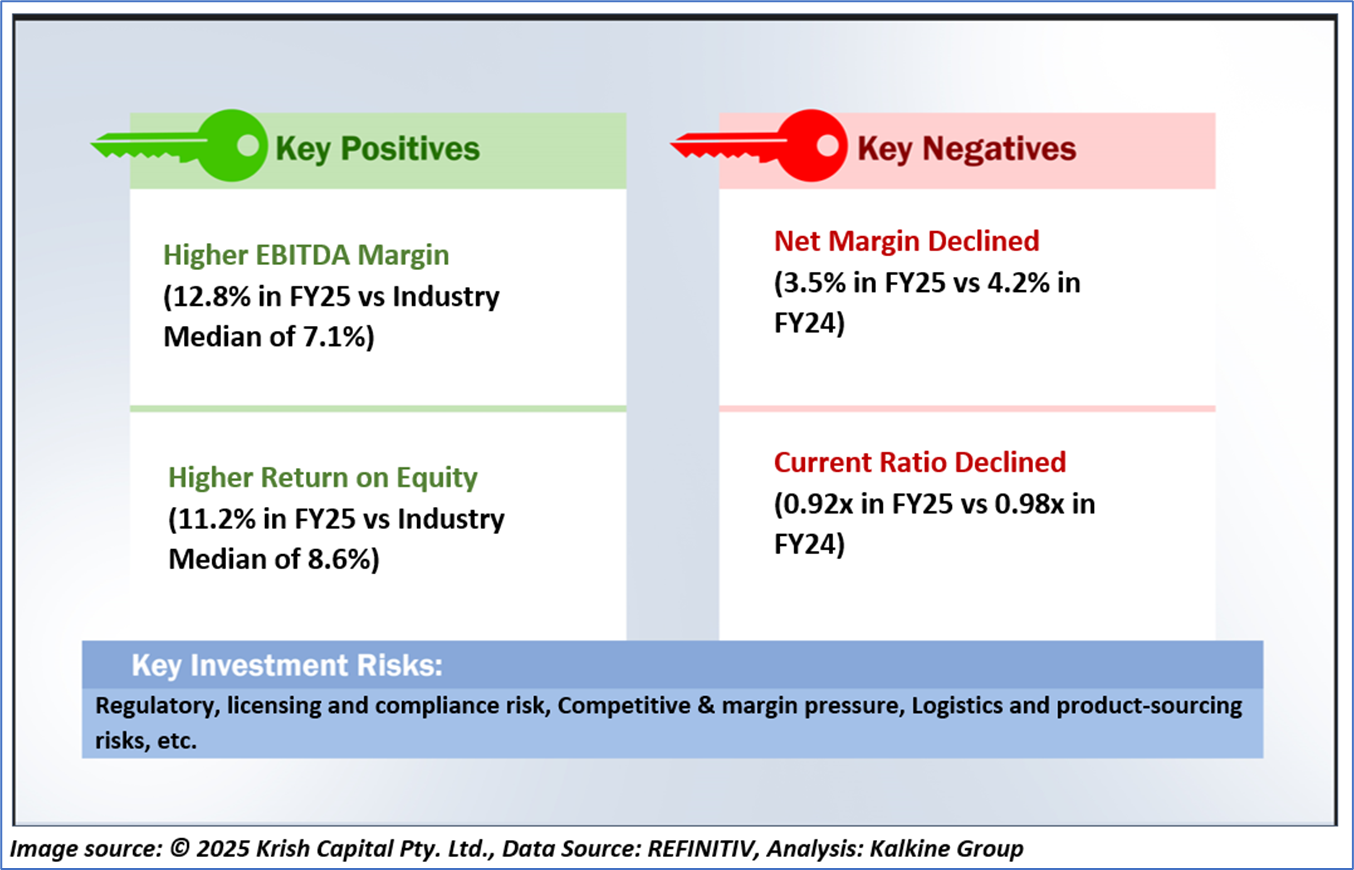
1.3 The Key Positives, Negatives, Investment Highlights, and Risks
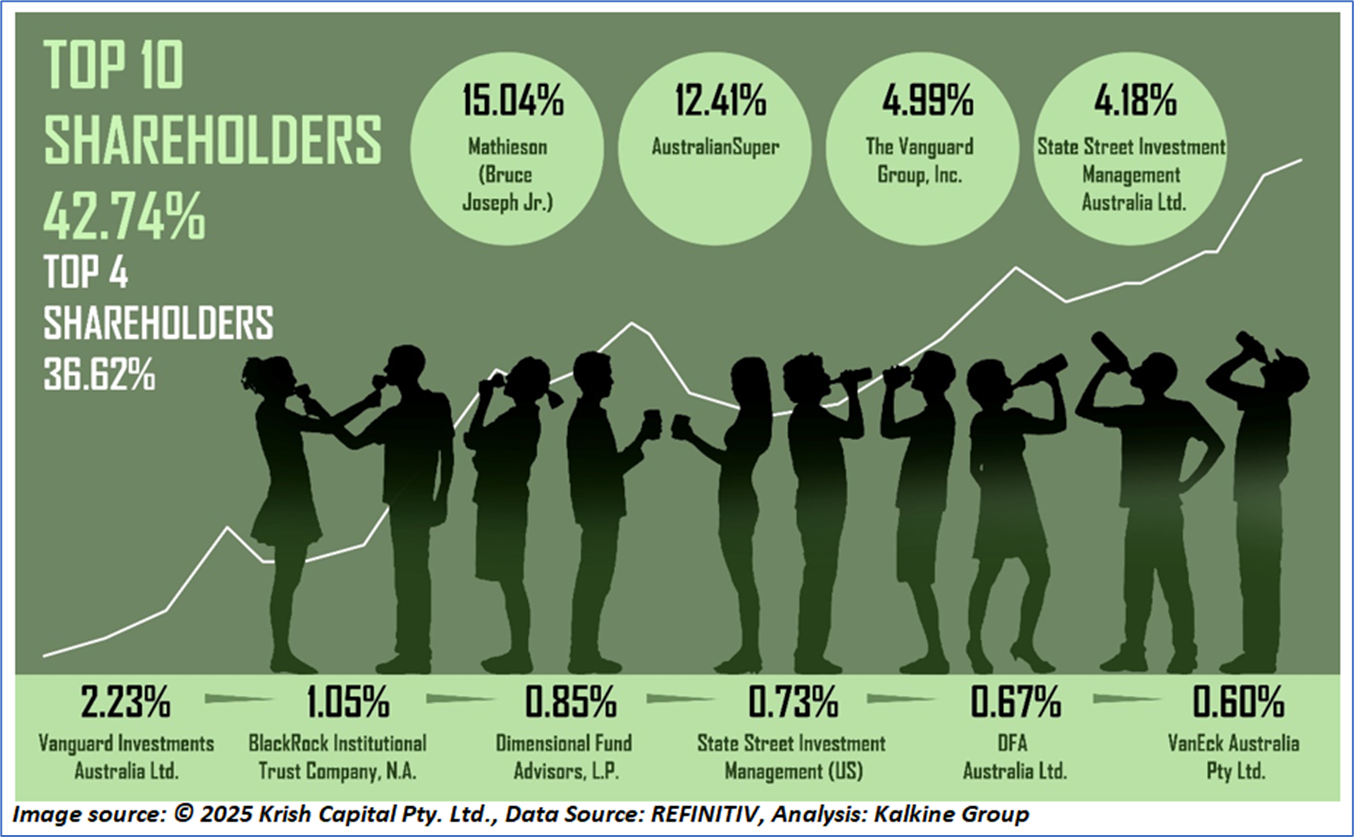
1.4 Top 10 Shareholders:
The top 10 shareholders together form ~42.74% of the total shareholding. Mathieson (Bruce Joseph Jr.), and AustralianSuper hold maximum stakes in the company at ~15.04% and ~12.41%, respectively.
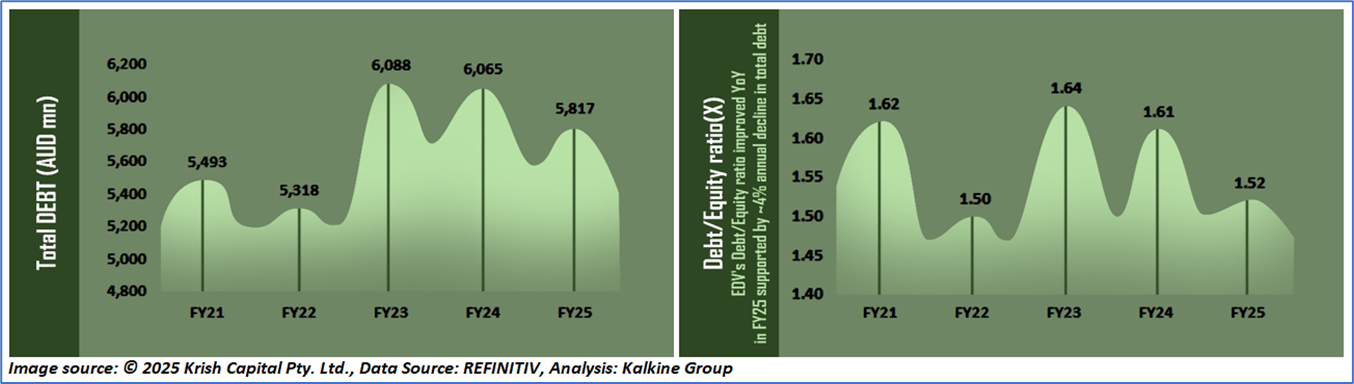
1.5 Key Metrics: In FY25, EDV's cash cycle reduced to 23 days vs 28.9 days in FY24. Below are captured other metrics:
Section 2: Business Updates, Financial and Operational Highlights
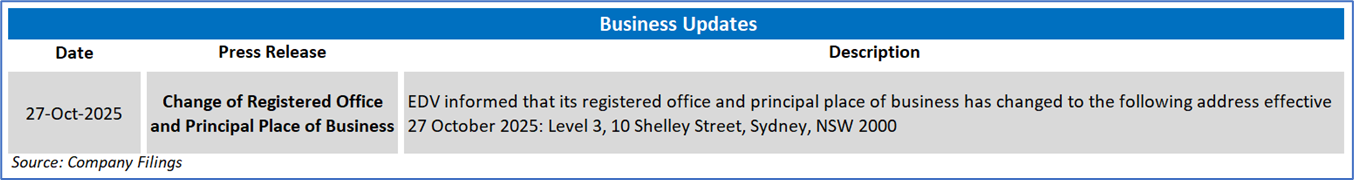
2.1 Recent Business Updates:
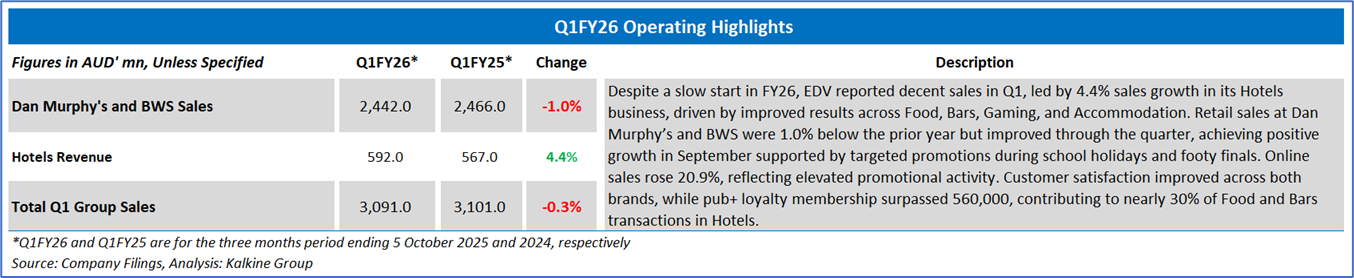
2.2 Results Highlights
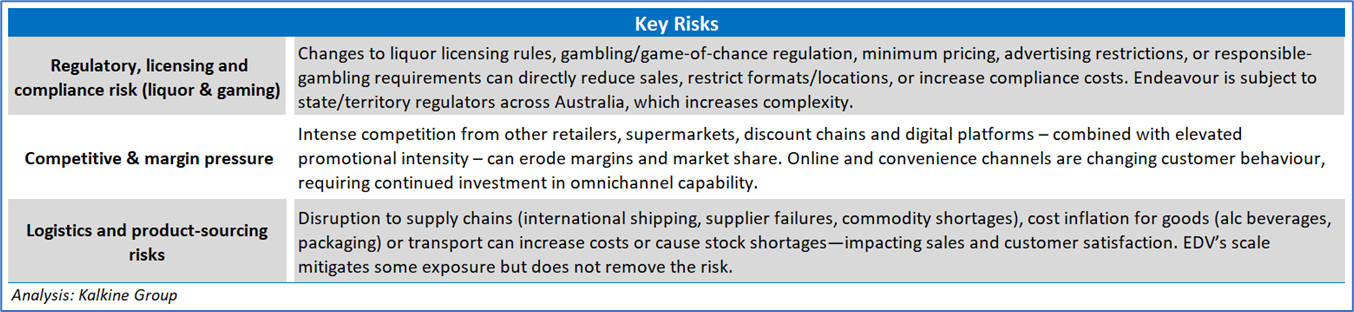
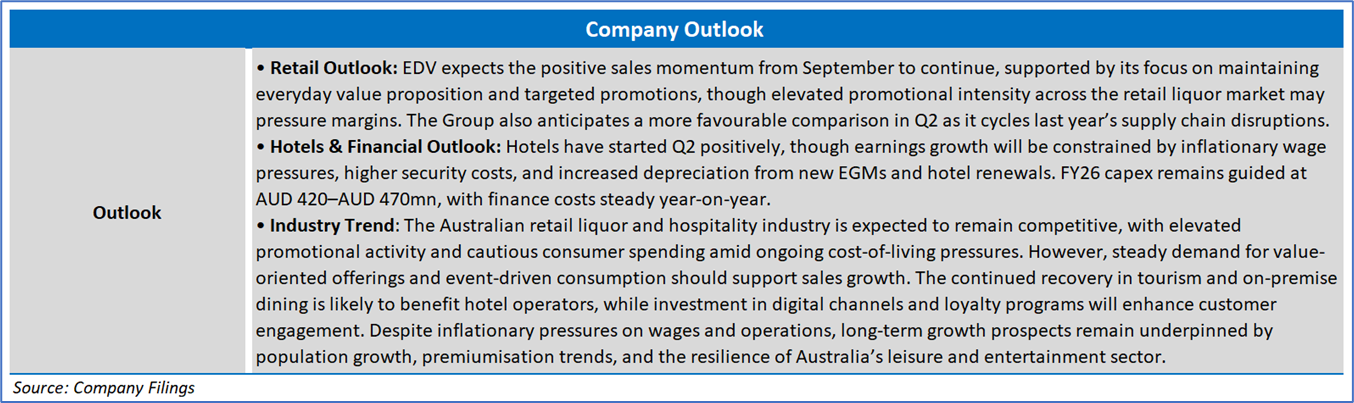
Section 3: Key Risks and Outlook:
Section 4: Stock Recommendation Summary
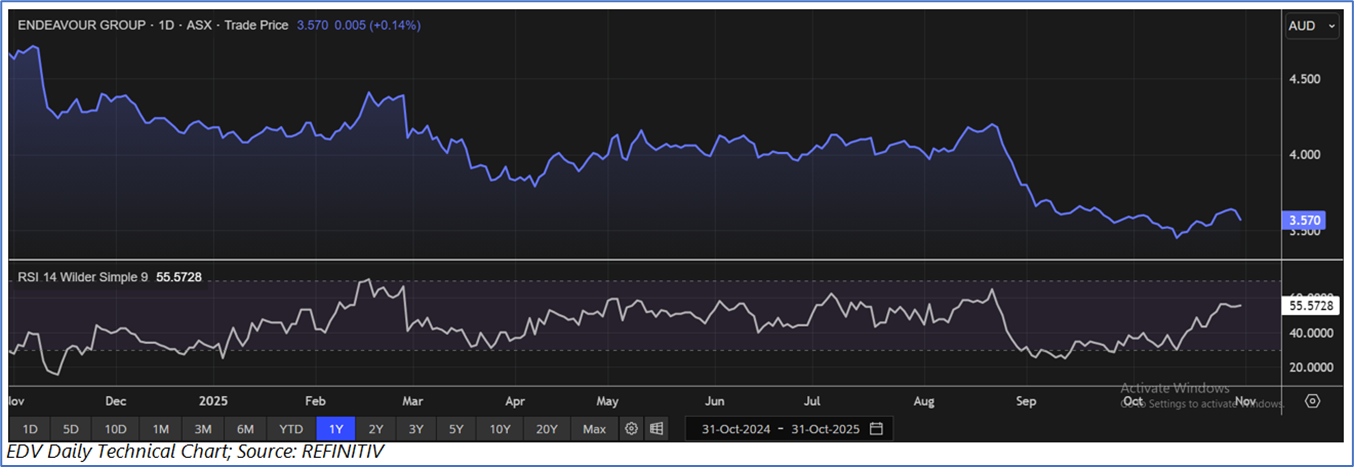
4.1 Price Performance and Technical Summary
The stock price declined by ~1.72% in the last one month, whereas over the last six months, it has declined by ~11.26%. The stock has a 52-week low and 52-week high of AUD 3.450 and AUD 4.770, respectively, and is currently trading close to its 52-week low. EDV was last covered in a report dated ‘5 September 2025’.
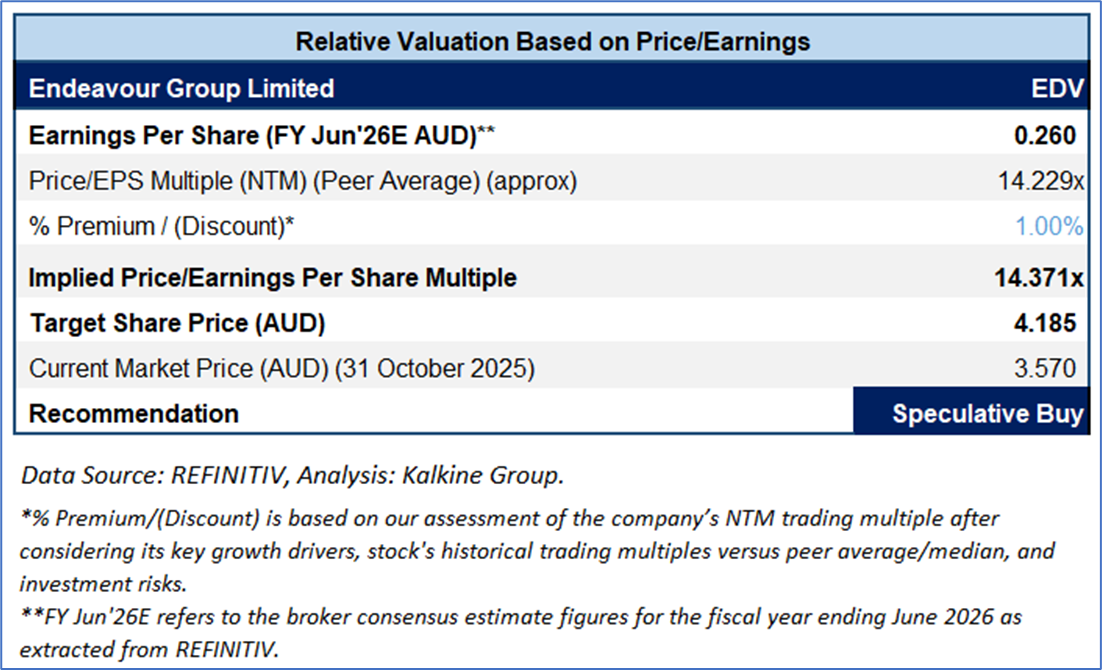
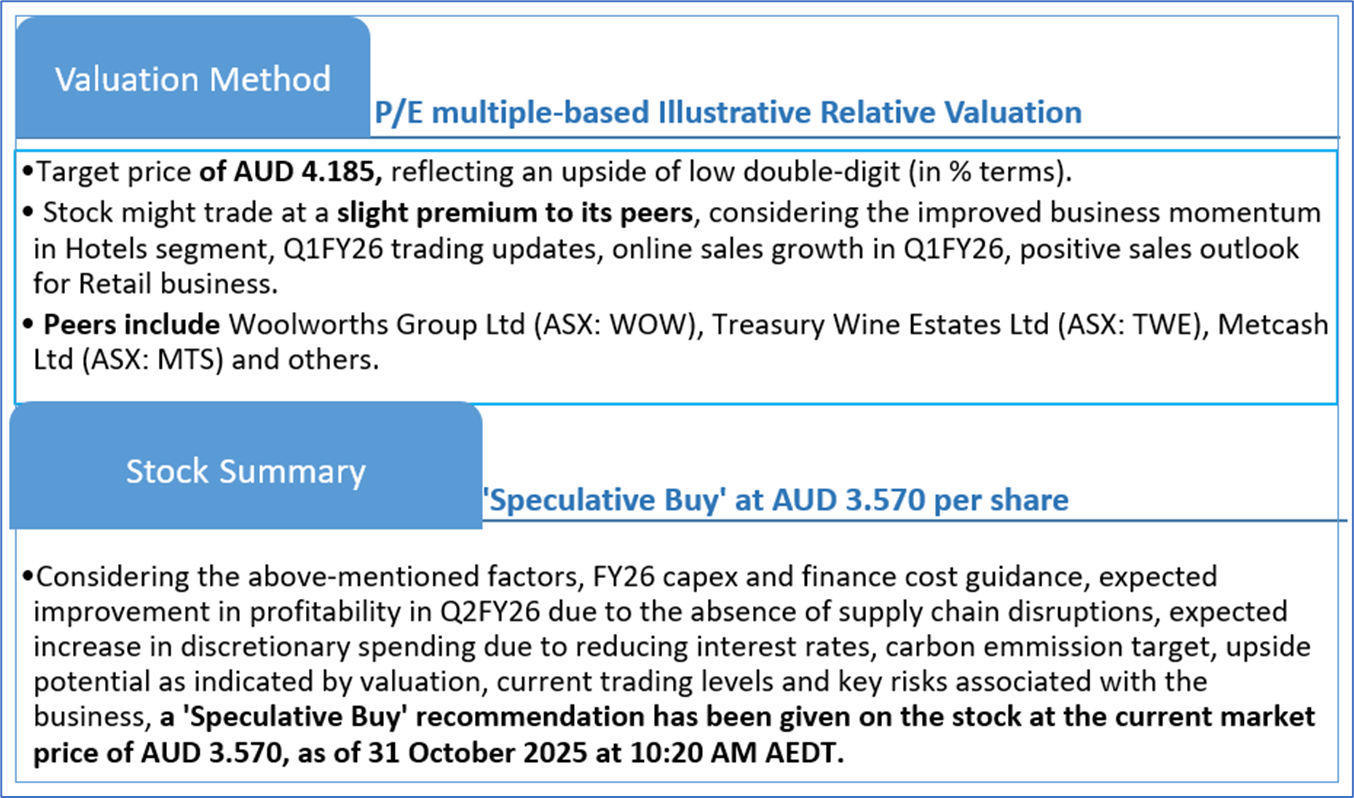
4.2 Fundamental Valuation
Valuation Methodology: P/E Multiple Based Relative Valuation (Illustrative)
Markets are trading in a highly volatile zone currently due to certain macro-economic issues and geopolitical tensions prevailing. Therefore, it is prudent to follow a cautious approach while investing.
Note 1: Past performance is neither an indicator nor a guarantee of future performance.
Note 2: The reference date for all price data, currency, technical indicators, support, and resistance levels is 31 October 2025. The reference data in this report has been partly sourced from REFINITIV.
Note 3: Investment decisions should be made depending on an individual's appetite for upside potential, risks, holding duration, and any previous holdings. An 'Exit' from the stock can be considered if the Target Price mentioned as per the Valuation and or the technical levels provided has been achieved and is subject to the factors discussed above.
Note 4: Dividend Yield may vary as per the stock price movement.
Note 5: Kalkine reports are prepared based on the stock prices captured either from REFINITIV or Trading View. Typically, REFINITIV or Trading View may reflect stock prices with a delay which could be a lag of 25-30 minutes. There can be no assurance that future results or events will be consistent with the information provided in the report. The information is subject to change without any prior notice.
Technical Indicators Defined: -
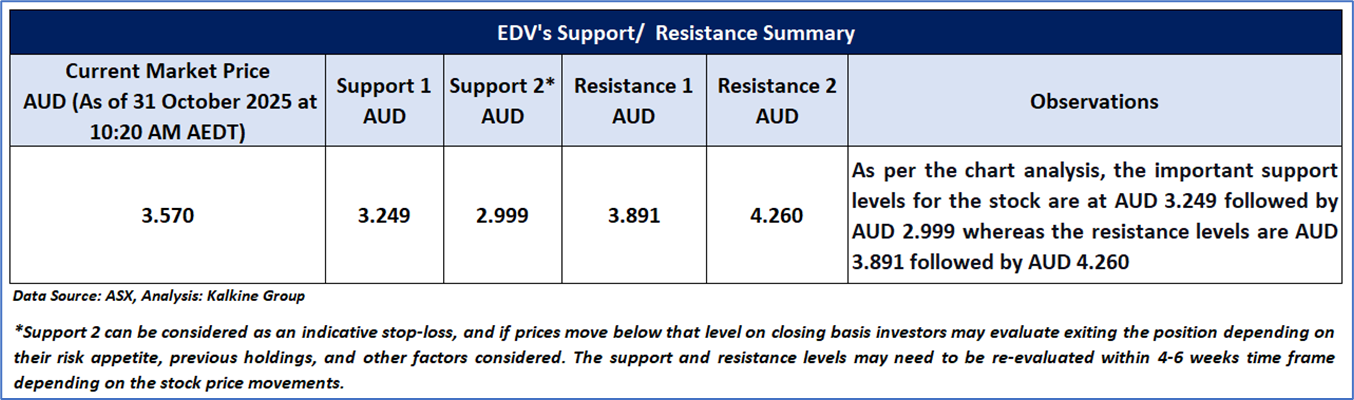
Support: A level at which the stock prices tend to find support if they are falling, and a downtrend may take a pause backed by demand or buying interest. Support 1 refers to the nearby support level for the stock and if the price breaches the level, then Support 2 may act as the crucial support level for the stock.
Resistance: A level at which the stock prices tend to find resistance when they are rising, and an uptrend may take a pause due to profit booking or selling interest. Resistance 1 refers to the nearby resistance level for the stock and if the price surpasses the level, then Resistance 2 may act as the crucial resistance level for the stock.
Stop-loss: It is a level to protect further losses in case of unfavourable movement in the stock prices.
This report (“Report”) has been issued by Kalkine New Zealand Limited (FSP691351) (NZBN:9429047678101) (“Kalkine”). Kalkine is a Financial Advice Provider (“FAP”) and is authorised by a Class 1 Financial Advice Provider Licence issued by Financial Markets Authority (“FMA”) to provide financial advice. Kalkine provides only general financial advice through its research reports following a person becoming a member. The reports contain buy/sell/hold and other recommendations in relation to equity securities, managed funds and other managed investment schemes and other financial advice products. The recommendations and opinions in this Report and on Kalkine website do not take into account any of your investment objectives, financial situation or needs. Before you make a decision about whether to acquire a financial product, you should obtain the Product Disclosure Statement from the product issuer. You should consider the appropriateness of advice taking into account your own objectives, financial situation and needs and seek independent financial advice before making any financial decisions. If you act on the advice in the research reports, you may have to pay fees, expenses or other amounts (but not to Kalkine).
The information in this Report and on the Kalkine website has been prepared from a wide variety of sources, which Kalkine, to the best of its knowledge and belief, considers accurate. Kalkine has made every effort to ensure the reliability of the information contained in its reports (including this Report), newsletters and websites. All information represents our views at the date of publication and may change without notice.
Kalkine does not issue, sell or deal in any financial products. The information in this Report does not constitute an offer to sell securities or other financial products or a solicitation of an offer to buy securities or other financial products. Our reports contain general recommendations to invest in securities and other financial products. Kalkine is not responsible for, and does not guarantee, the performance of, or returns on, any investments mentioned in this Report.
This Report may contain information on past performance of particular investments. Past performance is not a reliable indicator of future performance. Returns stated do not take into account transaction costs and taxes.
Further information about the complaints and dispute resolution process, as well as information about Kalkine’s duties are available on Kalkine’s website. Please read our Financial Advice Provider (FAP) disclosure statement and Complaints Handling Guide, which are available on the website.
Copyright 2025 Krish Capital Pty. Ltd. (ABN 61629651510). All Rights Reserved. No part of this Report, or its content, may be reproduced in any form without our prior consent.
Past performance is not a reliable indicator of future performance.
 Please wait processing your request...