Section 1: Company Overview and Fundamentals
1.1 Company Overview:
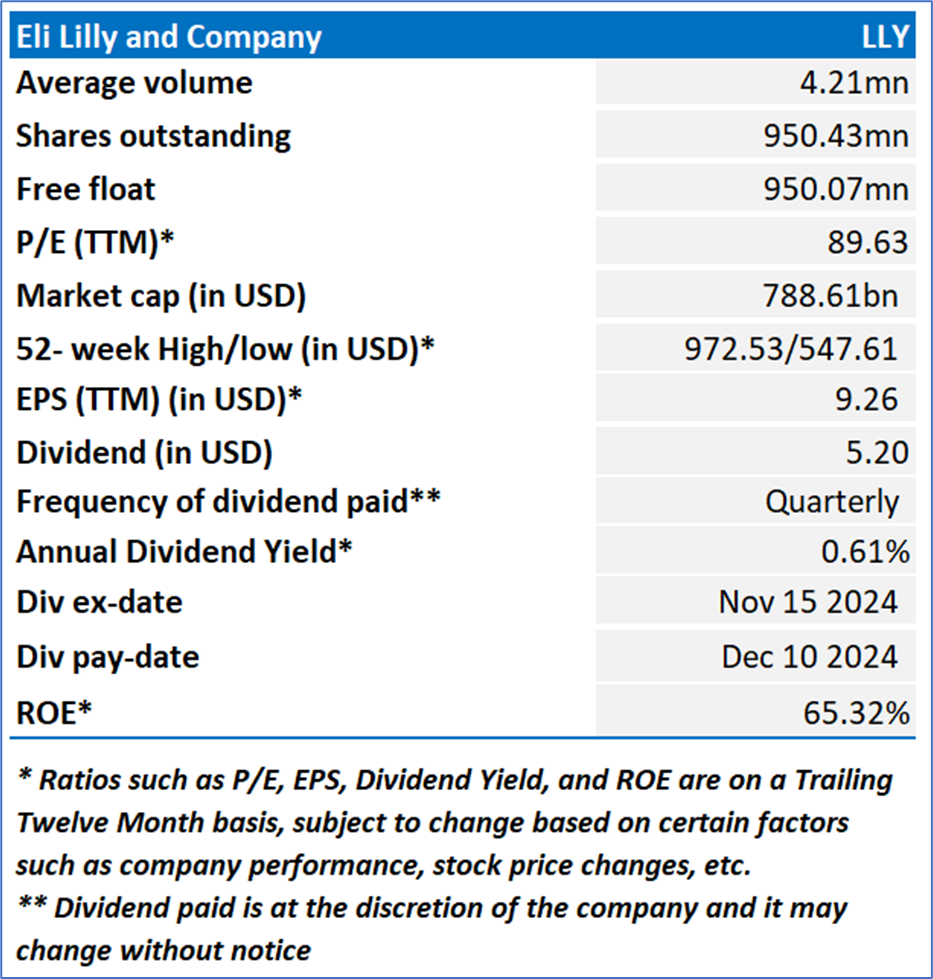
Eli Lilly and Company (NYSE: LLY) is a medicine company. The Company discovers, develops, manufactures and markets products in the human pharmaceutical products segment. Its diabetes, obesity and other cardiometabolic products include Basaglar, Humalog, Mounjaro, Trulicity and Zepbound. Its oncology products include Alimta, Retevmo, Tyvyt and Verzenio.
Kalkine’s Low Carbon Research Report covers the Investment Highlights, Low Carbon Emission Initiatives, Key Financial Metrics, Risks, and Technical Analysis along with the Valuation, Target Price, and Recommendation on the stock.
Stock Performance:
1.2 Why do Low Carbon Emissions matter?
The shift toward a low-carbon economy is one of the most significant challenges of current time, spurred by the urgent need to combat climate change and reduce the environmental impact of corporate activities. This report covers the US-listed low-carbon emission company (NYSE: LLY), that is committed to sustainability and responsible environmental practices.
Carbon and Waste Management - Key Metrics
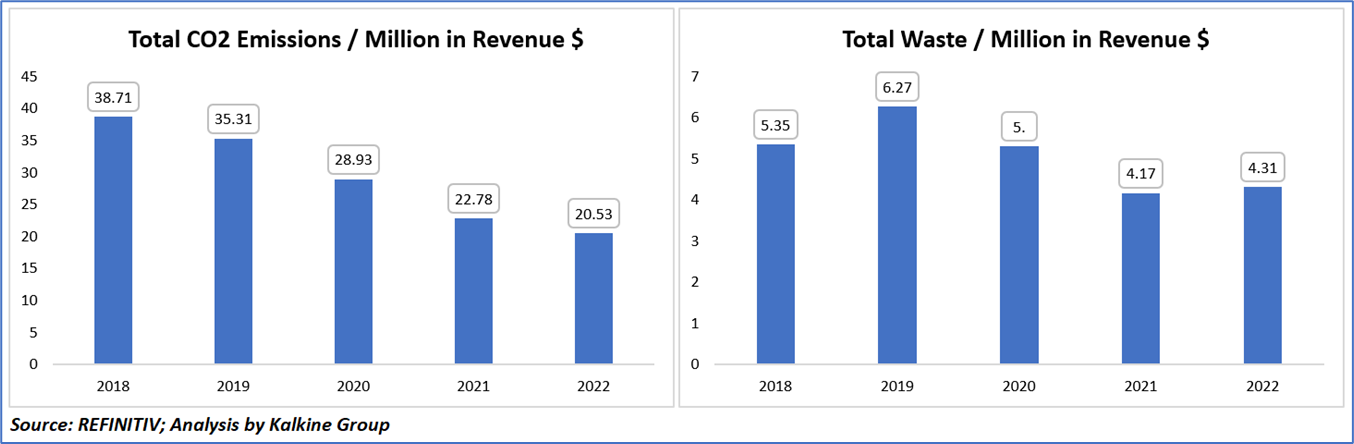
From 2018 to 2022, the company demonstrated a steady decline in environmental impact per million dollars of revenue, evidenced by reductions in both waste generation and CO₂ emissions. Total waste per million in revenue decreased from 5.35 USD in 2018 to 4.31 USD in 2022, with a notable dip in 2021 to 4.17 USD. Similarly, total CO₂ emissions per million in revenue showed a consistent decline over the period, starting at 38.71 USD in 2018 and reaching 20.53 USD in 2022, reflecting a substantial improvement in emission efficiency.
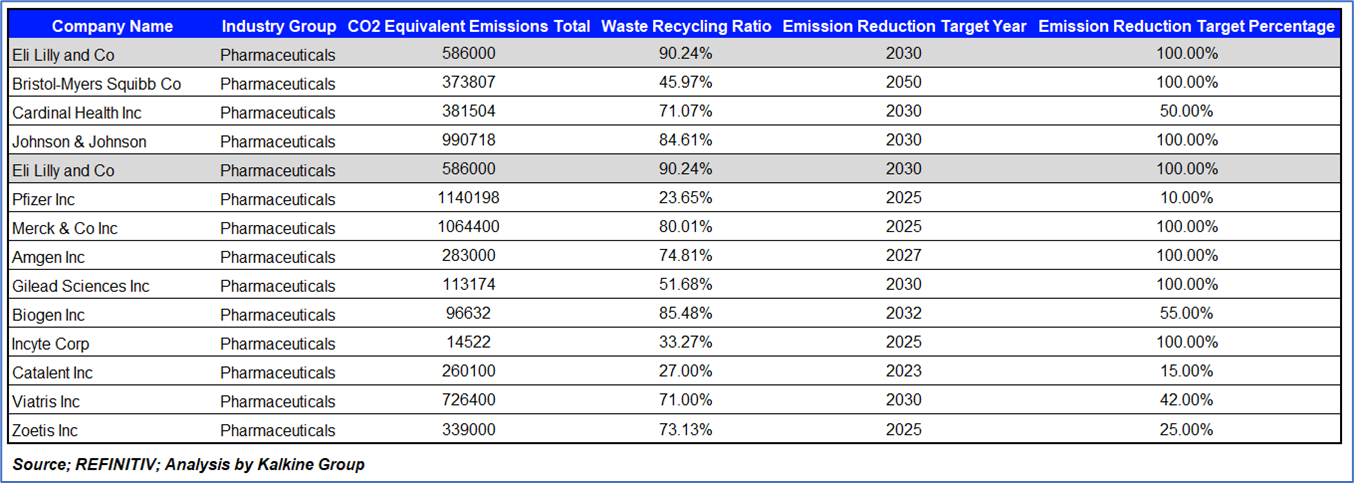
Peer Comparison: Carbon Emission and Waste Management Metrics
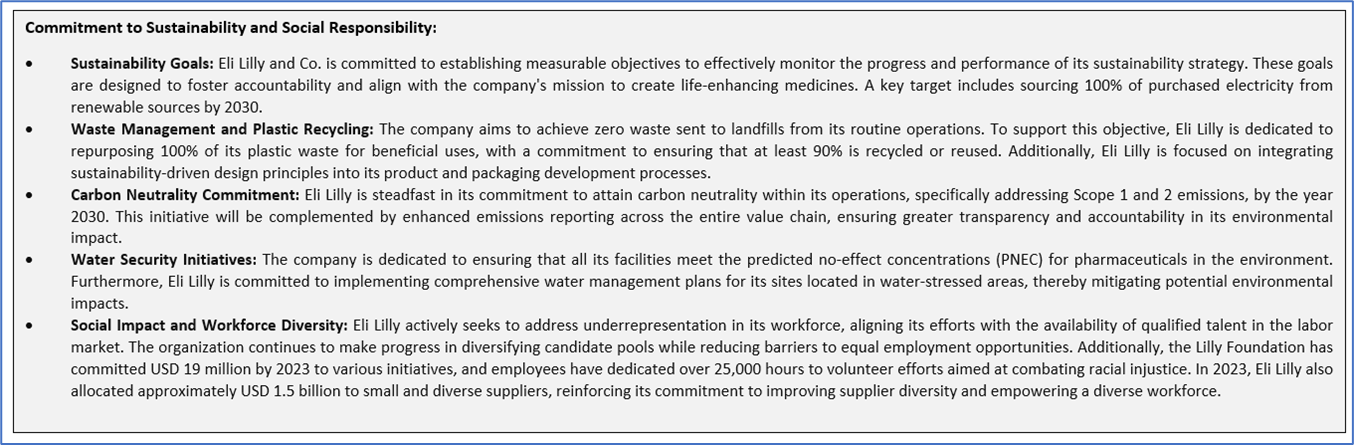
Eli Lilly and Co. stands out within the pharmaceuticals sector with a total of 586,000 CO2 equivalent emissions and a commendable waste recycling ratio of 90.24%. The company has set an ambitious emission reduction target to achieve 100% reduction by 2030. This aligns with similar commitments from peers like Johnson & Johnson and Merck & Co. Inc., which also aim for complete reductions within the same timeframe. Eli Lilly's proactive stance highlights its commitment to sustainability and environmental responsibility.
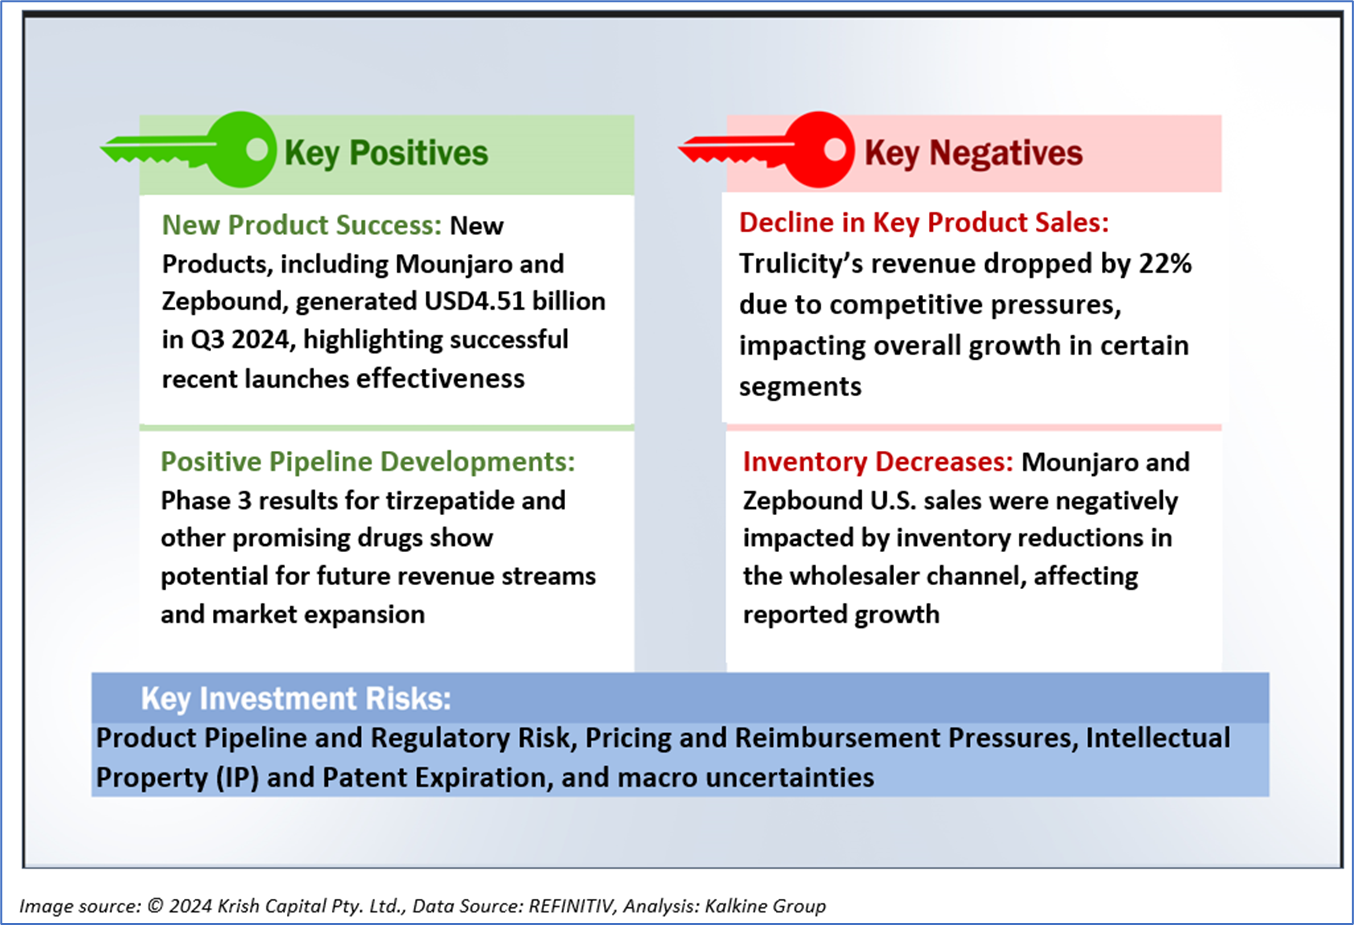
1.3 The Key Positives, Negatives, and Investment summary
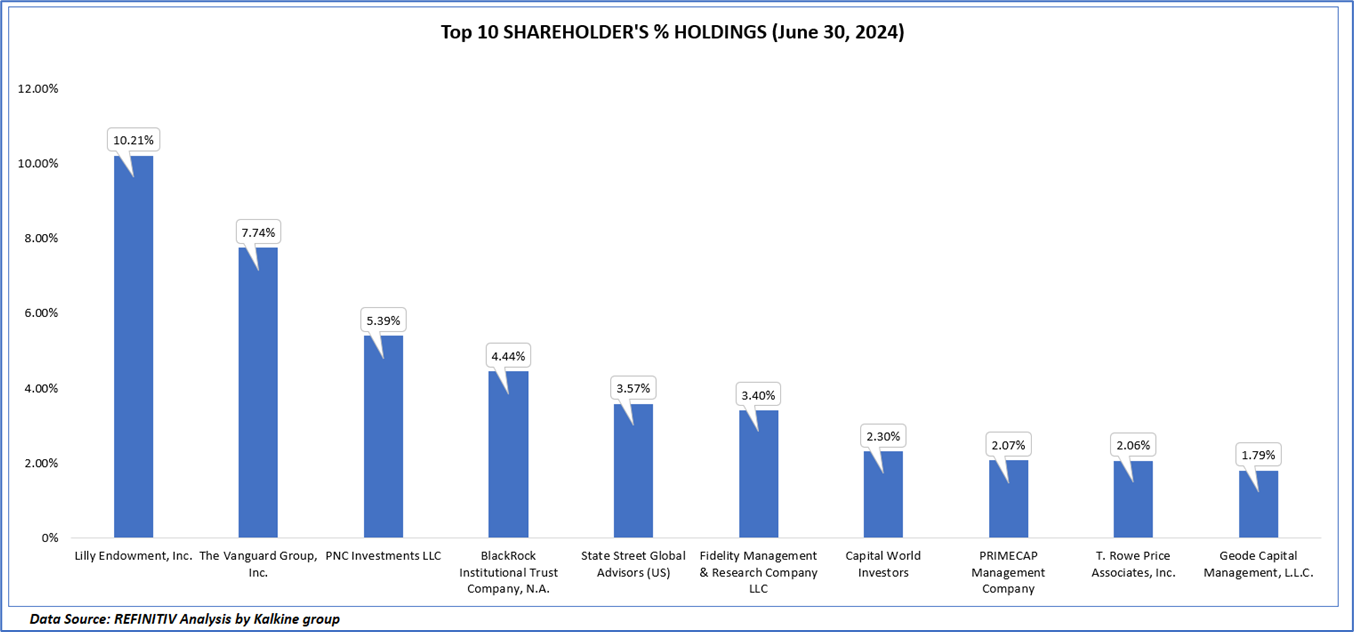
1.4 Top 10 shareholders:
The top 10 shareholders together form ~42.96% of the total shareholding, signifying concentrated shareholding. Lilly Endowment, Inc. and The Vanguard Group, Inc. are the biggest shareholders, holding the maximum stake in the company at 10.21% and 7.74%, respectively.
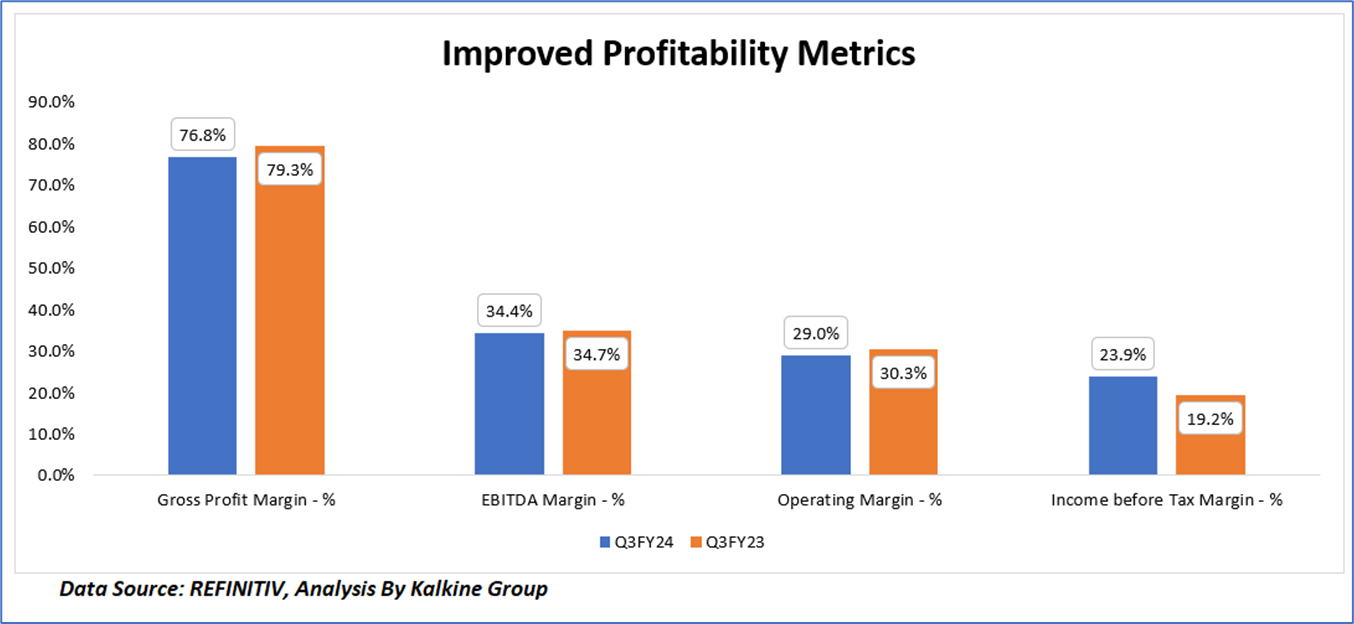
1.5 Key Metrics
In the second quarter of fiscal year 2024 (Q2FY24), Eli Lilly and Co. reported a gross profit margin of 76.8%, a decline from 79.3% in the corresponding quarter of the previous fiscal year (Q2FY23). The EBITDA margin experienced a slight decrease, reporting 34.4% compared to 34.7% in Q2FY23. The operating margin also saw a reduction, falling to 29.0% from 30.3% year-over-year. Notably, the income before tax margin improved to 23.9%, up from 19.2% in the same period last year. Additionally, the income tax rate decreased significantly to 8.3% in Q2FY24, down from 20.1% in Q2FY23.
Section 2: Business Updates and Corporate Business Highlights
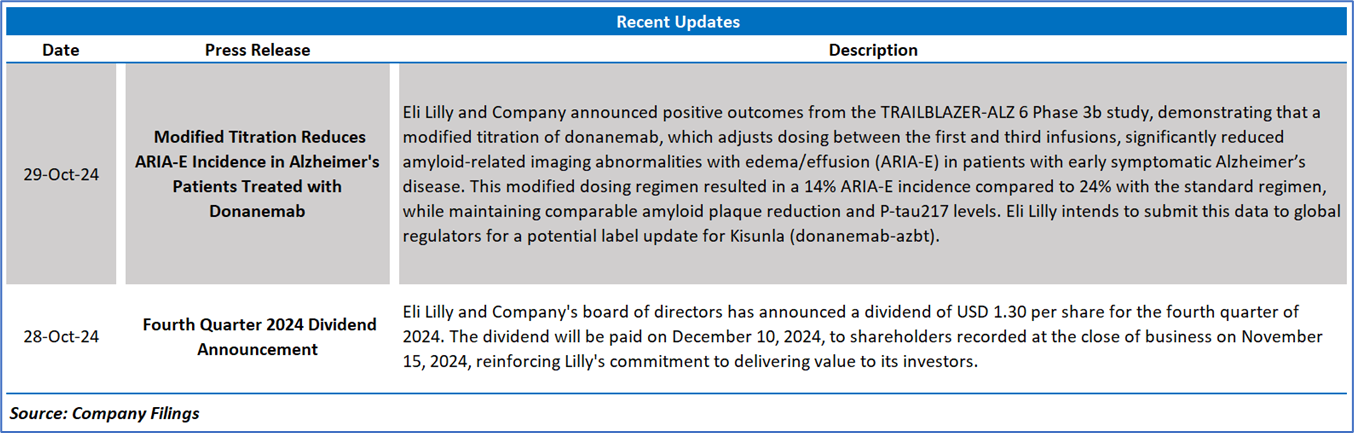
2.1 Recent Updates:
The below picture gives an overview of the recent updates:
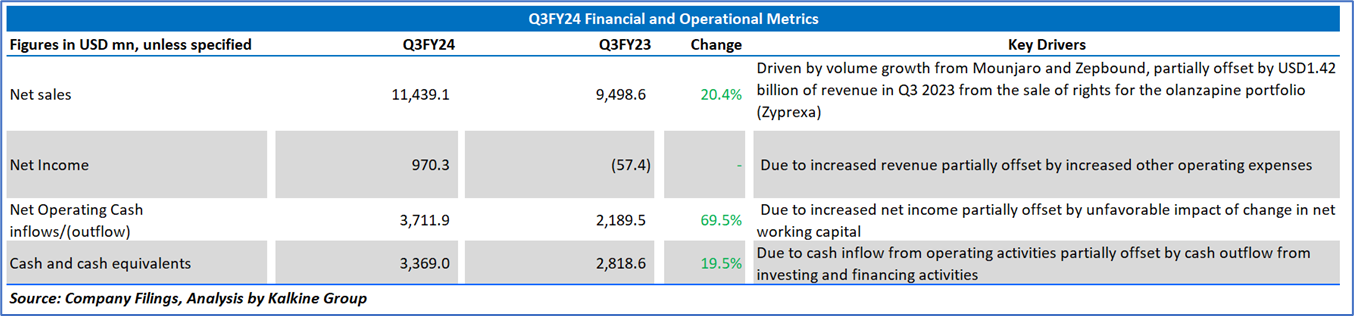
2.2 Insights of Q3FY24:
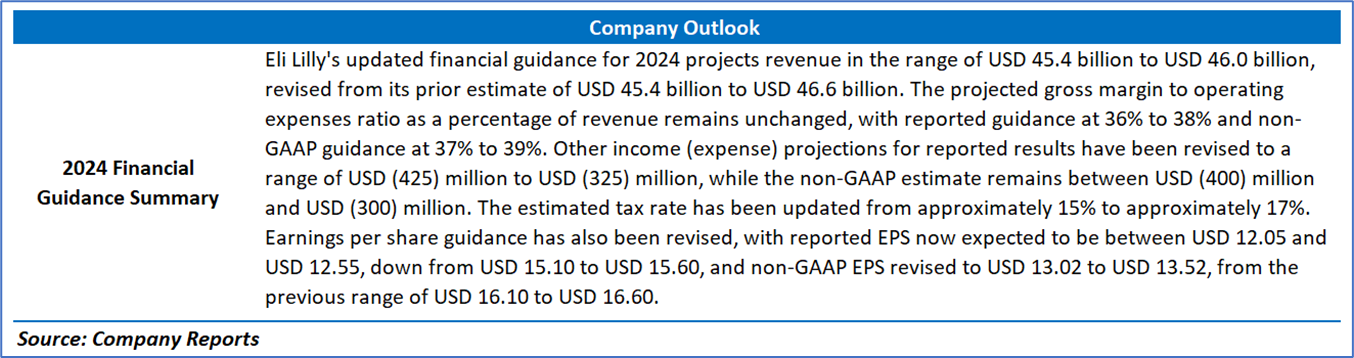
Section 3: Key Risks & Outlook

Section 4: Stock Recommendation Summary:
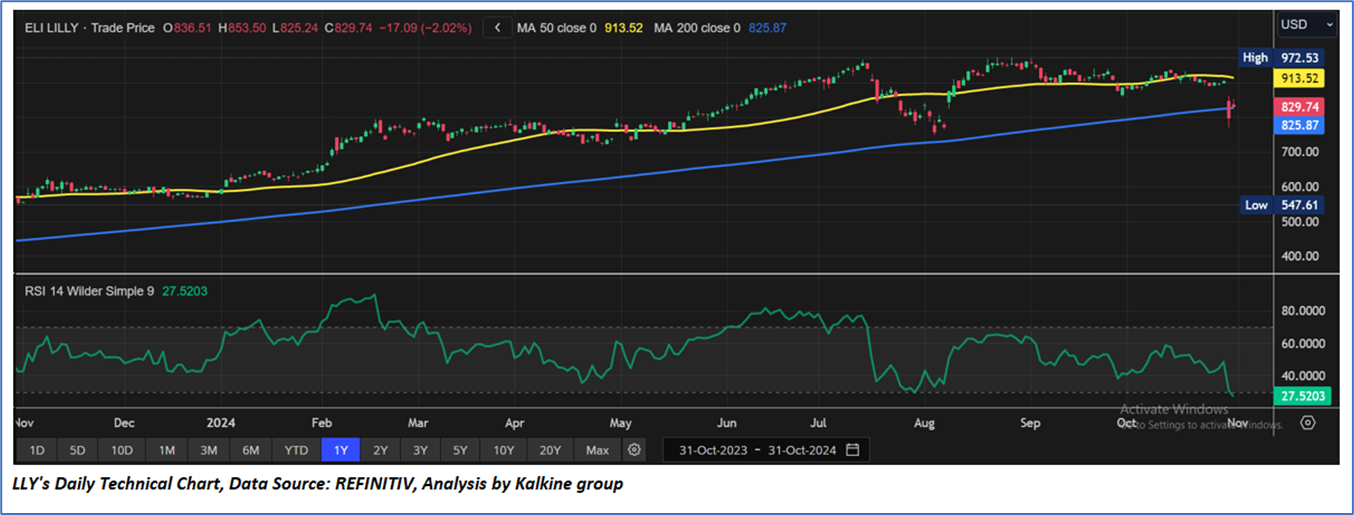
4.1 Price Performance and Technical Summary:
Stock Performance:
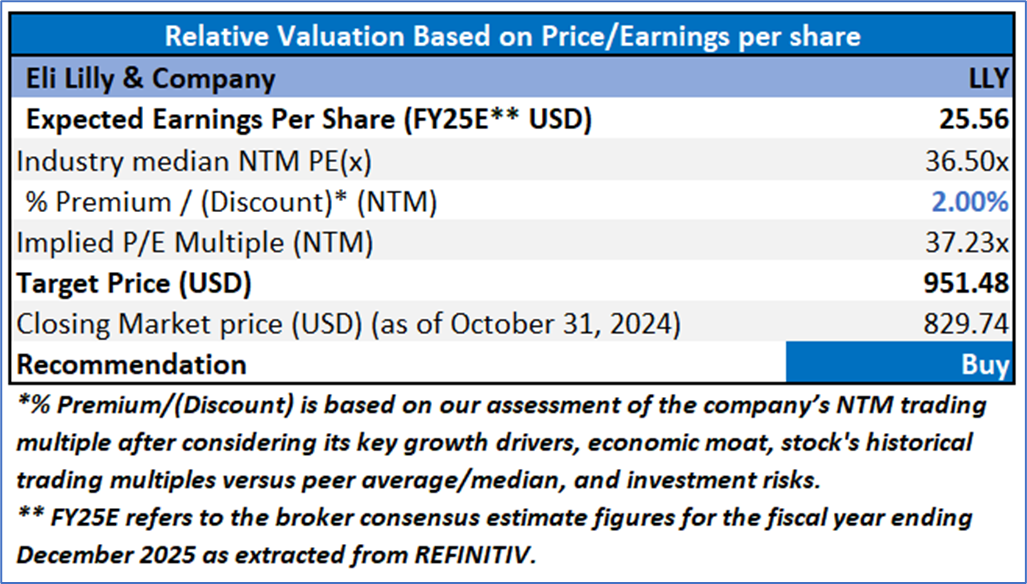
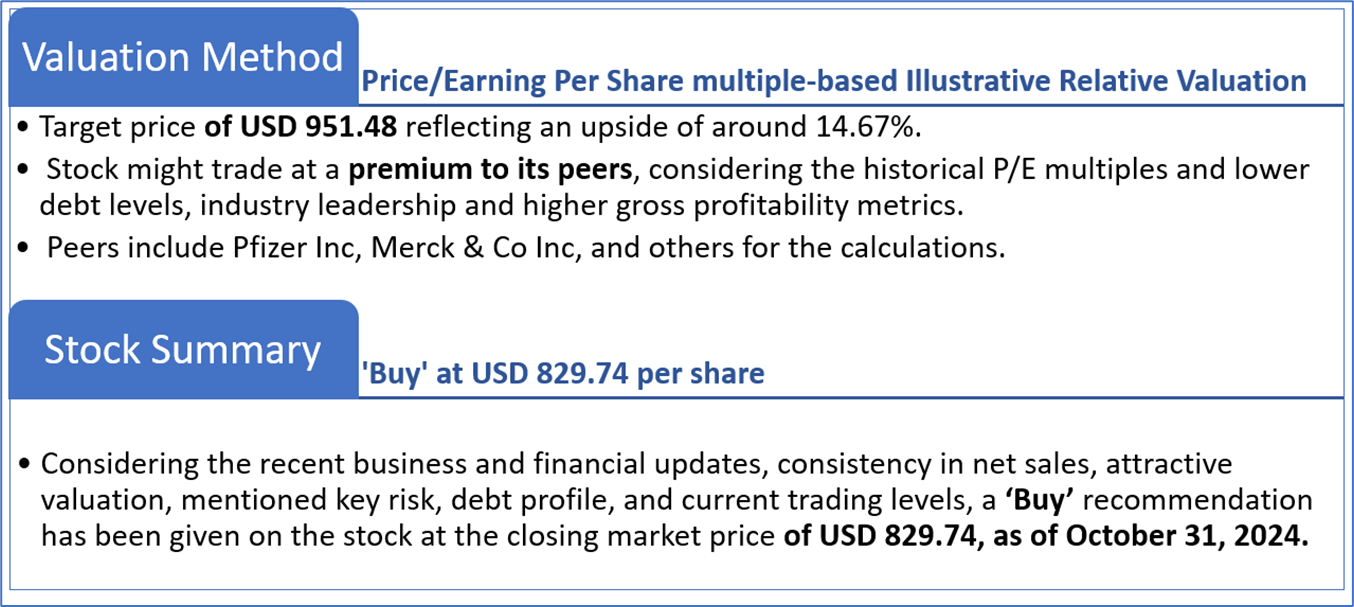
4.2 Fundamental Valuation
Valuation Methodology: Price/Earnings Per Share Multiple Based Relative Valuation
Markets are trading in a highly volatile zone currently due to certain macroeconomic issues and geopolitical tensions prevailing. Therefore, it is prudent to follow a cautious approach while investing.
Note 1: Past performance is not a reliable indicator of future performance.
Note 2: The reference date for all price data, currency, technical indicators, support, and resistance levels is October 31, 2024. The reference data in this report has been partly sourced from REFINITIV.
Note 3: Investment decisions should be made depending on an individual's appetite for upside potential, risks, holding duration, and any previous holdings. An 'Exit' from the stock can be considered if the Target Price mentioned as per the Valuation and or the technical levels provided has been achieved and is subject to the factors discussed above.
Note 4: The report publishing date is as per the Pacific Time Zone.
Technical Indicators Defined: -
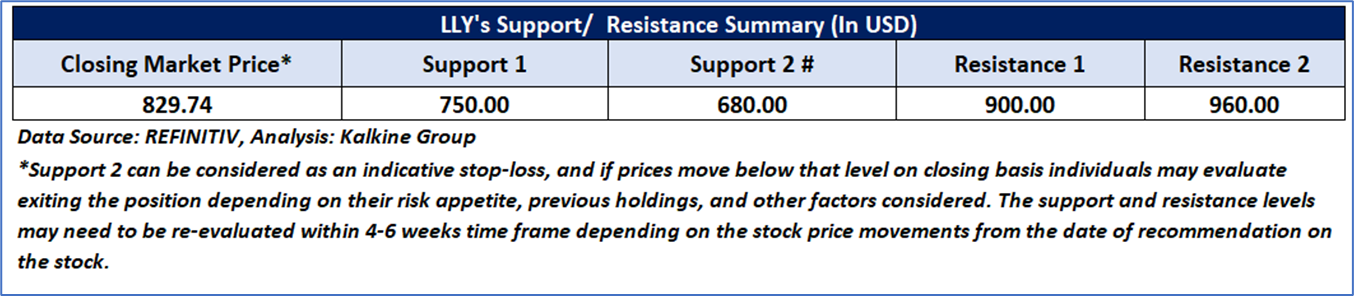
Support: A level at which the stock prices tend to find support if they are falling, and a downtrend may take a pause backed by demand or buying interest. Support 1 refers to the nearby support level for the stock and if the price breaches the level, then Support 2 may act as the crucial support level for the stock.
Resistance: A level at which the stock prices tend to find resistance when they are rising, and an uptrend may take a pause due to profit booking or selling interest. Resistance 1 refers to the nearby resistance level for the stock and if the price surpasses the level, then Resistance 2 may act as the crucial resistance level for the stock.
Stop-loss: It is a level to protect against further losses in case of unfavorable movement in the stock prices.
Disclaimer This report has been issued by Kalkine New Zealand Limited (FSP691351) (NZBN:9429047678101) (“Kalkine”). Kalkine is a Financial Advice Provider (“FAP”) and is authorised by a Class 1 Financial Advice Provider Licence issued by Financial Markets Authority (“FMA”) to provide financial advice. Kalkine provides only general financial advice through its research reports following a person becoming a member. The reports contain buy/sell/hold and other recommendations in relation to equity securities, managed funds and other managed investment schemes and other financial advice products. The recommendations and opinions in this report and on Kalkine website do not take into account any of your investment objectives, financial situation or needs. Before you make a decision about whether to acquire a financial product, you should obtain the Product Disclosure Statement from the product issuer. You should consider the appropriateness of advice taking into account your own objectives, financial situation and needs and seek independent financial advice before making any financial decisions. If you act on the advice in the research reports, you may have to pay fees, expenses or other amounts (but not to Kalkine). Further information about the complaints and dispute resolution process, as well as information about Kalkine’s duties are available on Kalkine’s website. Please read our Financial Advice Provider (FAP) disclosure statement and Complaints Handling Guide, which are available on the website.
Past performance is not a reliable indicator of future performance.
 Please wait processing your request...