

Kalkine's Global Tariff Report offers independent, data-driven analysis of key global sectors impacted by tariff adjustments. It evaluates the potential implications these changes may have for equity valuations within those industries. The report prioritizes trade-sensitive sectors, which typically face increased investor scrutiny during periods of tariff uncertainty, while also identifying defensive and countercyclical segments that demonstrate resilience or potential for outperformance amidst global trade disruptions.
As illustrated in the table below, several key sectors in different countries are directly impacted by the recent tariff announcement from President Trump.
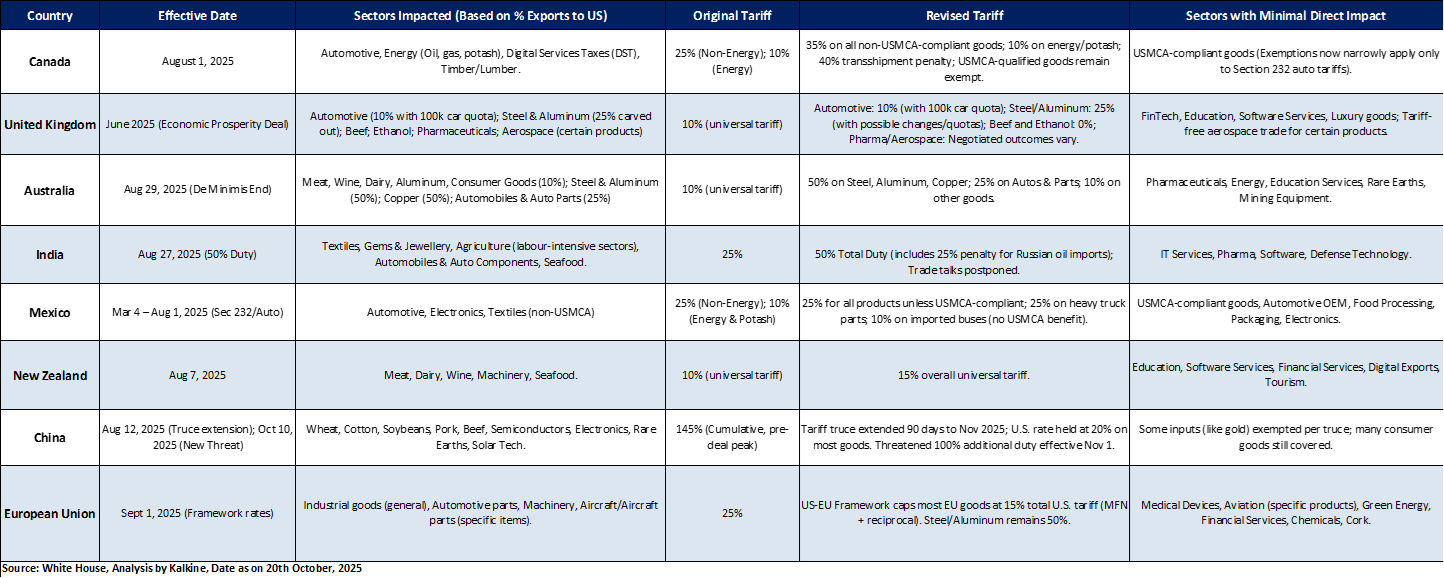

Key Developments (as of October 20, 2025)
Canada
India
China
European Union

In August 2025, Canada’s trade in services surplus narrowed to CAD ~0.3 bn in August 2025 from CAD ~0.4 bn in July as exports slipped 0.2% to CAD ~18.7 bn while imports held steady at CAD ~18.4 bn. Travel exports fell 1.7% due to lower foreign visitor spending, but commercial service exports rose 0.8% on stronger financial activity. Imports of commercial services also rose 0.8%, offset by declines in transportation and travel services. The combined goods and services trade deficit widened to CAD ~6.0 bn for the month.
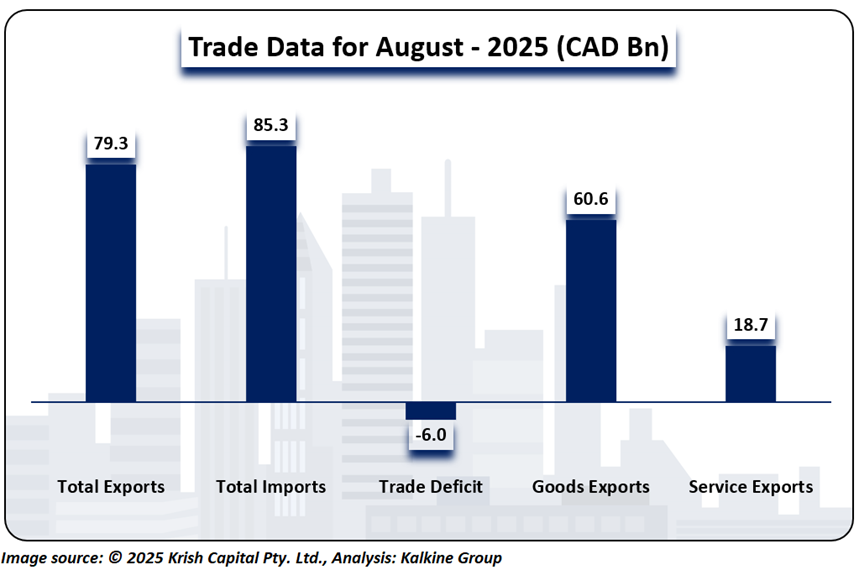


 Image source: © 2025 Krish Capital Pty. Ltd., Analysis: Kalkine Group

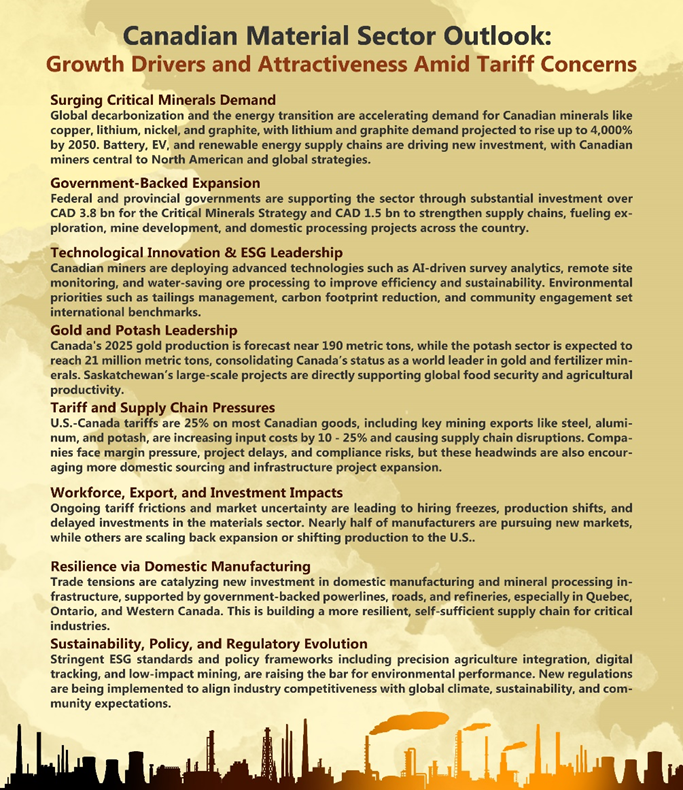
Image source: © 2025 Krish Capital Pty. Ltd., Analysis: Kalkine Group
Amid elevated Market Volatility and Tariff pressures, Eldorado Gold Corp (TSX: ELD) stands out as our defensive pick within the Material sector, supported by rigorous fundamental and technical research.
Section1: Company Overview and Fundamental Insights:

Eldorado Gold Corp (TSX: ELD) is a gold and base metals producer with mining, development and exploration operations in Turkey, Canada, Greece and Romania. It has a portfolio of high-quality assets and long-term partnerships with local communities. Some of its projects include Kisladag, Efemcukuru, Skouries; Perama Hill and Certej projects.
Kalkine’s Global Tariff Report covers the Investment Highlights, Key Financial Metrics, Risks, Technical Analysis along with the Valuation, Target Price, and Recommendation on the stock.
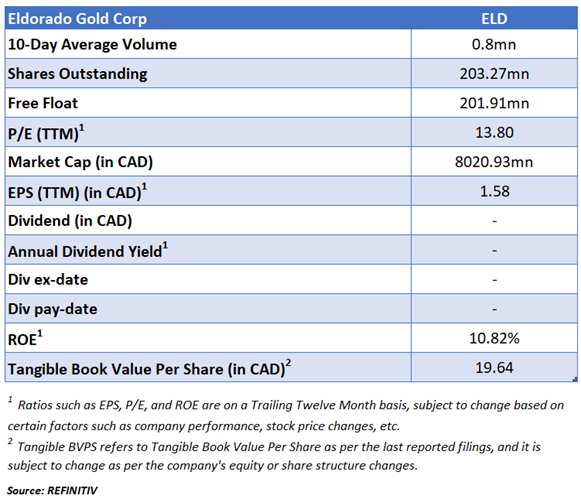


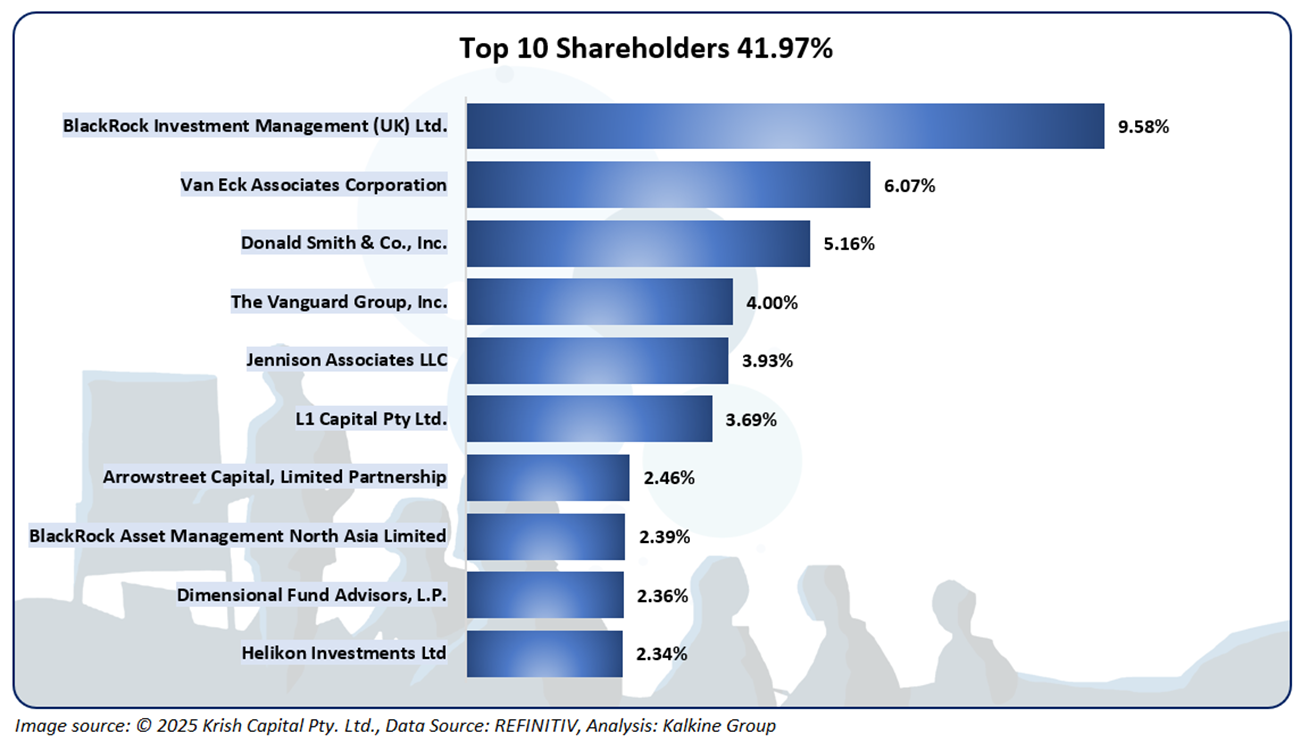
The top 10 shareholders together form ~41.97% of the total shareholding. BlackRock Investment Management (UK) Ltd. And Van Eck Associates Corporation hold a maximum stake in the company at ~9.58% and ~6.07%, respectively.

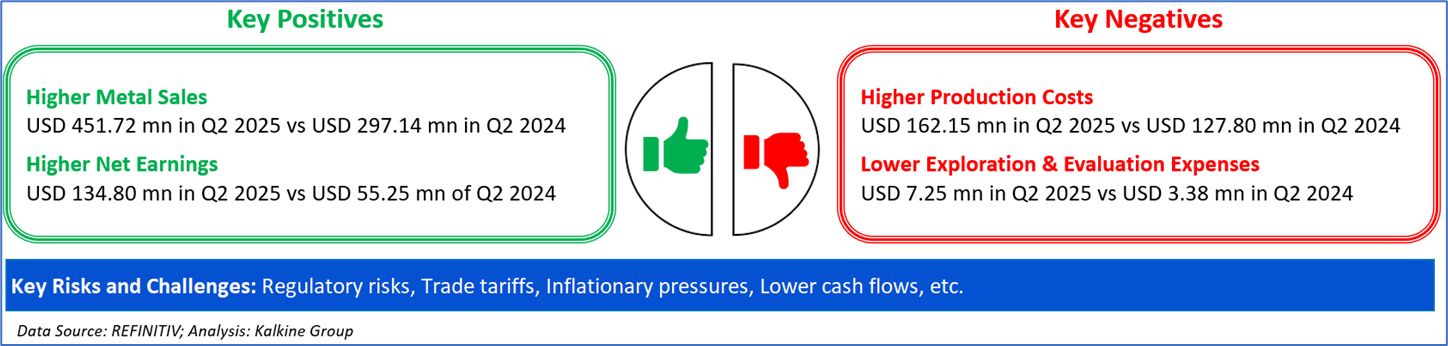
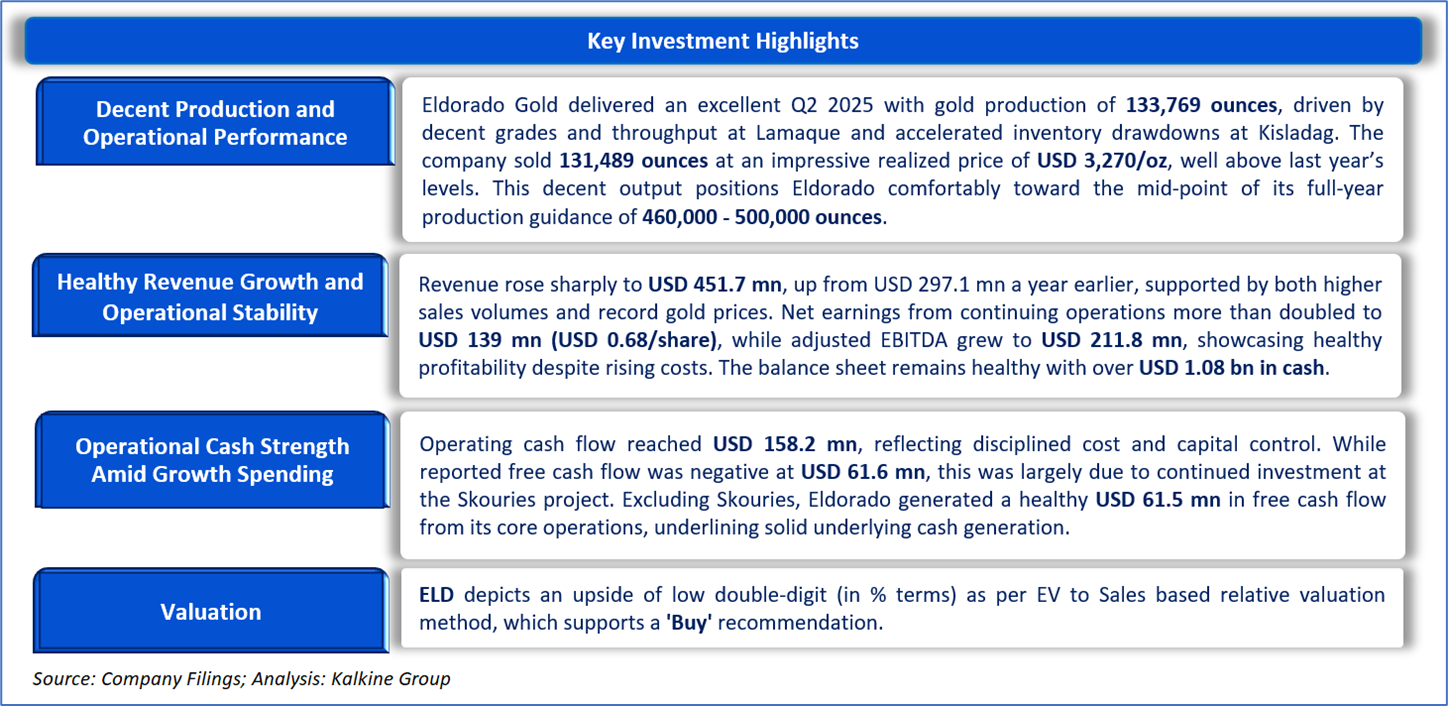
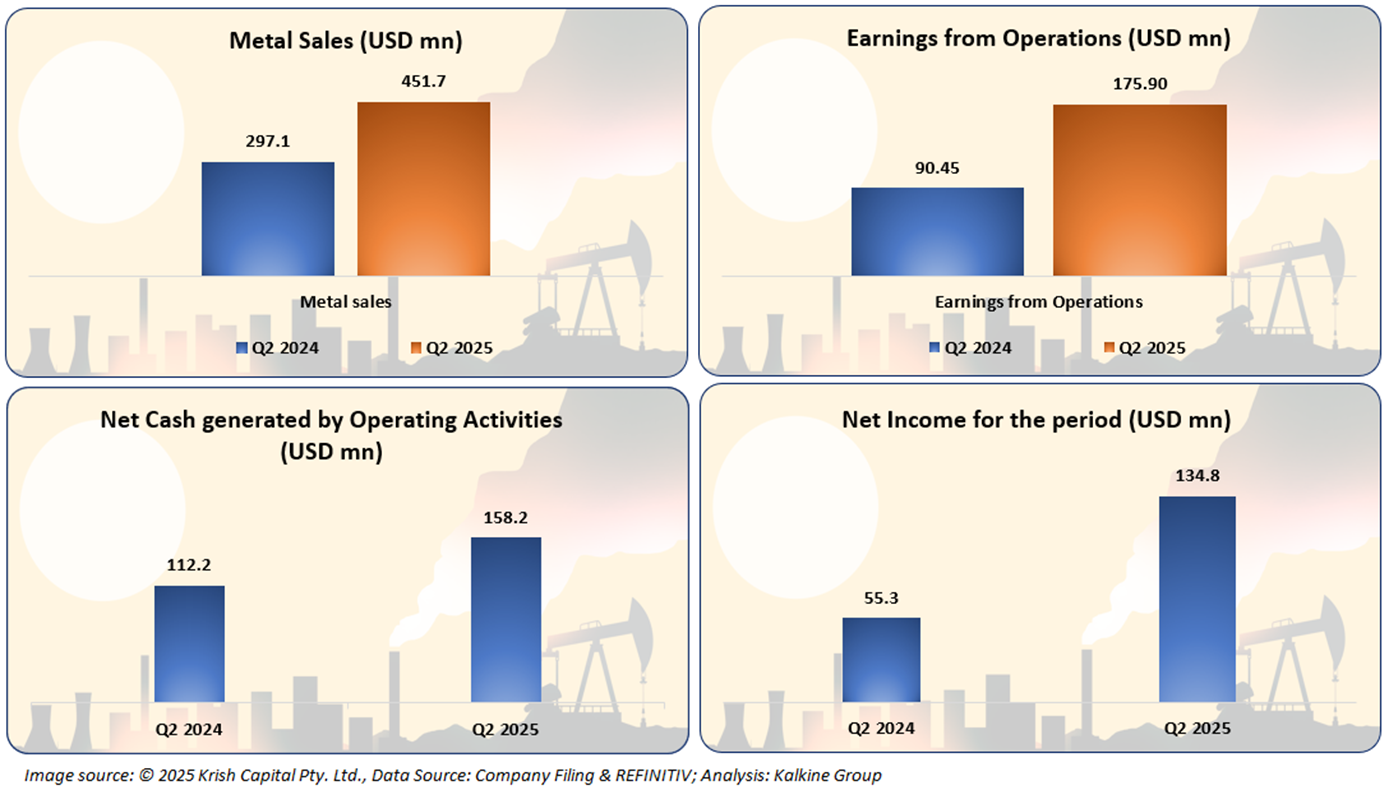
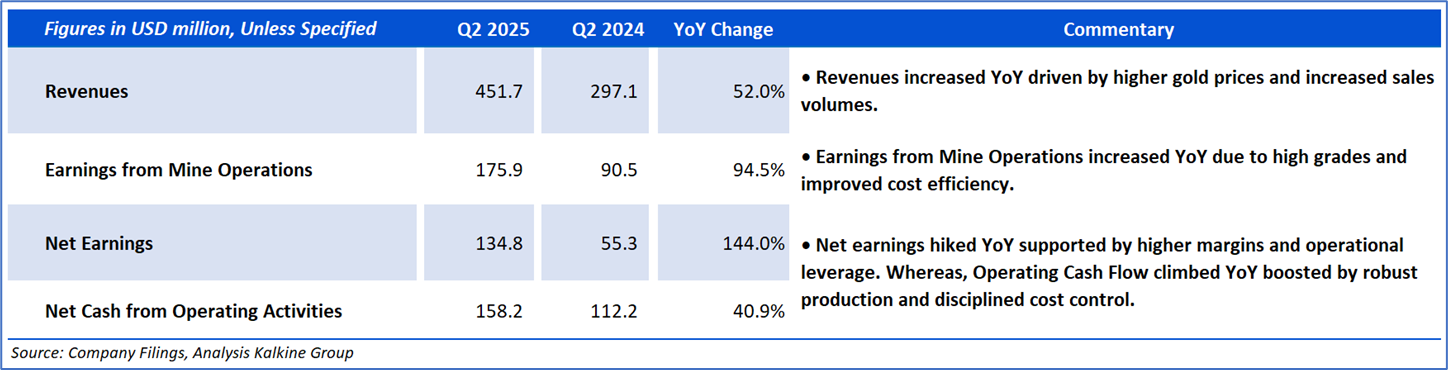
The company reported rising financials in Q2 2025, where it clocked healthy growth under its Metal Sales and Earnings from Operations, which is a key positive. Furthermore, it witnessed elevated Net Cash generated by Operating Activities and Net Income, displaying its decent operating efficiency and improved profitability momentum.
Section 2: Business Updates and Financial Highlights

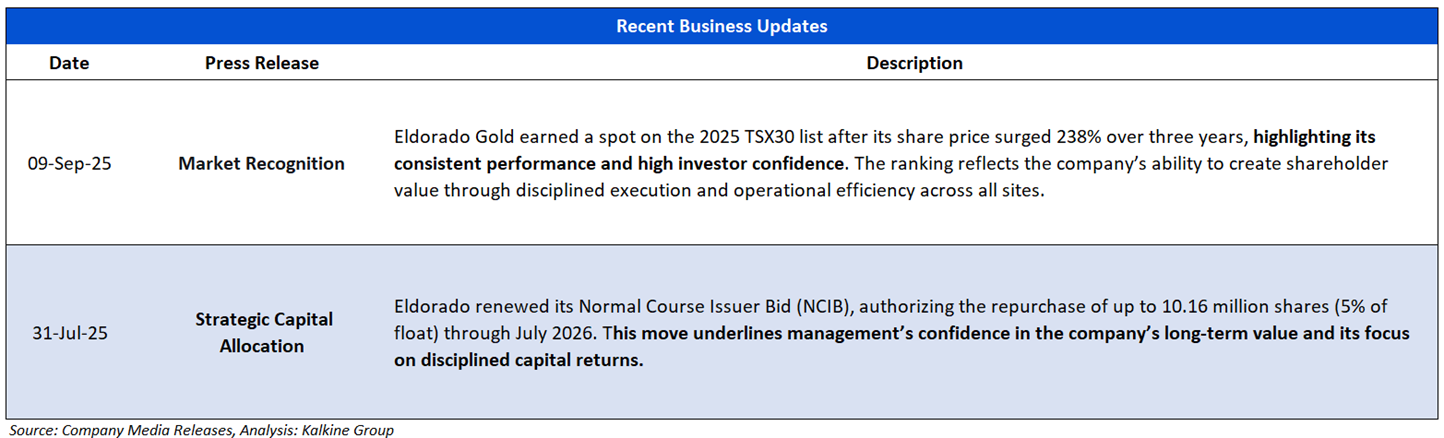
The picture below gives an overview of the company’s recent activities, such as an announcement regarding Market Recognition and Strategic Capital Allocation.

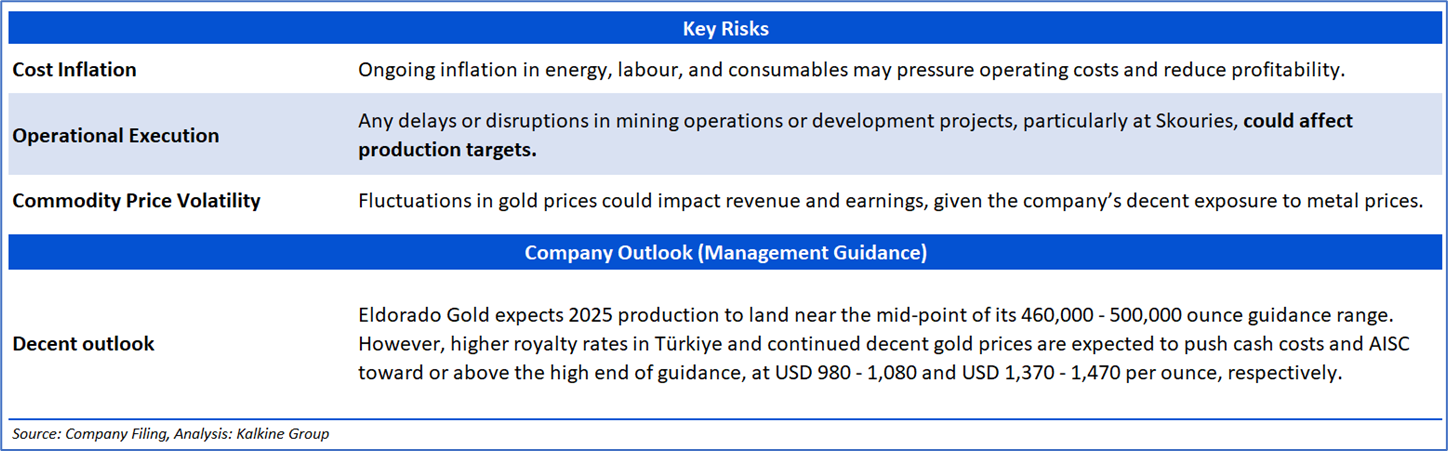
Section 3: Key Risks and Company Outlook
Section 4: Stock Recommendation Summary


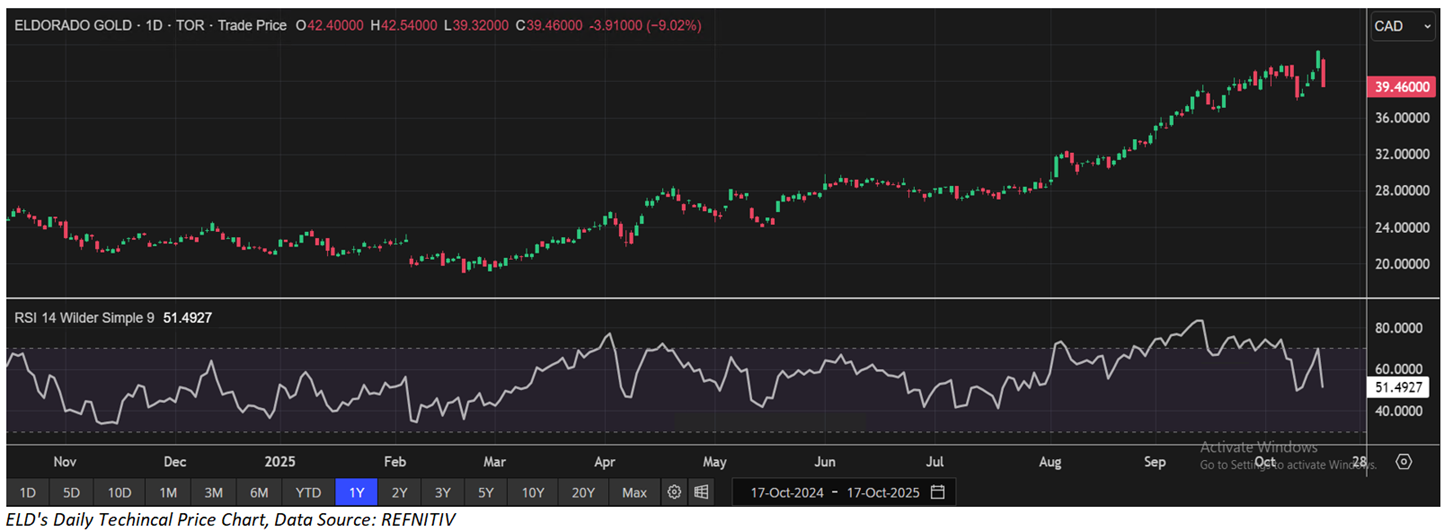
The stock has witnessed an upside of ~2.14% and ~6.07% over the last 1 week and 1 month respectively. Moreover, it is trading above the average 52-week high price of CAD 43.41 and 52-week low price of CAD 18.94, providing an opportunity to ride the trend.

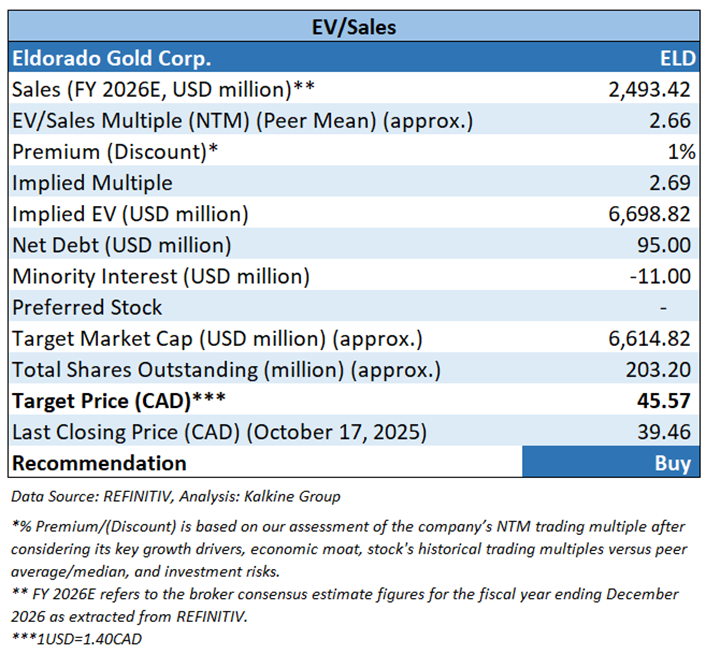
Valuation Methodology: EV to Sales Based Relative Valuation (Illustrative):
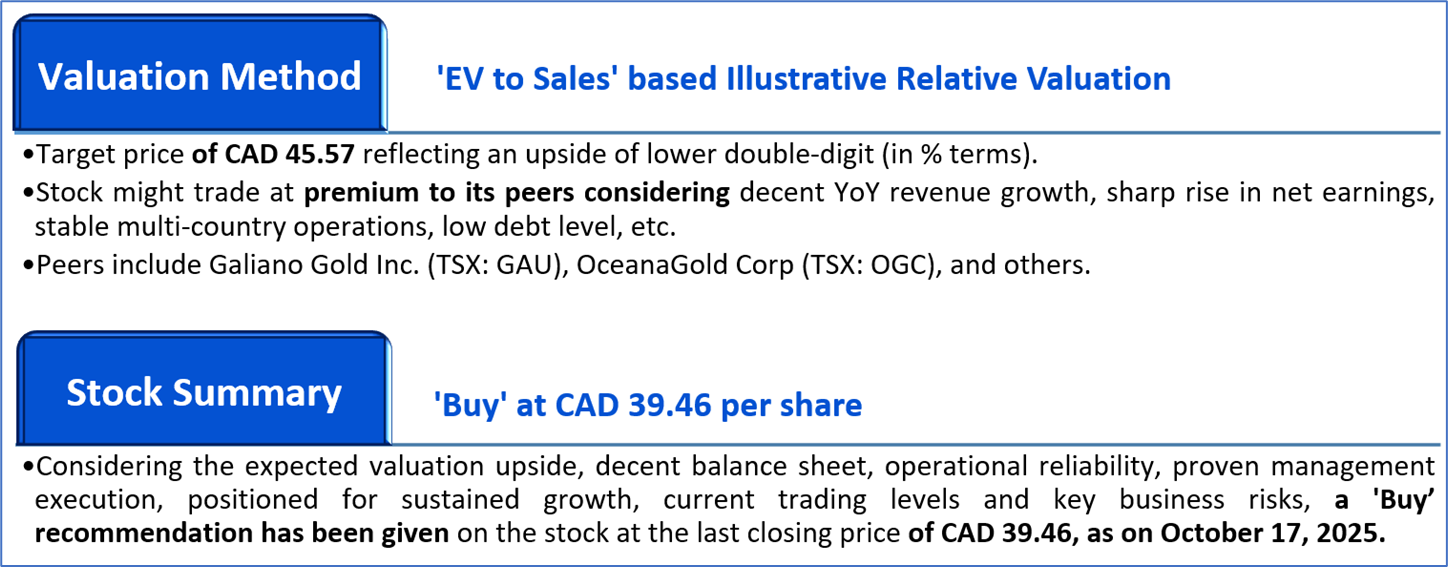
Markets are trading in a highly volatile zone currently due to certain macroeconomic issues and geopolitical tensions prevailing. Therefore, it is prudent to follow a cautious approach while investing.
Note 1: Past performance is not a reliable indicator of future performance.
Note 2: The reference date for all price data, currency, technical indicators, support, and resistance levels is October 17, 2025. The reference data in this report has been partly sourced from REFINITIV.
Note 3: Investment decisions should be made depending on an individual's appetite for upside potential, risks, holding duration, and any previous holdings. An 'Exit' from the stock can be considered if the Target Price mentioned as per the Valuation and or the technical levels provided has been achieved and is subject to the factors discussed above.
Note 4: Dividend Yield may vary as per the stock price movement.
Note 5: Kalkine reports are prepared based on the stock prices captured either from REFINITIV or Trading View. Typically, REFINITIV or Trading View may reflect stock prices with a delay which could be a lag of 25-30 minutes. There can be no assurance that future results or events will be consistent with the information provided in the report. The information is subject to change without any prior notice.
Technical Indicators Defined: -
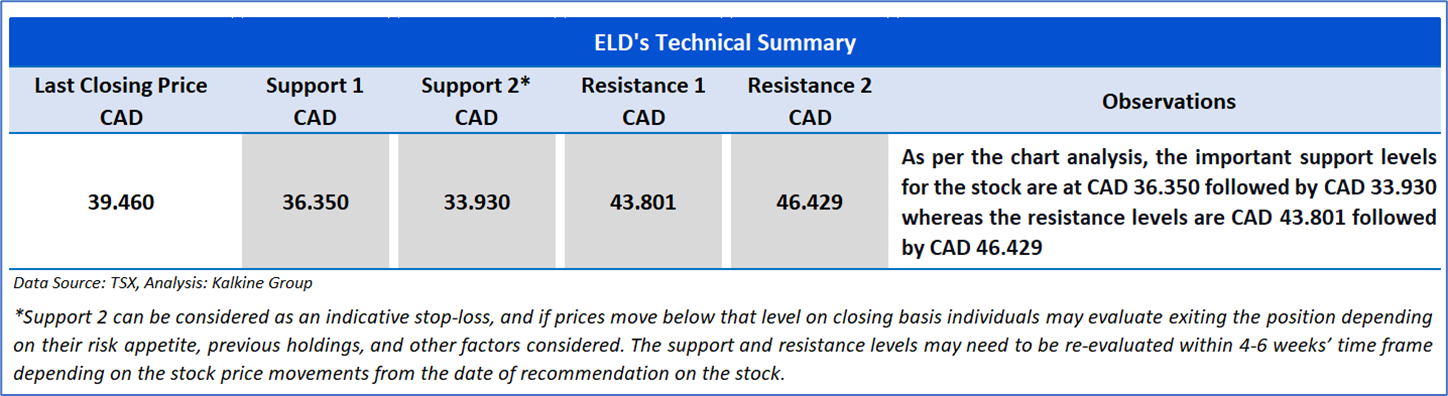
Support: A level at which the stock prices tend to find support if they are falling, and a downtrend may take a pause backed by demand or buying interest. Support 1 refers to the nearby support level for the stock and if the price breaches the level, then Support 2 may act as the crucial support level for the stock.
Resistance: A level at which the stock prices tend to find resistance when they are rising, and an uptrend may take a pause due to profit booking or selling interest. Resistance 1 refers to the nearby resistance level for the stock and if the price surpasses the level, then Resistance 2 may act as the crucial resistance level for the stock.
Stop-loss: It is a level to protect further losses in case of unfavourable movement in the stock prices.
This report (“Report”) has been issued by Kalkine New Zealand Limited (FSP691351) (NZBN:9429047678101) (“Kalkine”). Kalkine is a Financial Advice Provider (“FAP”) and is authorised by a Class 1 Financial Advice Provider Licence issued by Financial Markets Authority (“FMA”) to provide financial advice. Kalkine provides only general financial advice through its research reports following a person becoming a member. The reports contain buy/sell/hold and other recommendations in relation to equity securities, managed funds and other managed investment schemes and other financial advice products. The recommendations and opinions in this Report and on Kalkine website do not take into account any of your investment objectives, financial situation or needs. Before you make a decision about whether to acquire a financial product, you should obtain the Product Disclosure Statement from the product issuer. You should consider the appropriateness of advice taking into account your own objectives, financial situation and needs and seek independent financial advice before making any financial decisions. If you act on the advice in the research reports, you may have to pay fees, expenses or other amounts (but not to Kalkine).
The information in this Report and on the Kalkine website has been prepared from a wide variety of sources, which Kalkine, to the best of its knowledge and belief, considers accurate. Kalkine has made every effort to ensure the reliability of the information contained in its reports (including this Report), newsletters and websites. All information represents our views at the date of publication and may change without notice.
Kalkine does not issue, sell or deal in any financial products. The information in this Report does not constitute an offer to sell securities or other financial products or a solicitation of an offer to buy securities or other financial products. Our reports contain general recommendations to invest in securities and other financial products. Kalkine is not responsible for, and does not guarantee, the performance of, or returns on, any investments mentioned in this Report.
This Report may contain information on past performance of particular investments. Past performance is not a reliable indicator of future performance. Returns stated do not take into account transaction costs and taxes.
Further information about the complaints and dispute resolution process, as well as information about Kalkine’s duties are available on Kalkine’s website. Please read our Financial Advice Provider (FAP) disclosure statement and Complaints Handling Guide, which are available on the website.
Copyright 2025 Krish Capital Pty. Ltd. (ABN 61629651510). All Rights Reserved. No part of this Report, or its content, may be reproduced in any form without our prior consent.
Past performance is not a reliable indicator of future performance.
 Please wait processing your request...