

Section 1: Company Overview and Fundamentals
1.1 Company Overview:
EBOS Group Limited (NZX: EBO) is engaged in the business of marketing, wholesaling, and distributing healthcare, medical and pharmaceutical products. The company is also a major player in the marketing and distribution of recognised consumer products and animal care brands.
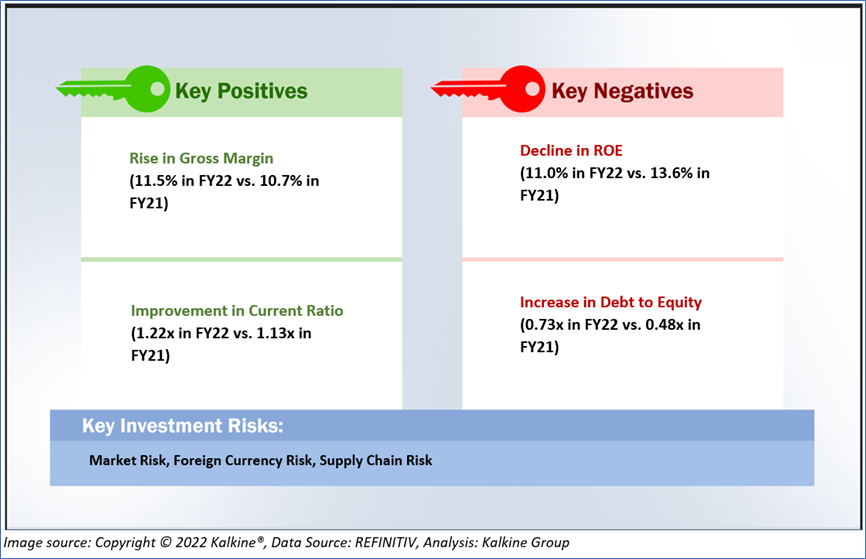
1.2 The Key Positives, Negatives, Investment Highlights and Risks
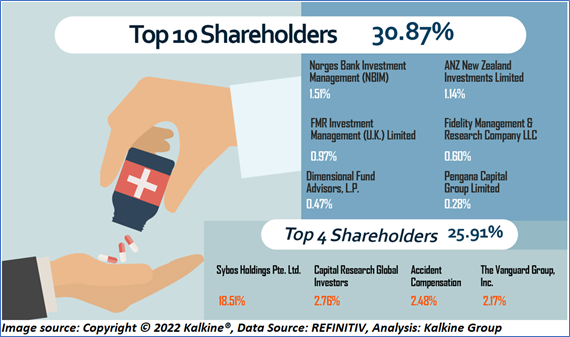
1.3 Top 10 Shareholders: The top 10 shareholders have been highlighted in the chart, which together forms ~30.87% of the total shareholding.
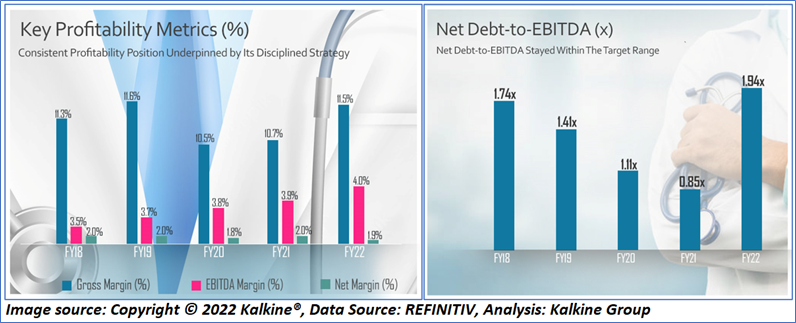
1.4 Key Metrics:
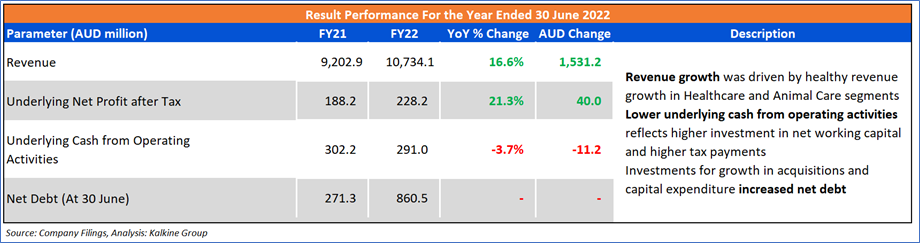
The company has reported a record result in FY22 with the revenue surpassing NZD10 billion for the first time, along with double-digit earnings growth supported by healthy organic growth in Healthcare and Animal Care segments, and future growth investments. The company has reported an improvement in EBITDA margin to reach 4.0% in FY22 from 3.9% in FY21. However, the ROE contracted to 11.0% in FY22 from 13.6% in FY21.
Section 2: Business Updates and Financial Highlights
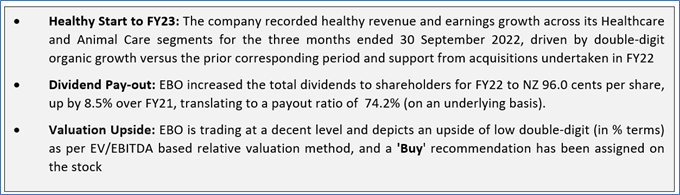
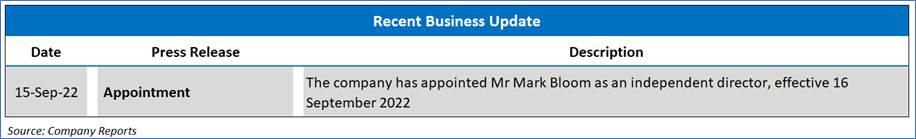
2.1 Recent Updates:
2.2 Financial Highlights:
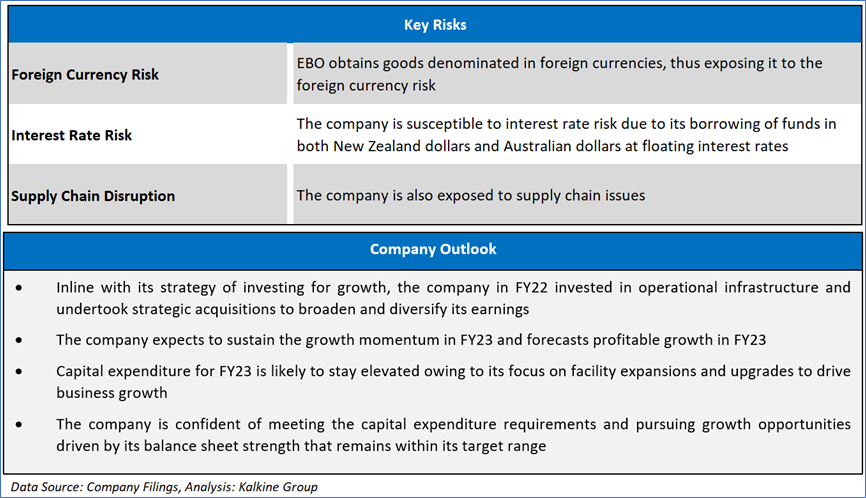
Section 3: Key Risks and Outlook:
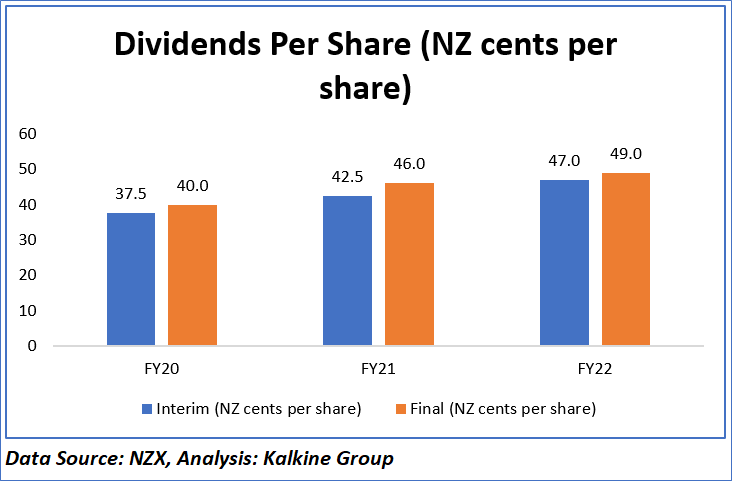
3.1 Dividend History: The company’s board declared the final dividend of NZ49.0 cents per share, taking the full year dividends per share to NZ96.0 cents for FY22, an increase of 8.5% over FY21, depicting a dividend payout ratio of 74.2% on an underlying basis.
Section 4: Stock Recommendation Summary:
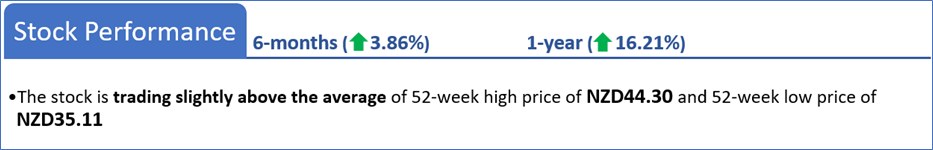
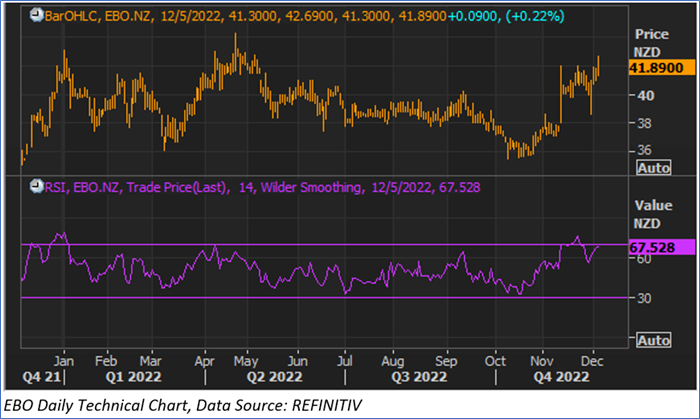
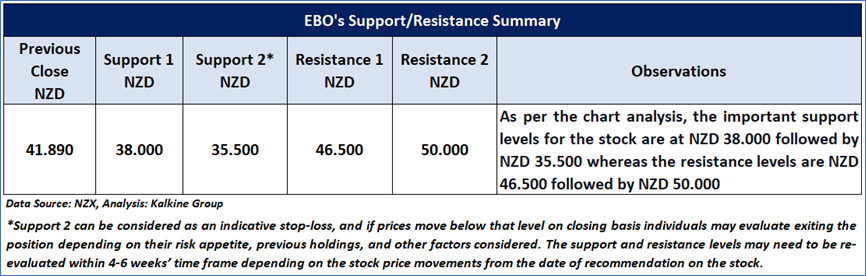
4.1 Price Performance and Technical Summary:
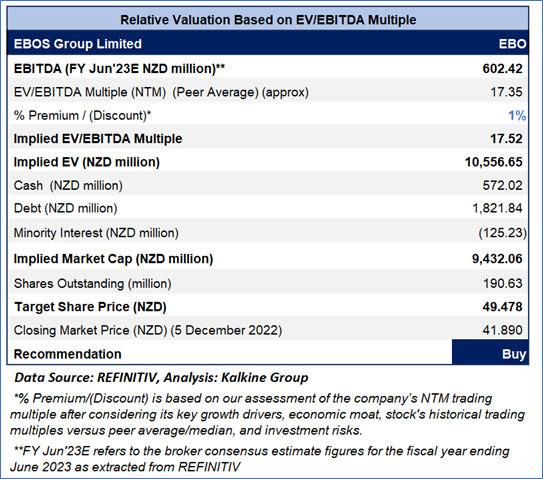
4.2 Recommendation
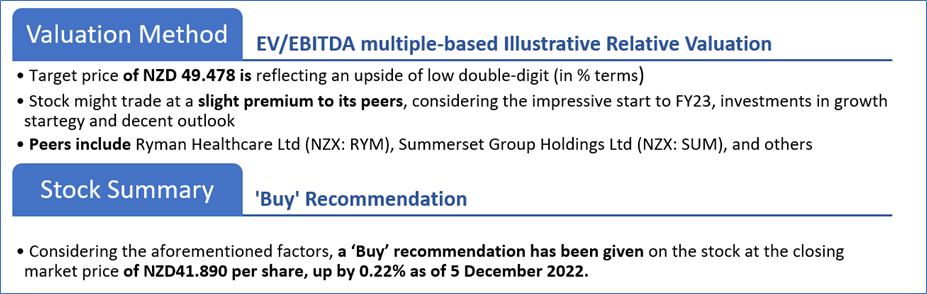
Markets are trading in a highly volatile zone currently due to certain macro-economic issues and geopolitical tensions prevailing. Therefore, it is prudent to follow a cautious approach while investing.
Note 1: Past performance is neither an indicator nor a guarantee of future performance.
Note 2: The reference date for all price data, currency, technical indicators, support, and resistance levels is December 5, 2022. The reference data in this report has been partly sourced from REFINITIV.
Note 3: Investment decisions should be made depending on an individual's appetite for upside potential, risks, holding duration, and any previous holdings. An 'Exit' from the stock can be considered if the Target Price mentioned as per the Valuation and or the technical levels provided has been achieved and is subject to the factors discussed above.
Technical Indicators Defined: -
Support: A level at which the stock prices tend to find support if they are falling, and a downtrend may take a pause backed by demand or buying interest. Support 1 refers to the nearby support level for the stock and if the price breaches the level, then Support 2 may act as the crucial support level for the stock.
Resistance: A level at which the stock prices tend to find resistance when they are rising, and an uptrend may take a pause due to profit booking or selling interest. Resistance 1 refers to the nearby resistance level for the stock and if the price surpasses the level, then Resistance 2 may act as the crucial resistance level for the stock.
Stop-loss: It is a level to protect further losses in case of unfavourable movement in the stock prices.
Disclaimer
Kalkine New Zealand Limited is a Financial Advice Provider (“FAP”) and is authorised by a Transitional FAP license issued by Financial Markets Authority (“FMA”) to provide financial advice. Kalkine provides only general financial advice through its research reports following a person becoming a member. The reports contain buy/sell/hold and other recommendations in relation to equity financial products. The recommendations and opinions [on this website] / [in this report] do not take into account any of your investment objectives, financial situation or needs. Before you make a decision about whether to acquire a financial product, you should obtain the Product Disclosure Statement from the product issuer. You should consider the appropriateness of advice taking into account your own objectives, financial situation and needs and seek independent financial advice before making any financial decisions. If you act on the advice in the research reports, you may have to pay fees, expenses or other amounts (but not to Kalkine). Further information about the complaints and dispute resolution process, as well as information about Kalkine’s duties are available on Kalkine’s website. Please read our Financial Advice Provider (FAP) disclosure statement and Complaints Handling Guide, which are available on the website.
Past performance is not a reliable indicator of future performance.
 Please wait processing your request...