Section 1: Company Overview and Fundamentals
1.1 Company Overview:
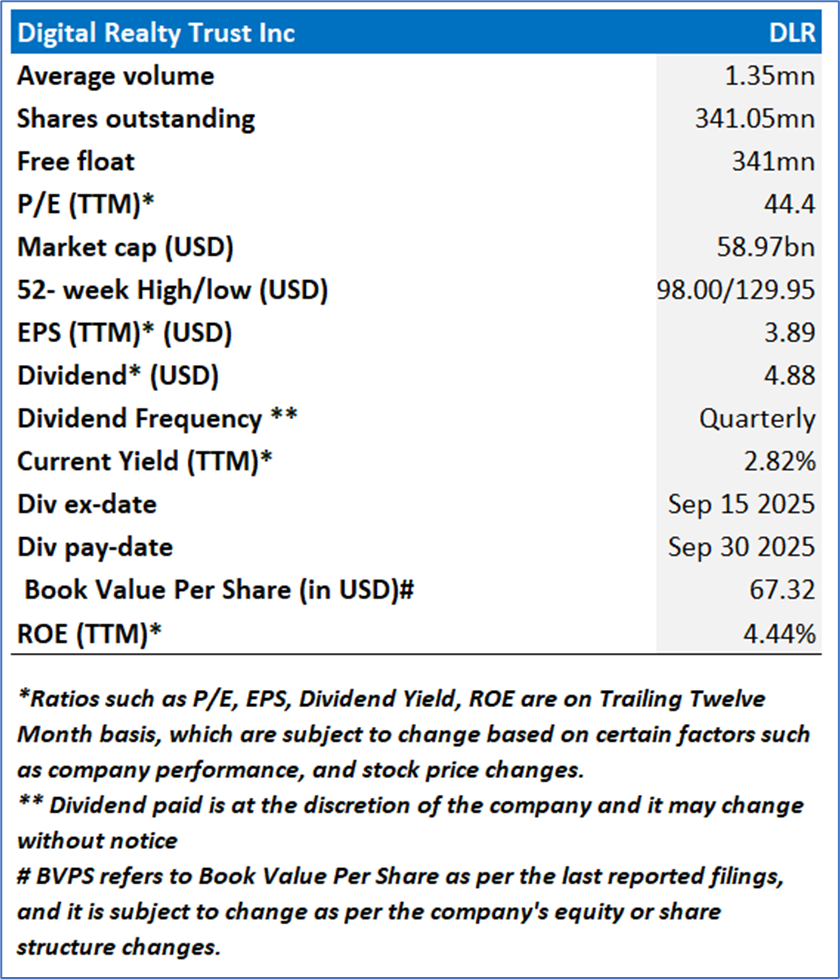
Digital Realty Trust, Inc. (NYSE: DLR) is a real estate investment trust. The Company owns, acquires, develops, and operates data centers through its operating partnership subsidiary, Digital Realty Trust, L.P. The Company is focused on providing data center, collocation, and interconnection solutions for domestic and international customers across a variety of industry verticals ranging from cloud and information technology services, communications and social networking to financial services, manufacturing, energy, healthcare, and consumer products.
Kalkine’s Dividend Income Report covers the Company Overview, Key positives & negatives, Investment summary, Key investment metrics, Top 10 shareholding, Business updates and insights into company recent financial results, Key Risks & Outlook, Price performance and technical summary, Target Price, and Recommendation on the stock.
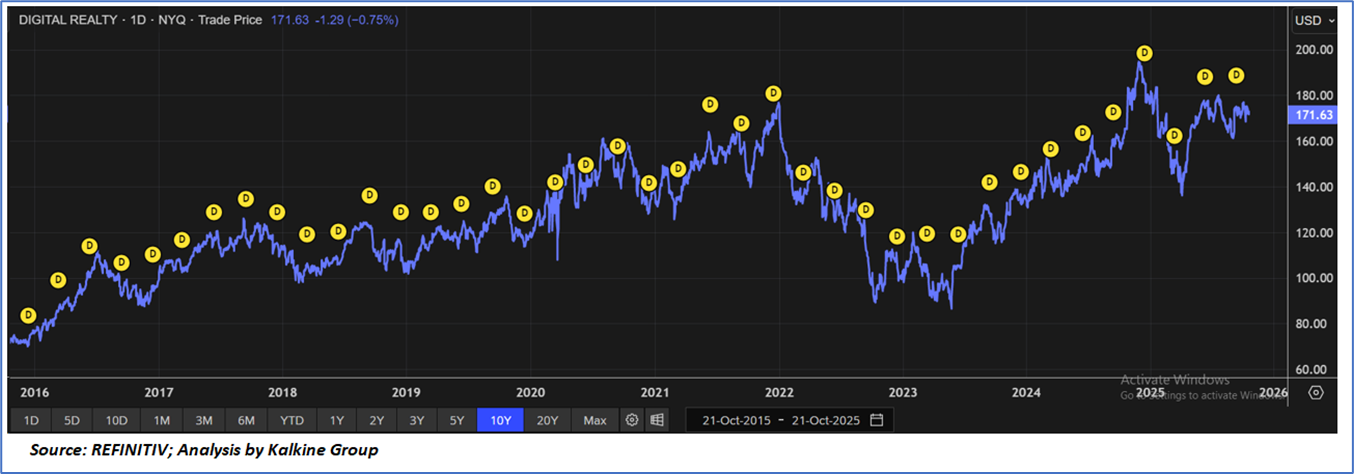
Price Performance:
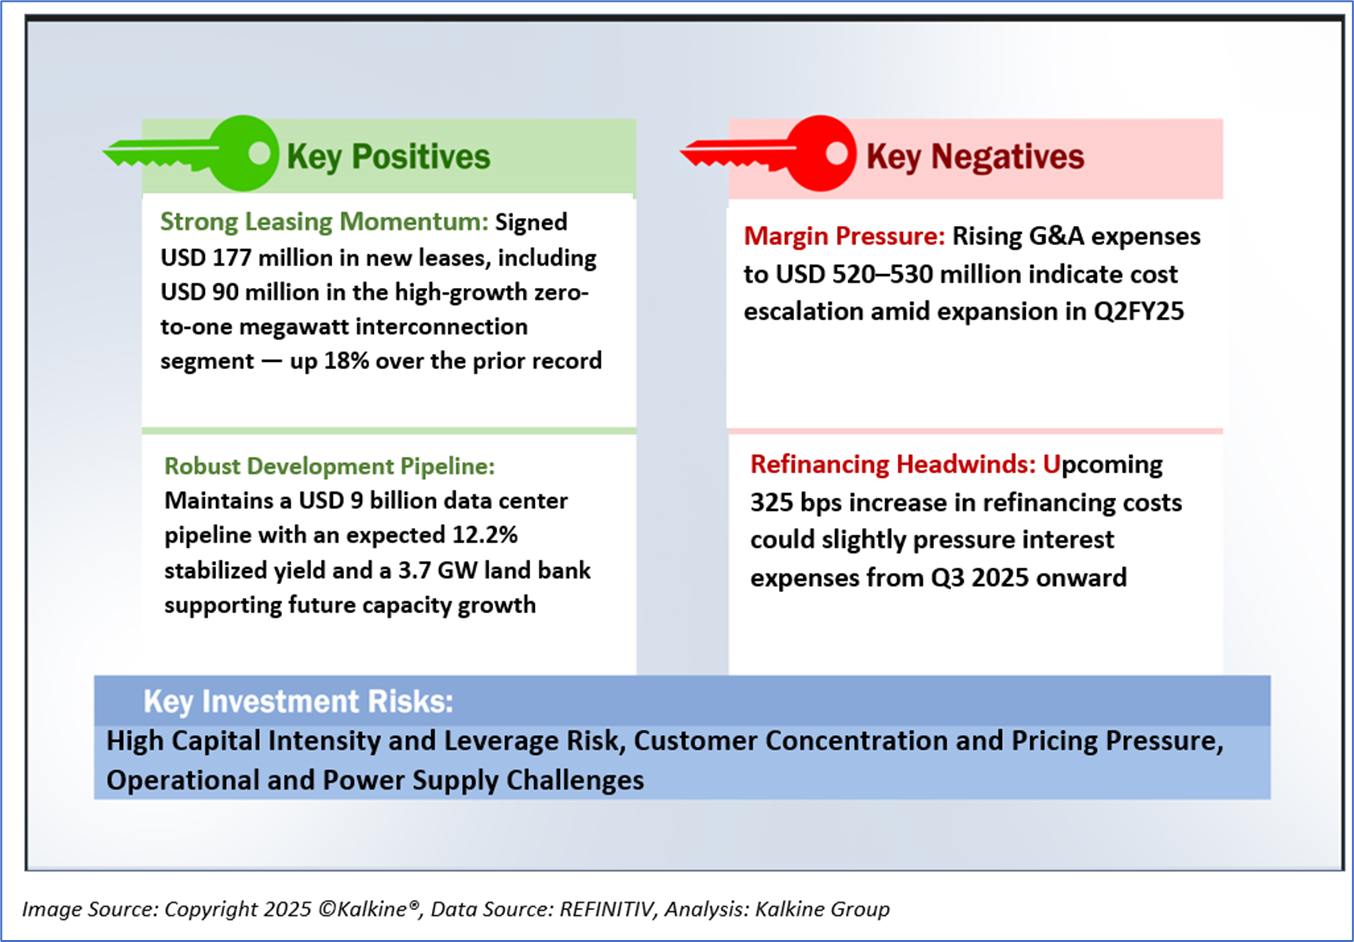
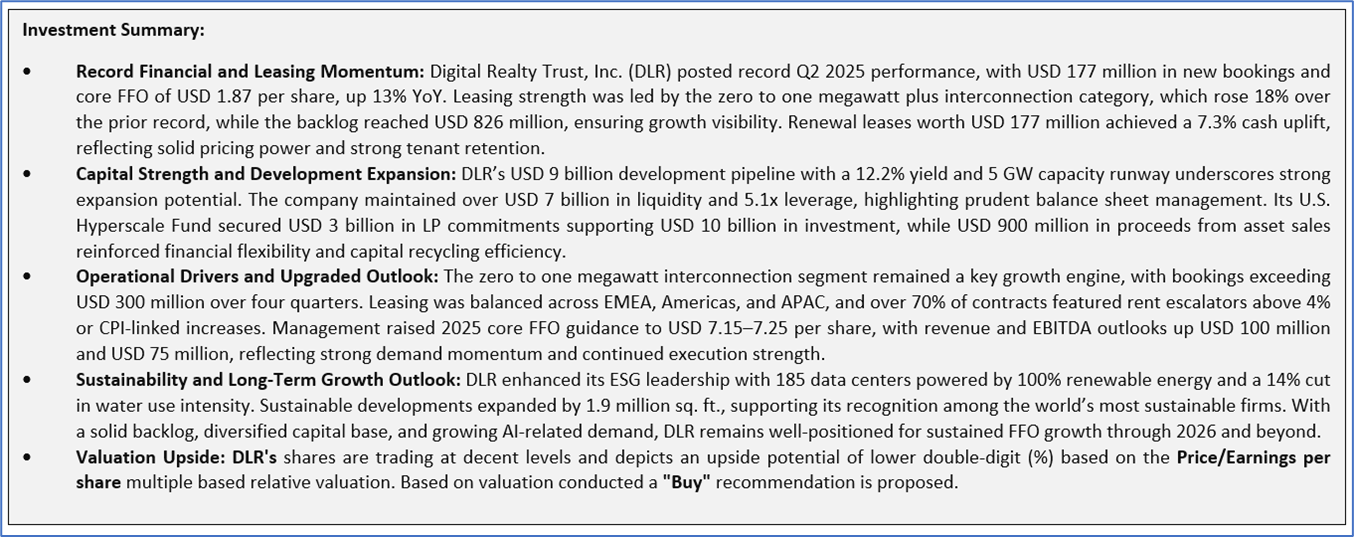
1.2 The Key Positives, Negatives, and Investment summary
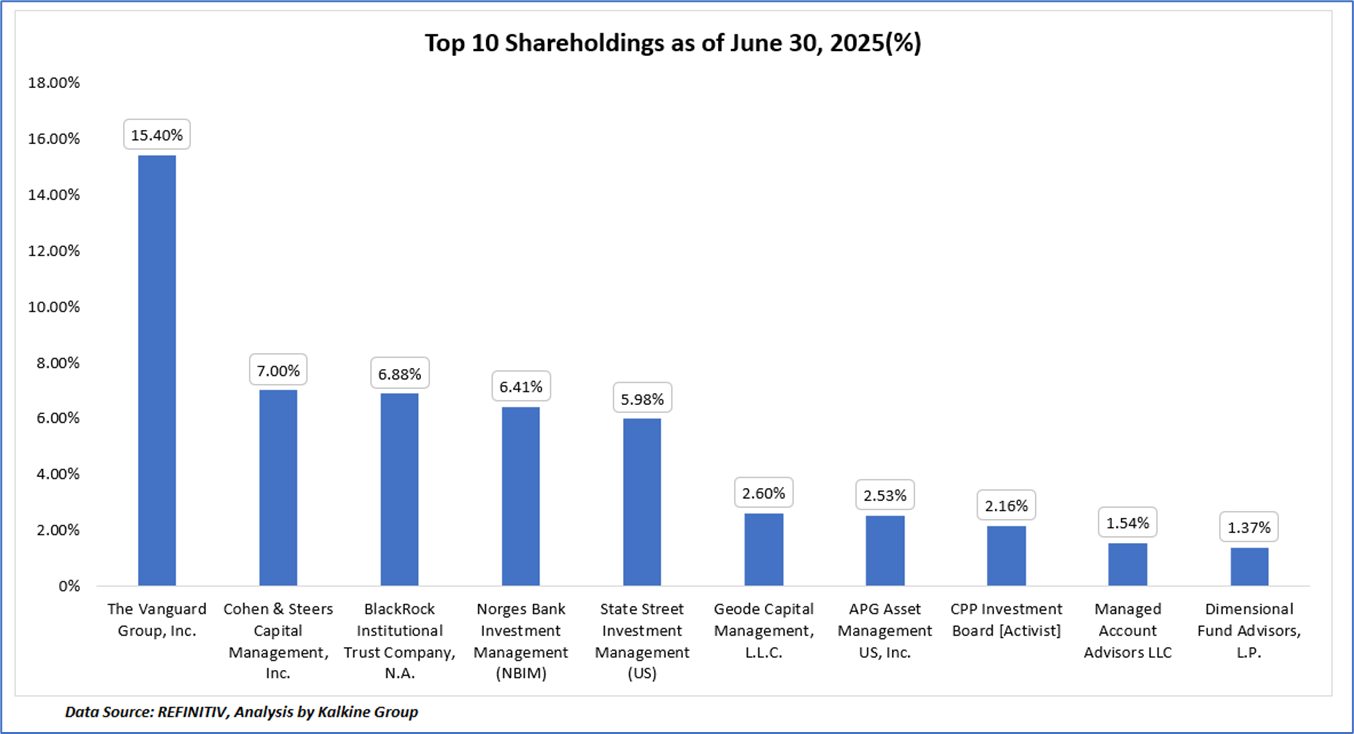
1.3 Top 10 shareholders:
The top 10 shareholders together form ~51.85% of the total shareholding, signifying diverse shareholding. The Vanguard Group Inc and Cohen & Steers Capital Management, Inc. are the biggest shareholders, holding the maximum stake in the company at ~15.40% and ~7.00%, respectively.
1.4 Dividend payments with impressive dividend yield:
Digital Realty Trust, Inc. (NYSE: DLR) maintains a consistent dividend record, currently paying a quarterly dividend of USD 1.22 per share (annualized USD 4.88), representing a forward yield of around 2.8%–2.9%. The company has upheld steady dividend growth over the past decade, reflecting its stable cash flows and strong REIT fundamentals. Although the payout ratio, estimated at over 120%, indicates high earnings distribution, the consistency underscores management’s commitment to shareholder returns. Overall, DLR’s dividend history reflects financial resilience and predictability, offering moderate income stability alongside long-term capital appreciation potential within the data-center REIT segment.
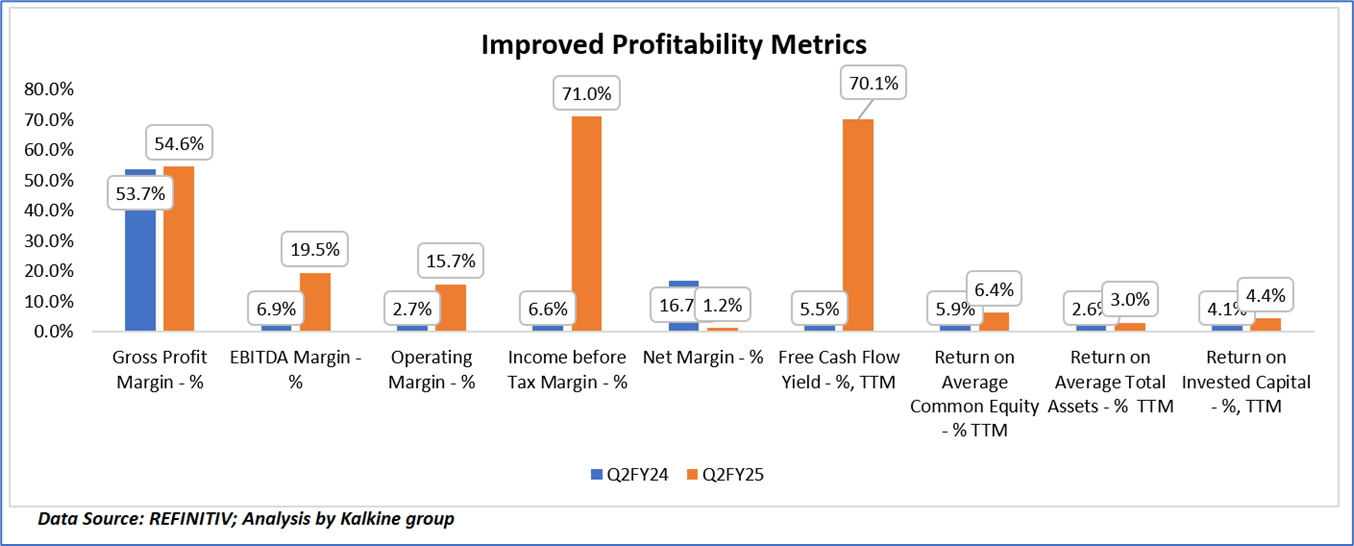
1.5 Key Metrics
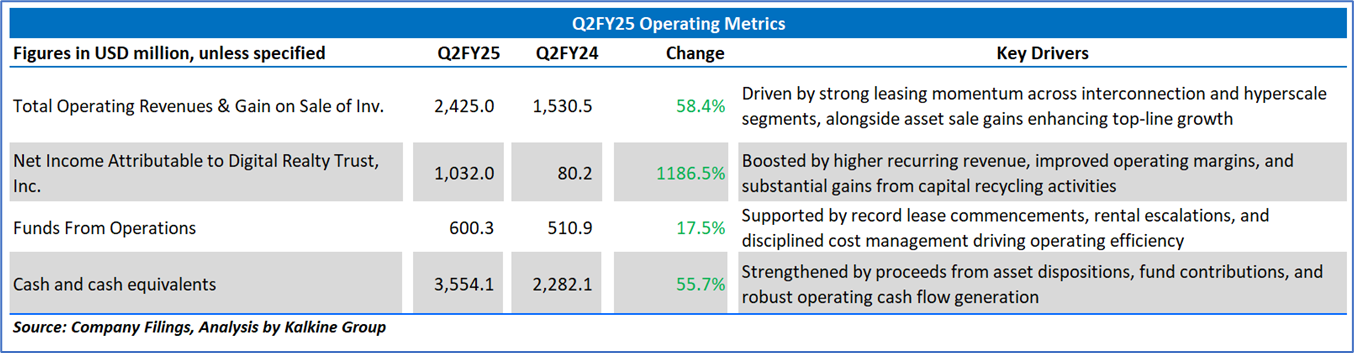
Digital Realty Trust, Inc. (NYSE: DLR) demonstrated significant margin expansion in Q2FY25, reflecting robust operational execution and improved efficiency. The gross profit margin increased marginally to 54.6%, while the EBITDA and operating margins rose sharply to 19.5% and 15.7%, respectively, driven by record leasing activity, disciplined cost management, and higher interconnection revenues. The substantial rise in income before tax margin to 71.0% underscores one-time gains from asset dispositions and strong underlying operating leverage, though the net margin of 1.2% reflects the normalization of those effects and non-cash adjustments. The company’s free cash flow yield surged to 70.1%, supported by enhanced liquidity and fund contributions from its U.S. Hyperscale Fund. Meanwhile, returns on equity, assets, and invested capital showed modest improvements, indicating steady capital efficiency and profitability, aligning with management’s strategic focus on sustainable FFO growth and capital optimization.
Section 2: Business Updates and Financial Highlights
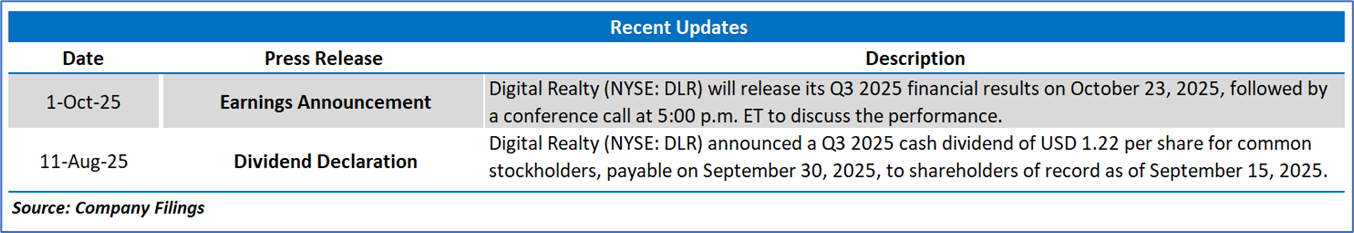
2.1 Recent Updates:
The below picture gives an overview of the recent updates:
2.2 Insights of Q2FY25:
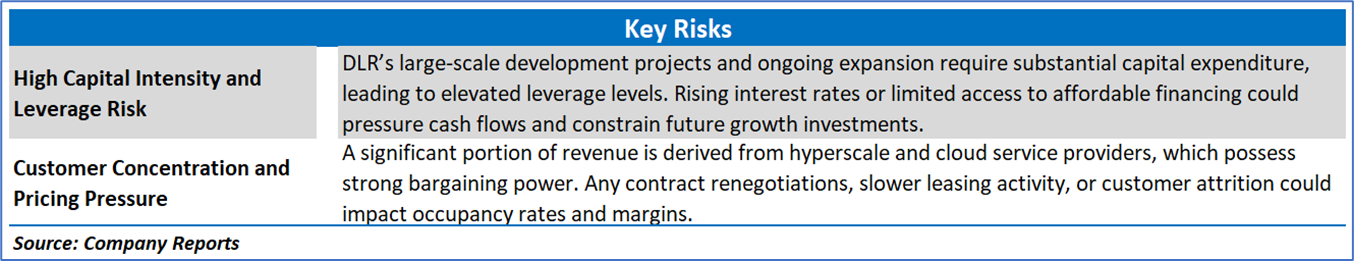
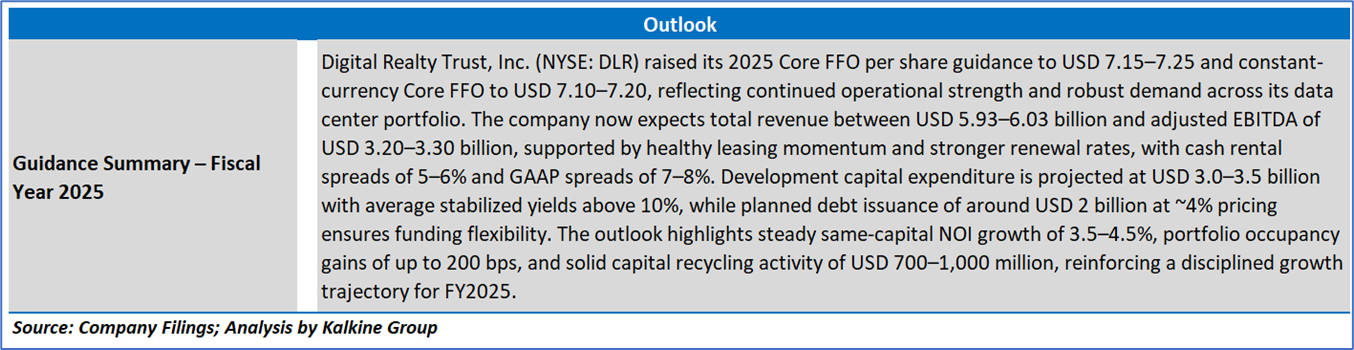
Section 3: Key Risks and Outlook:
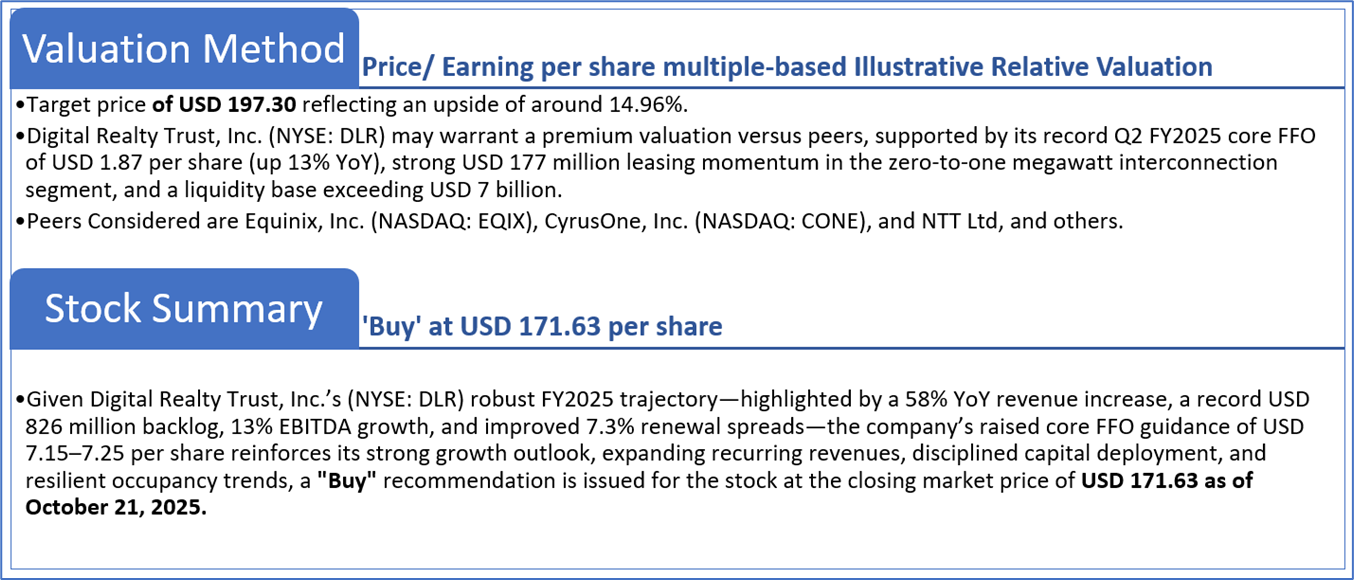
Section 4: Stock Recommendation Summary:
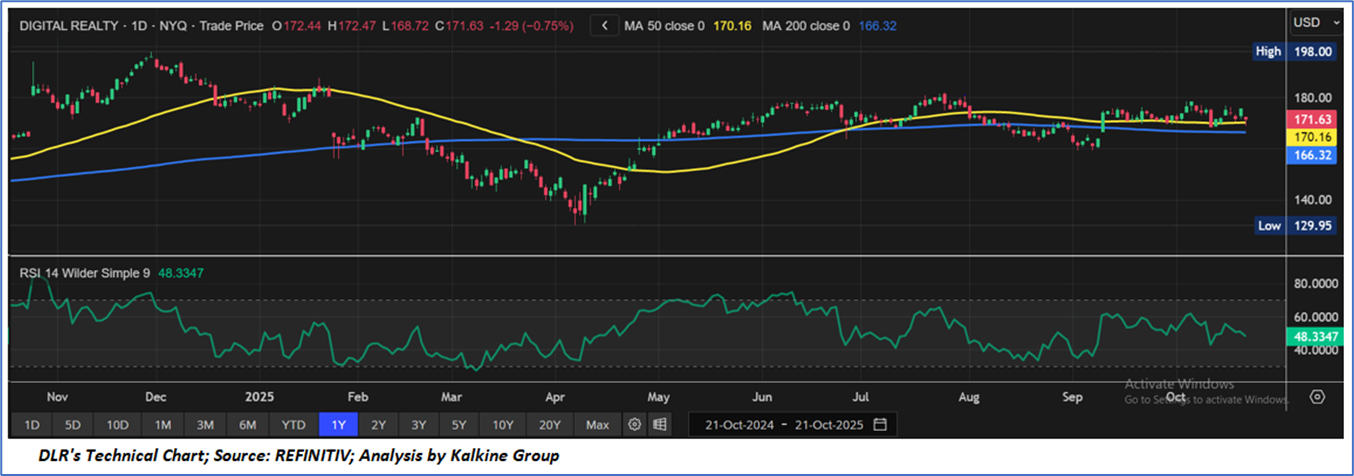
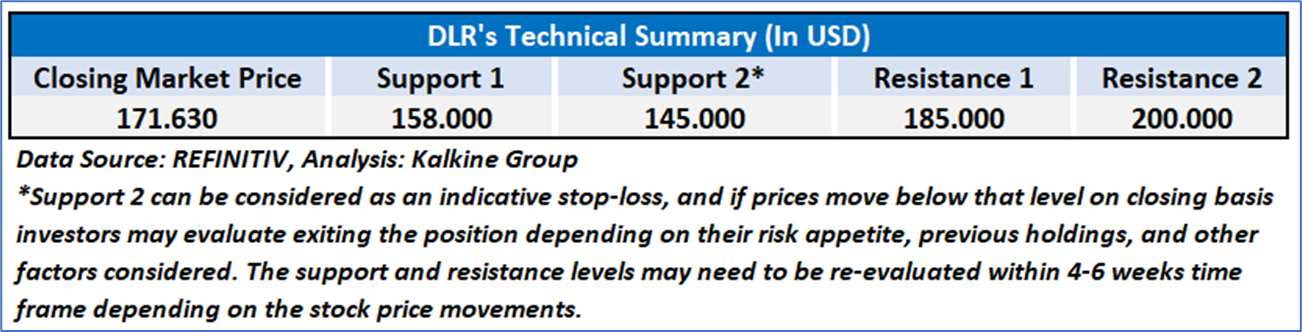
4.1 Technical Summary:
Price Performance:
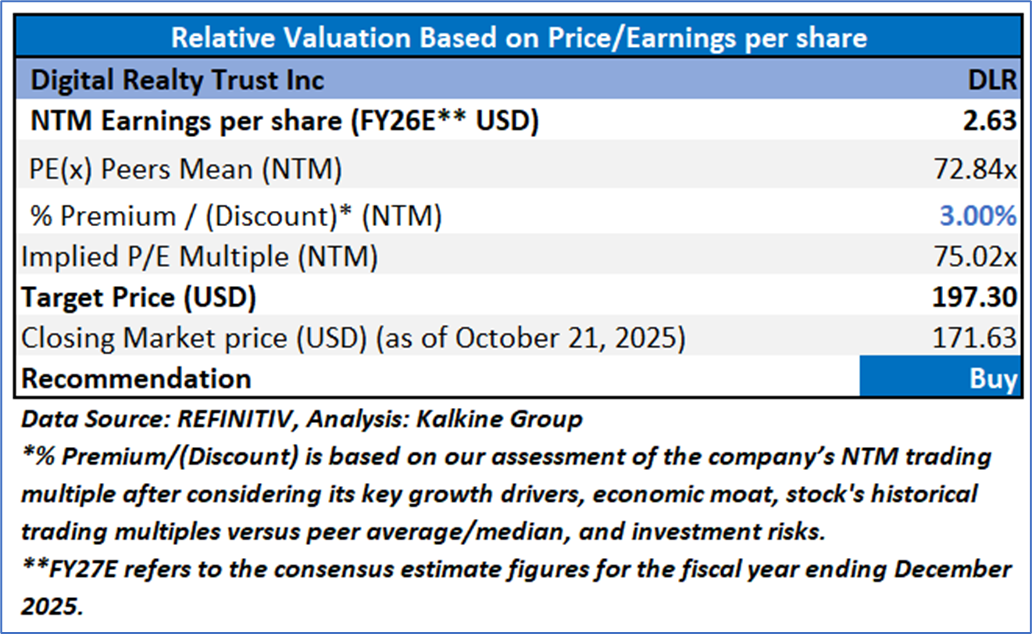
4.2 Fundamental Valuation
Valuation Methodology: Price/Earnings Per Share Multiple Based Relative Valuation
Markets are trading in a highly volatile zone currently due to certain macroeconomic issues and geopolitical tensions prevailing. Therefore, it is prudent to follow a cautious approach while investing.
Note 1: Past performance is not a reliable indicator of future performance.
Note 2: The reference date for all price data, currency, technical indicators, support, and resistance levels is October 21, 2025. The reference data in this report has been partly sourced from REFINITIV.
Note 3: Investment decisions should be made depending on an individual's appetite for upside potential, risks, holding duration, and any previous holdings. An 'Exit' from the stock can be considered if the Target Price mentioned as per the Valuation and or the technical levels provided has been achieved and is subject to the factors discussed above.
Note 4: The report publishing date is as per the Pacific Time Zone.
Technical Indicators Defined: -
Support: A level at which the stock prices tend to find support if they are falling, and a downtrend may take a pause backed by demand or buying interest. Support 1 refers to the nearby support level for the stock and if the price breaches the level, then Support 2 may act as the crucial support level for the stock.
Resistance: A level at which the stock prices tend to find resistance when they are rising, and an uptrend may take a pause due to profit booking or selling interest. Resistance 1 refers to the nearby resistance level for the stock and if the price surpasses the level, then Resistance 2 may act as the crucial resistance level for the stock.
Stop-loss: It is a level to protect against further losses in case of unfavorable movement in the stock prices.
This report (“Report”) has been issued by Kalkine New Zealand Limited (FSP691351) (NZBN:9429047678101) (“Kalkine”). Kalkine is a Financial Advice Provider (“FAP”) and is authorised by a Class 1 Financial Advice Provider Licence issued by Financial Markets Authority (“FMA”) to provide financial advice. Kalkine provides only general financial advice through its research reports following a person becoming a member. The reports contain buy/sell/hold and other recommendations in relation to equity securities, managed funds and other managed investment schemes and other financial advice products. The recommendations and opinions in this Report and on Kalkine website do not take into account any of your investment objectives, financial situation or needs. Before you make a decision about whether to acquire a financial product, you should obtain the Product Disclosure Statement from the product issuer. You should consider the appropriateness of advice taking into account your own objectives, financial situation and needs and seek independent financial advice before making any financial decisions. If you act on the advice in the research reports, you may have to pay fees, expenses or other amounts (but not to Kalkine).
The information in this Report and on the Kalkine website has been prepared from a wide variety of sources, which Kalkine, to the best of its knowledge and belief, considers accurate. Kalkine has made every effort to ensure the reliability of the information contained in its reports (including this Report), newsletters and websites. All information represents our views at the date of publication and may change without notice.
Kalkine does not issue, sell or deal in any financial products. The information in this Report does not constitute an offer to sell securities or other financial products or a solicitation of an offer to buy securities or other financial products. Our reports contain general recommendations to invest in securities and other financial products. Kalkine is not responsible for, and does not guarantee, the performance of, or returns on, any investments mentioned in this Report.
This Report may contain information on past performance of particular investments. Past performance is not a reliable indicator of future performance. Returns stated do not take into account transaction costs and taxes.
Further information about the complaints and dispute resolution process, as well as information about Kalkine’s duties are available on Kalkine’s website. Please read our Financial Advice Provider (FAP) disclosure statement and Complaints Handling Guide, which are available on the website.
Copyright 2025 Krish Capital Pty. Ltd. (ABN 61629651510). All Rights Reserved. No part of this Report, or its content, may be reproduced in any form without our prior consent.
Past performance is not a reliable indicator of future performance.
 Please wait processing your request...