
Section 1: Company Overview and Fundamentals
1.1 Company Overview:
Dell Technologies Inc. (NYSE: DELL) is engaged in designing, developing, manufacturing, marketing, selling, and supporting a wide range of comprehensive and integrated solutions, products, and services. The Company operates through two segments: Infrastructure Solutions Group (ISG) and Client Solutions Group (CSG).
Kalkine’s Dividend Income Report covers the Company Overview, Key positives & negatives, Investment summary, Key investment metrics, Top 10 shareholding, Business updates and insights into company recent financial results, Key Risks & Outlook, Price performance and technical summary, Target Price, and Recommendation on the stock.
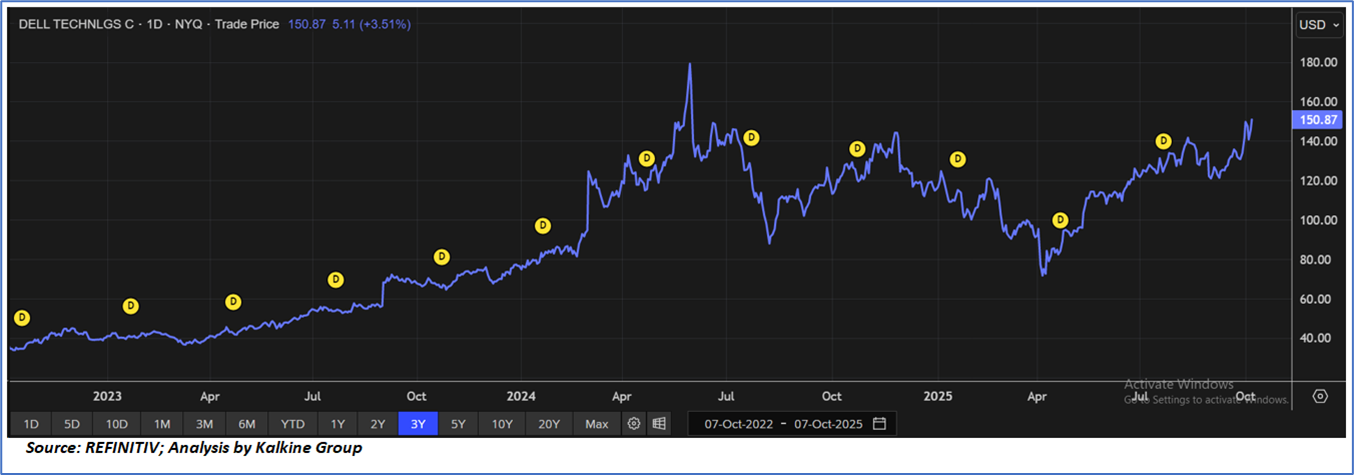
Price Performance:
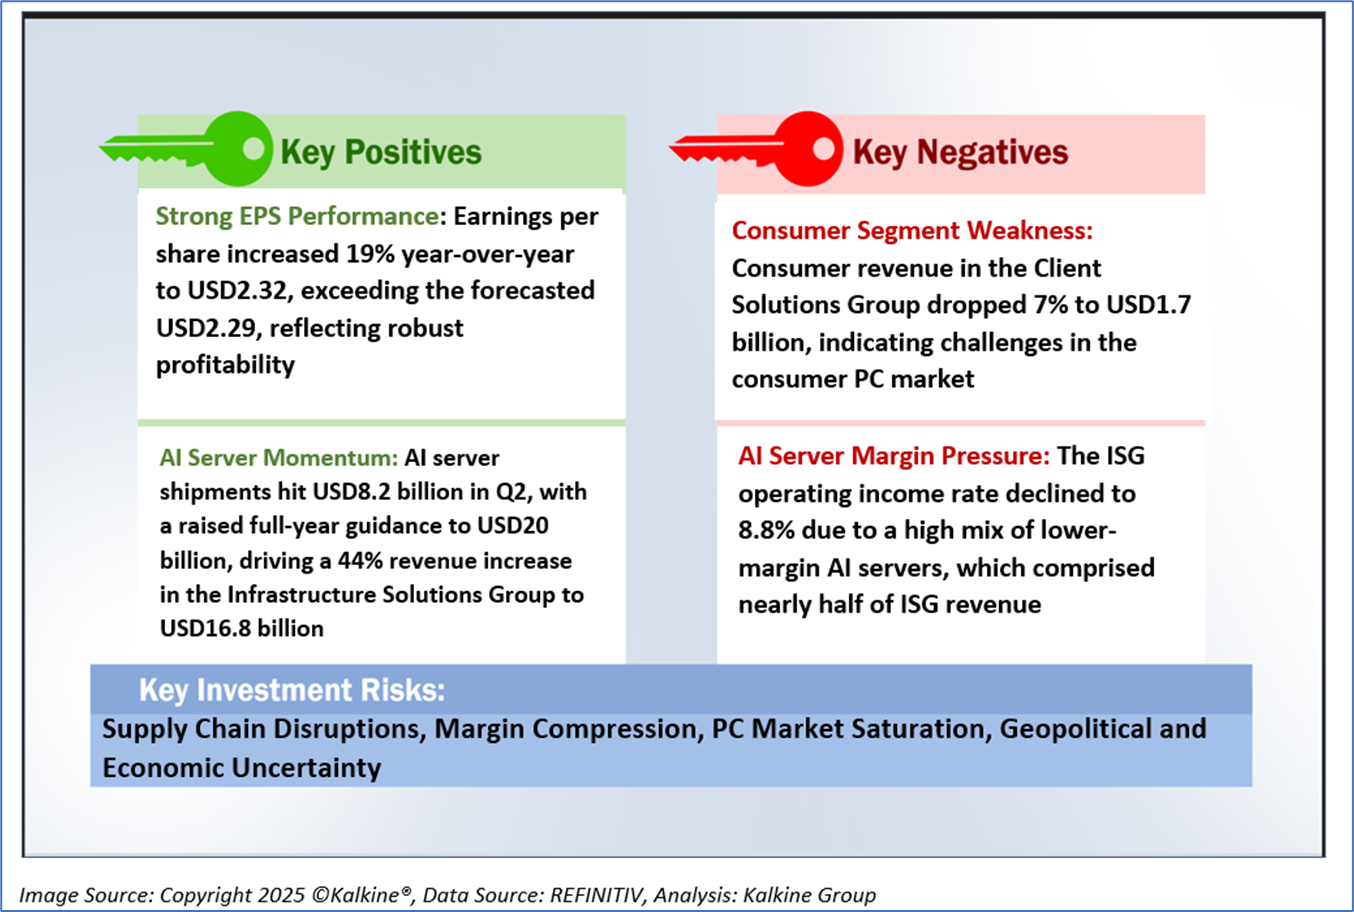
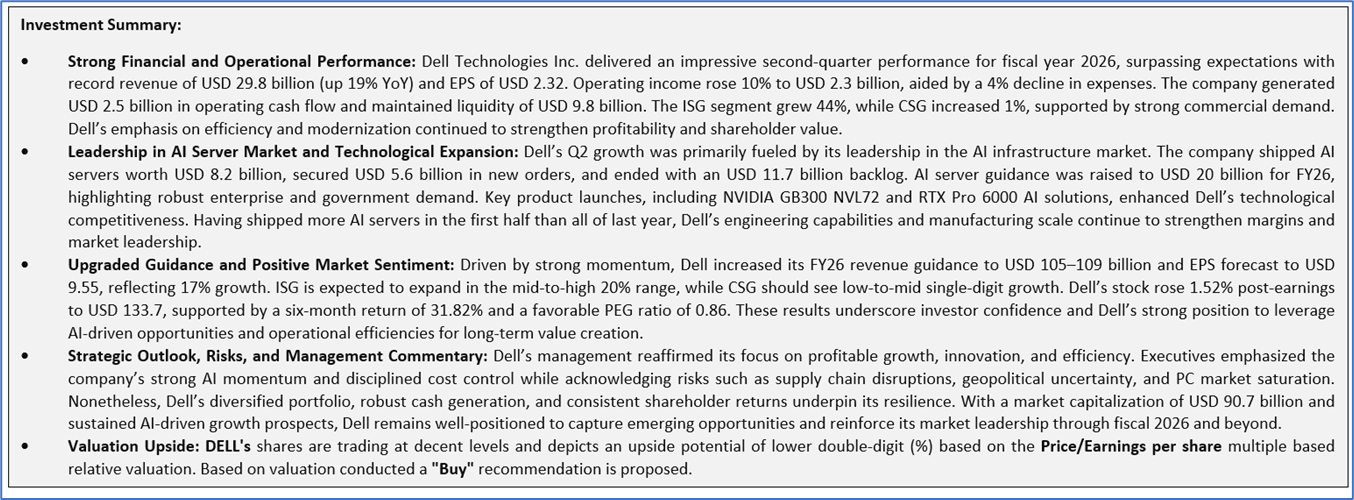
1.2 The Key Positives, Negatives, and Investment summary
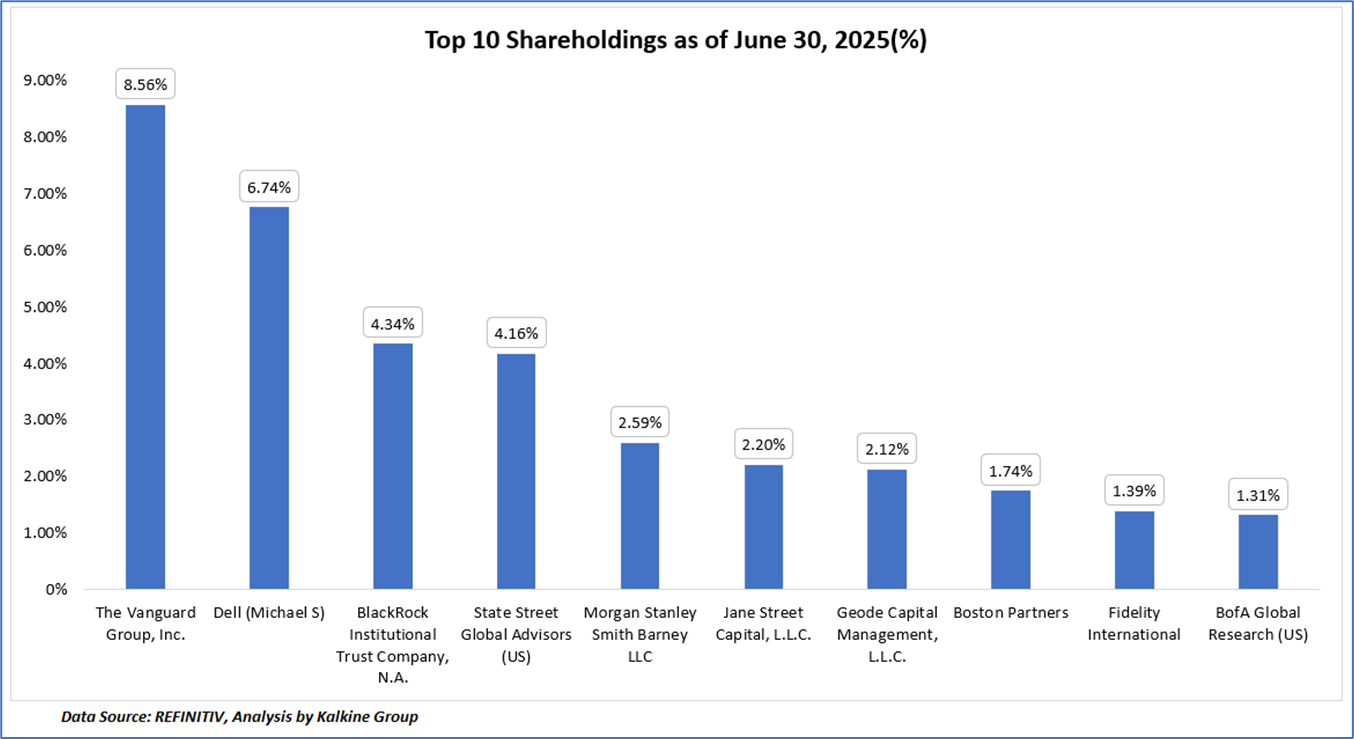
1.3 Top 10 shareholders:
The top 10 shareholders together form 35.15% of the total shareholding, signifying concentrated shareholding. The Vanguard Group, Inc., Inc. and Dell (Michael S) are the biggest shareholders, holding the maximum stake in the company at ~8.56% and ~6.74%, respectively.
1.4 Dividend payments with impressive dividend yield:
Dell Technologies Inc. has maintained a consistent and progressive dividend policy, reflecting the company’s strong cash flow generation and commitment to shareholder returns. The company initiated regular dividend payments in February 2022 following a period of balance sheet strengthening post its VMware spin-off, marking a key step toward returning capital to shareholders. Since then, Dell has followed a pattern of quarterly dividend distributions, as indicated by the yellow “D” markers on the chart, aligning with its fiscal quarters.
In February 2025, Dell’s board approved an 18% increase in its annual dividend to USD 2.10 per common share, translating to a quarterly payout of USD 0.525 per share, payable most recently on October 31, 2025, to shareholders of record as of October 21, 2025. This consistent dividend growth demonstrates management’s confidence in sustainable earnings and robust free cash flow generation.
Over the past three years, Dell’s dividend trajectory has mirrored its financial strength, supported by a steady rise in operating cash flows and reduced leverage. The stock currently offers a dividend yield of approximately 1.44%, which, while moderate, is complemented by the company’s strong capital appreciation potential driven by its leadership in AI infrastructure and enterprise solutions. Dell’s disciplined capital allocation strategy—balancing reinvestment in growth initiatives with shareholder distributions—positions it as a financially sound technology firm delivering stable and growing returns.
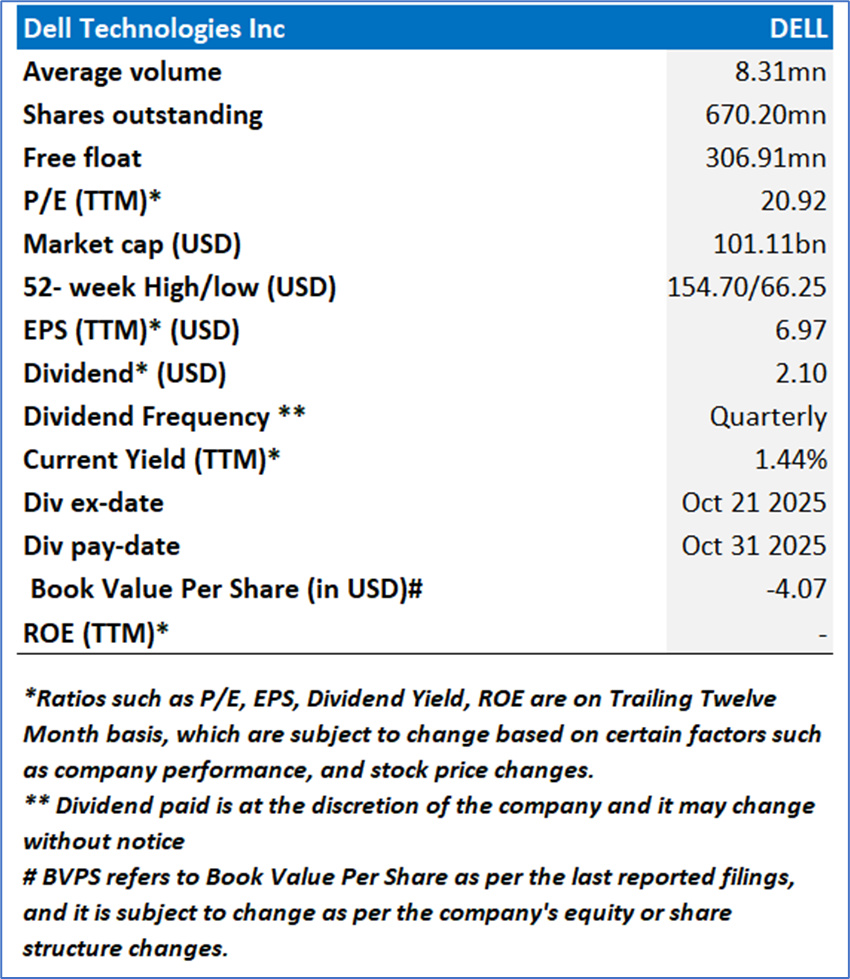
1.5 Key Metrics
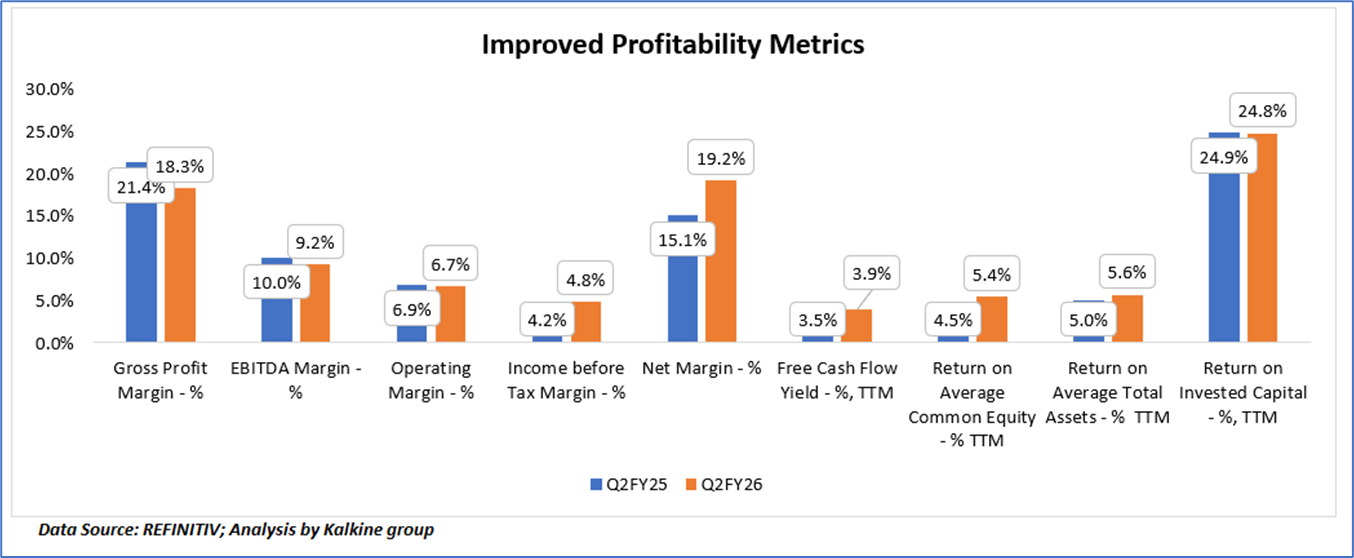
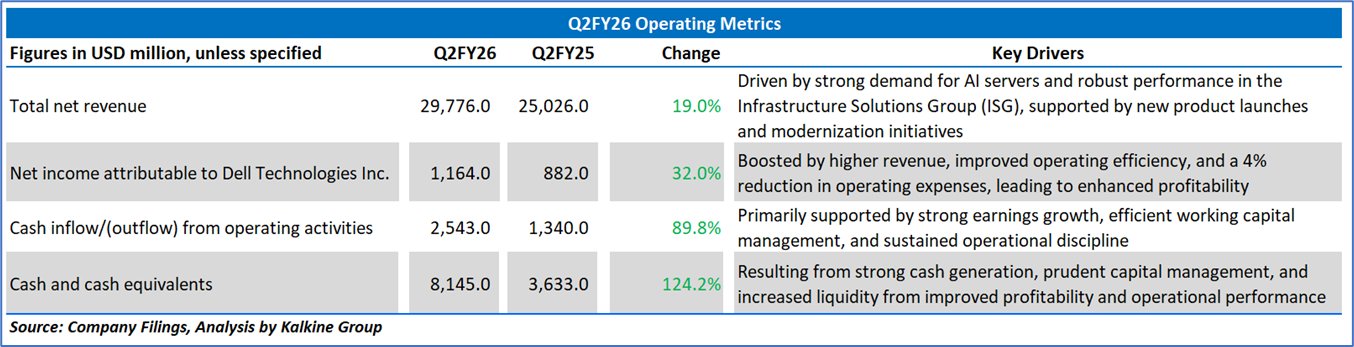
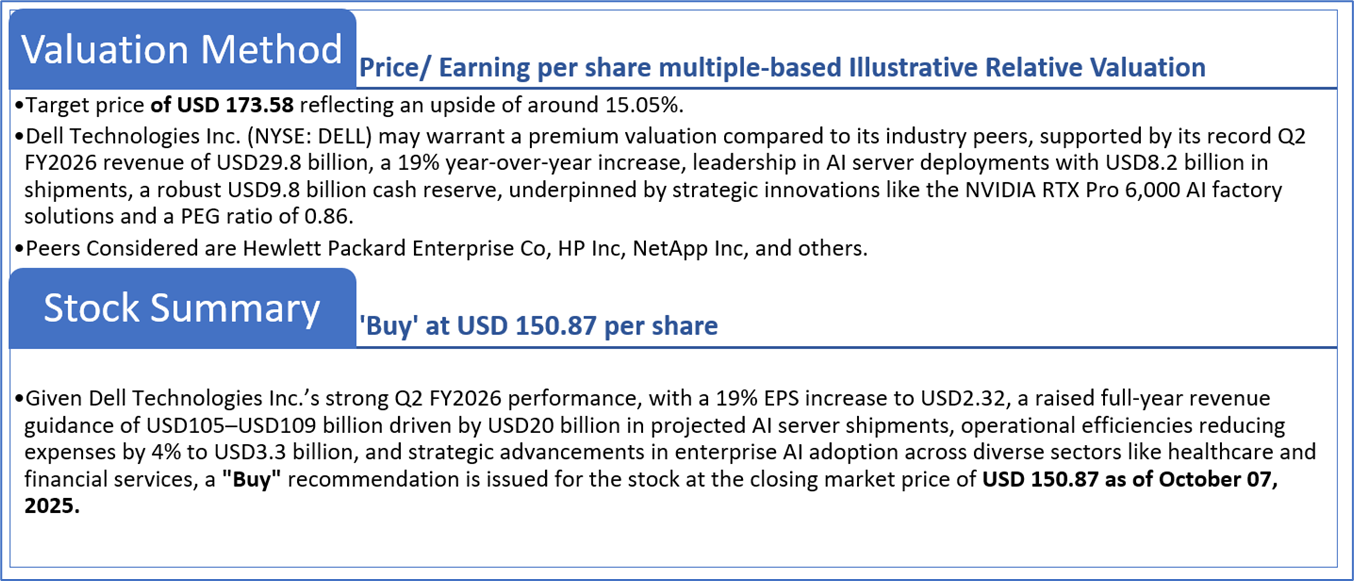
Dell Technologies Inc. (NYSE: DELL) showcased a mixed financial performance in Q2 FY2026, with a record revenue of USD29.8 billion (up 19% year-over-year) and an EPS of USD2.32 (up 19%), driven by strong AI server shipments of USD8.2 billion and operational efficiencies reducing expenses by 4% to USD3.3 billion, though tempered by a gross margin decline from 21.4% to 18.3% due to a high mix of lower-margin AI servers and a slight EBITDA margin drop from 10.0% to 9.2%. The company’s net margin improved significantly from 15.1% to 19.2%, supported by a 10% operating income increase to USD2.3 billion and a robust USD2.5 billion cash flow from operations, enabling USD1.3 billion in shareholder returns. However, challenges include a 3% storage revenue decline to USD3.9 billion, a 7% consumer revenue drop to USD1.7 billion, and modest Client Solutions Group growth of 1% to USD12.5 billion, with a cautious FY2026 CSG outlook of low to mid-single-digit growth. Despite these, Dell’s raised full-year revenue guidance to USD105–USD109 billion, AI server shipment forecast of USD20 billion, and strong financial health with a USD9.8 billion cash reserve and improved returns on equity (5.4%) and assets (5.6%) position it as a compelling investment, particularly for its AI and infrastructure leadership, though investors should monitor margin pressures and PC market softness.
Section 2: Business Updates and Financial Highlights
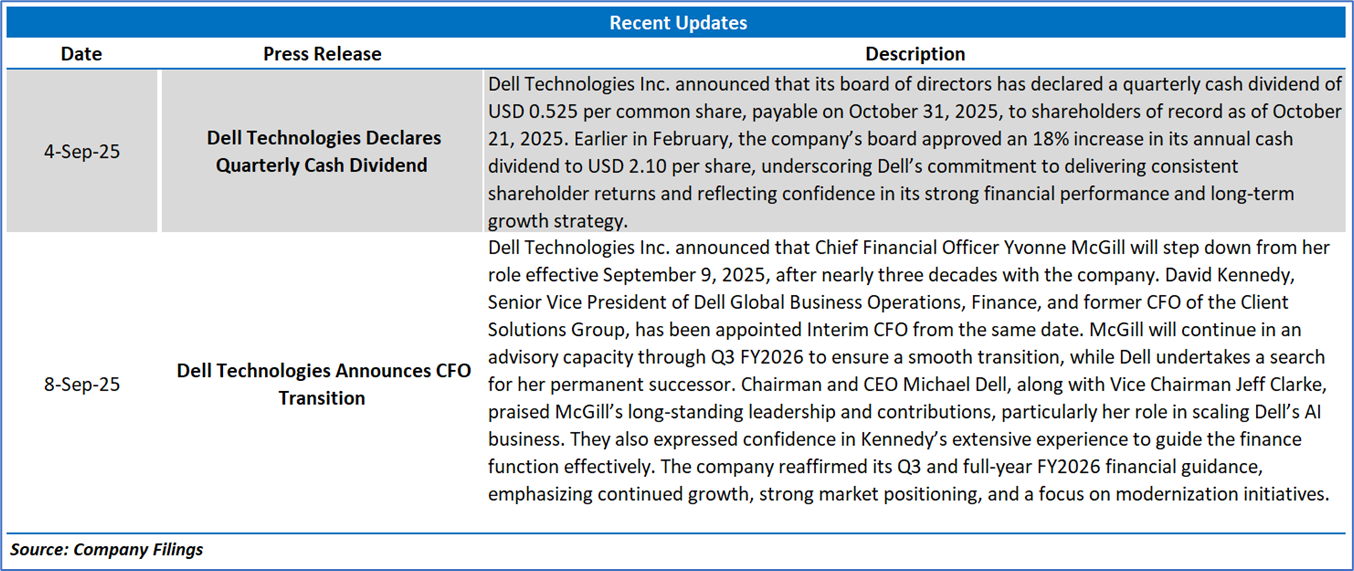
2.1 Recent Updates:
The below picture gives an overview of the recent updates:
2.2 Insights of Q2FY26:
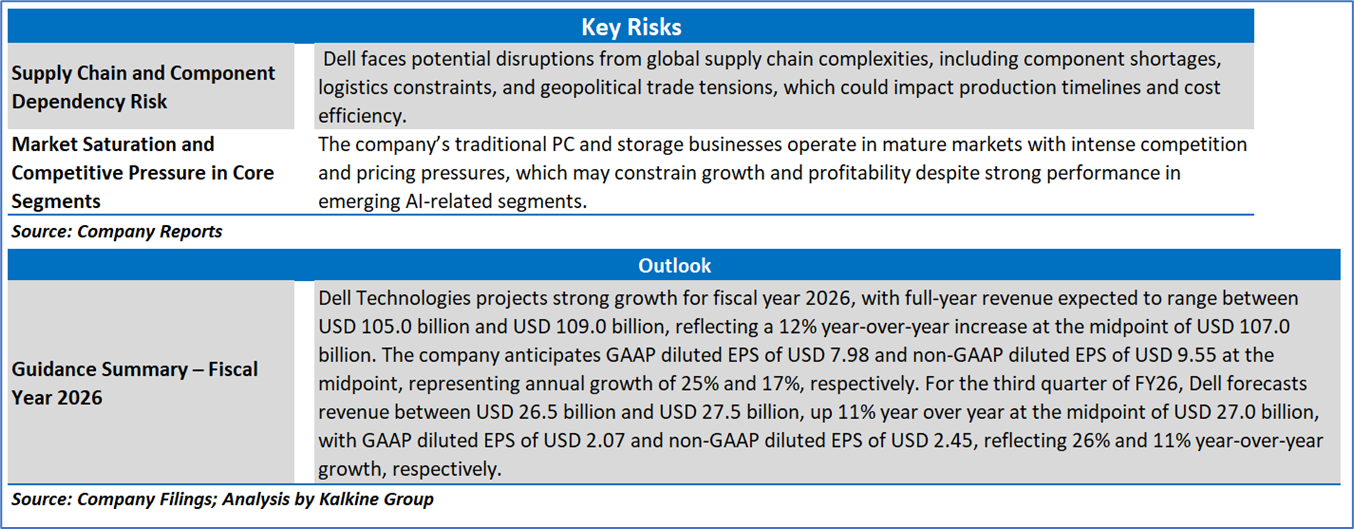
Section 3: Key Risks and Outlook:
Section 4: Stock Recommendation Summary:
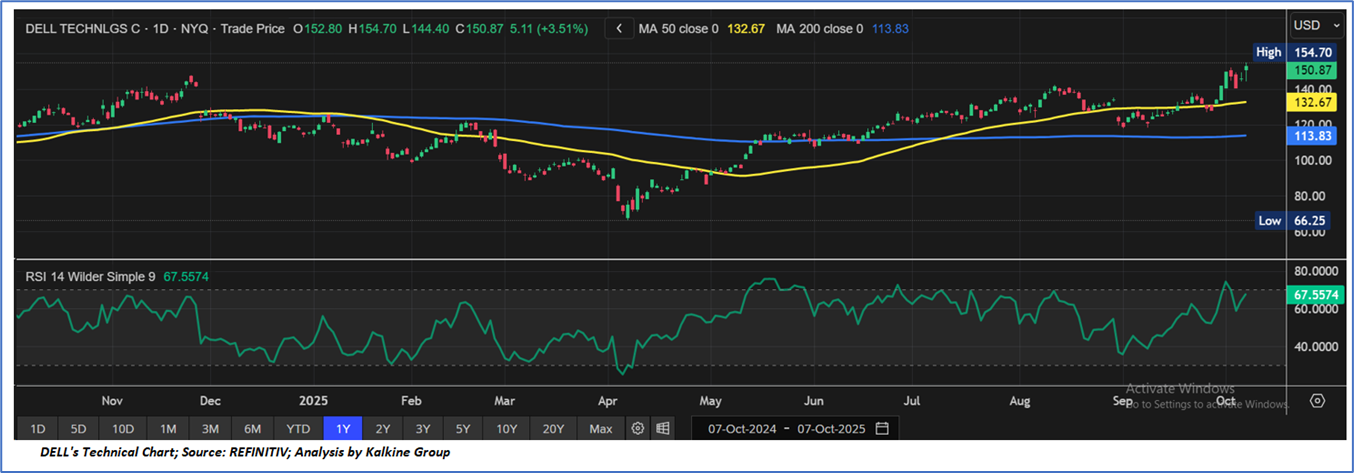
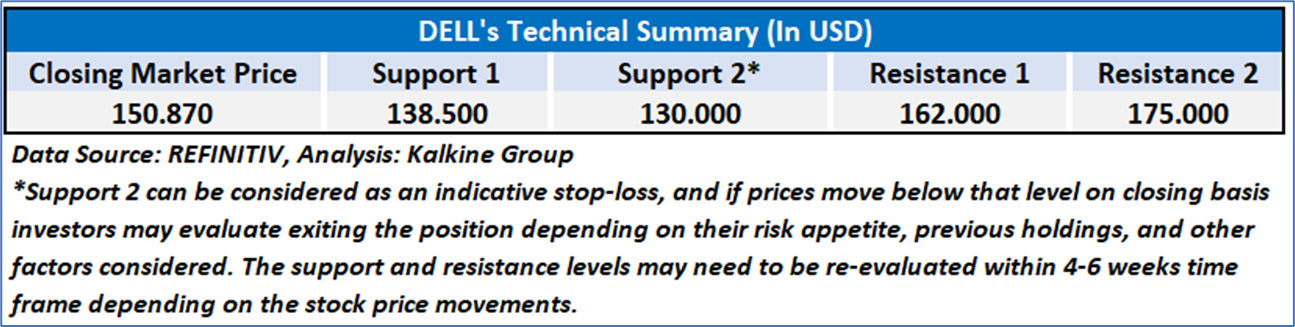
4.1 Technical Summary:
Price Performance:
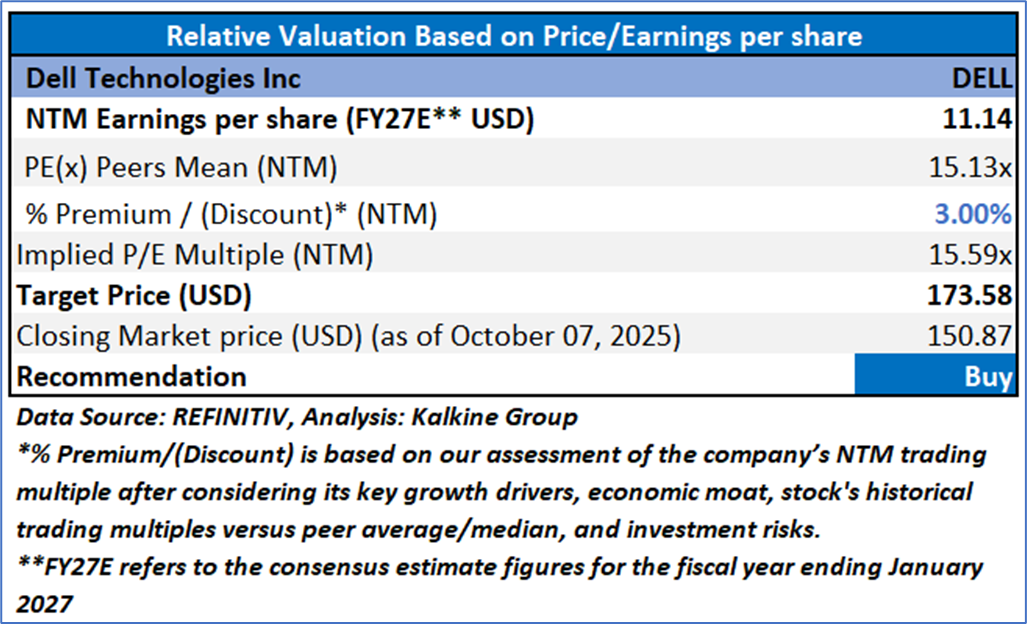
4.2 Fundamental Valuation
Valuation Methodology: Price/Earnings Per Share Multiple Based Relative Valuation
Markets are trading in a highly volatile zone currently due to certain macroeconomic issues and geopolitical tensions prevailing. Therefore, it is prudent to follow a cautious approach while investing.
Note 1: Past performance is not a reliable indicator of future performance.
Note 2: The reference date for all price data, currency, technical indicators, support, and resistance levels is October 07, 2025. The reference data in this report has been partly sourced from REFINITIV.
Note 3: Investment decisions should be made depending on an individual's appetite for upside potential, risks, holding duration, and any previous holdings. An 'Exit' from the stock can be considered if the Target Price mentioned as per the Valuation and or the technical levels provided has been achieved and is subject to the factors discussed above.
Note 4: The report publishing date is as per the Pacific Time Zone.
Technical Indicators Defined: -
Support: A level at which the stock prices tend to find support if they are falling, and a downtrend may take a pause backed by demand or buying interest. Support 1 refers to the nearby support level for the stock and if the price breaches the level, then Support 2 may act as the crucial support level for the stock.
Resistance: A level at which the stock prices tend to find resistance when they are rising, and an uptrend may take a pause due to profit booking or selling interest. Resistance 1 refers to the nearby resistance level for the stock and if the price surpasses the level, then Resistance 2 may act as the crucial resistance level for the stock.
Stop-loss: It is a level to protect against further losses in case of unfavorable movement in the stock prices.
Disclaimer This report has been issued by Kalkine New Zealand Limited (FSP691351) (NZBN:9429047678101) (“Kalkine”). Kalkine is a Financial Advice Provider (“FAP”) and is authorised by a Class 1 Financial Advice Provider Licence issued by Financial Markets Authority (“FMA”) to provide financial advice. Kalkine provides only general financial advice through its research reports following a person becoming a member. The reports contain buy/sell/hold and other recommendations in relation to equity securities, managed funds and other managed investment schemes and other financial advice products. The recommendations and opinions in this report and on Kalkine website do not take into account any of your investment objectives, financial situation or needs. Before you make a decision about whether to acquire a financial product, you should obtain the Product Disclosure Statement from the product issuer. You should consider the appropriateness of advice taking into account your own objectives, financial situation and needs and seek independent financial advice before making any financial decisions. If you act on the advice in the research reports, you may have to pay fees, expenses or other amounts (but not to Kalkine). Further information about the complaints and dispute resolution process, as well as information about Kalkine’s duties are available on Kalkine’s website. Please read our Financial Advice Provider (FAP) disclosure statement and Complaints Handling Guide, which are available on the website.
Past performance is not a reliable indicator of future performance.
 Please wait processing your request...