Section 1: Company Overview, Low Carbon Emission Initiatives and Fundamentals
Section 1.1: CSL Limited (ASX: CSL) is engaged in the research, development, manufacturing, marketing and distribution of biopharmaceutical products and vaccines. The ASX-listed biotechnology company includes three businesses, CSL Behring, CSL Seqirus and CSL Vifor. Kalkine’s Low Carbon Research Report covers the Investment Highlights, Low Carbon Emission Initiatives, Key Financial Metrics, Risks, and Technical Analysis along with the Valuation, Target Price, and Recommendation on the stock.
Section 1.2: Why Low Carbon Emission Matters?
The shift toward a low-carbon economy is one of the most significant challenges of current time, spurred by the urgent need to combat climate change and reduce the environmental impact of corporate activities. This report covers the ASX-listed low-carbon emission company, CSL Limited (ASX: CSL), that is committed to sustainability and responsible environmental practices.
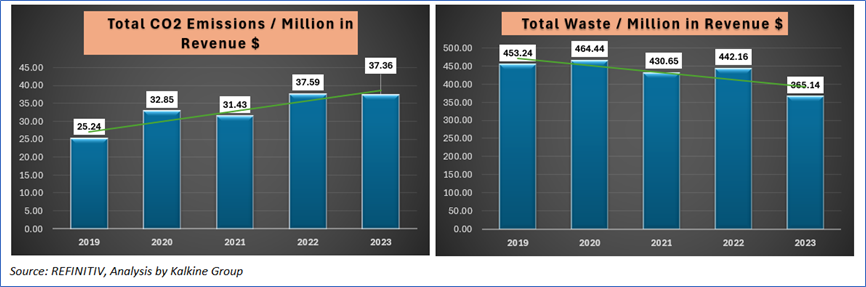
Carbon and Waste Management - Key Metrics
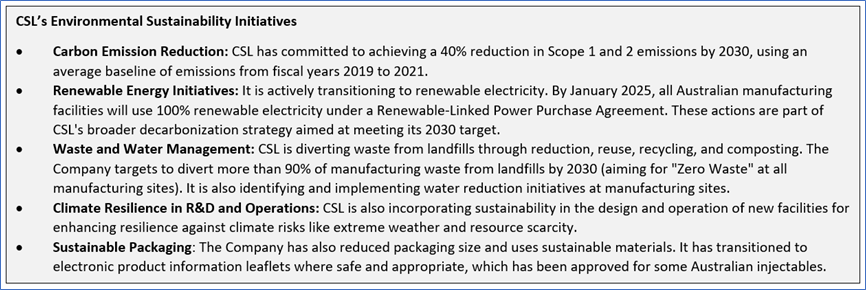
CSL’s initiatives to reduce carbon emissions are focused on achieving their 2030 emissions reduction target and addressing both direct and indirect emissions. CSL’s sustained environmental efforts have been translated to reduce waste management metrics since 2019.
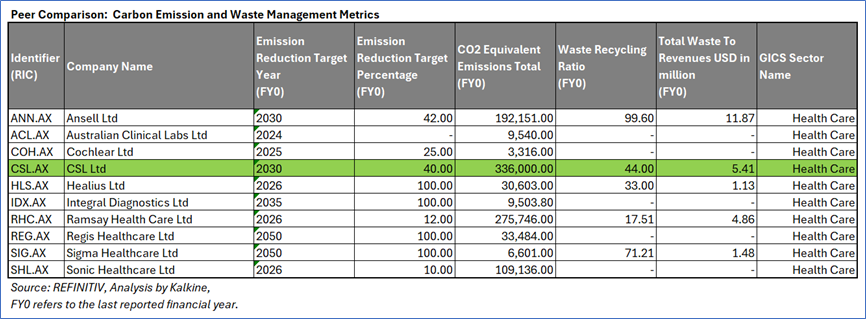
Peer Comparison: Carbon Emission and Waste Management Metrics
CSL Ltd has committed to a 40% reduction in Scope 1 and Scope 2 emissions by 2030, with current CO2 equivalent emissions totaling 336,000 metric tons. In waste management, CSL achieves a 44% waste recycling ratio, which is moderate compared to industry peers.
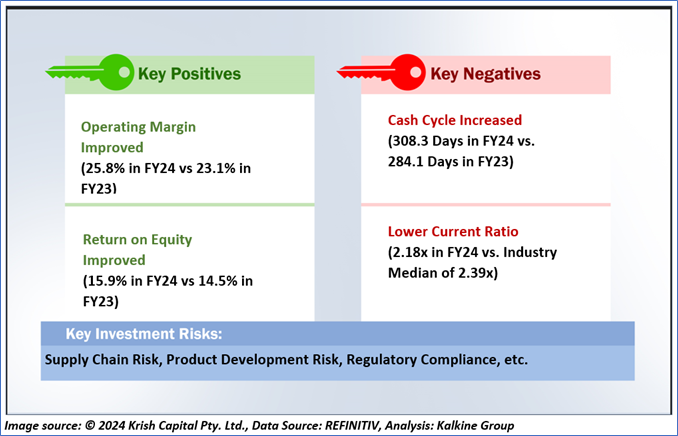
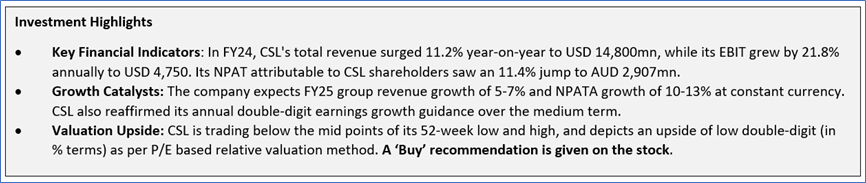
1.3 The Key Positives, Negatives, Investment Highlights, and Risks
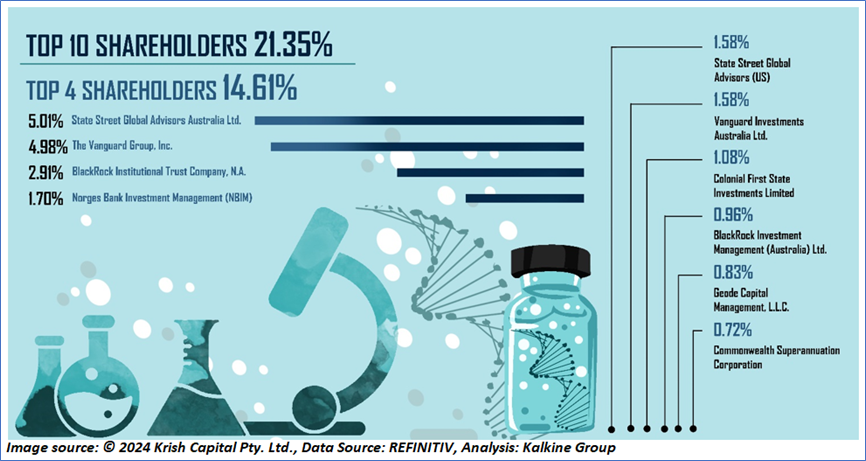
1.4 Top 10 Shareholders:
The top 10 shareholders together form ~21.35% of the total shareholding. State Street Global Advisors Australia Ltd. and The Vanguard Group, Inc., hold maximum stakes in the company at ~5.01% and ~4.98%, respectively.
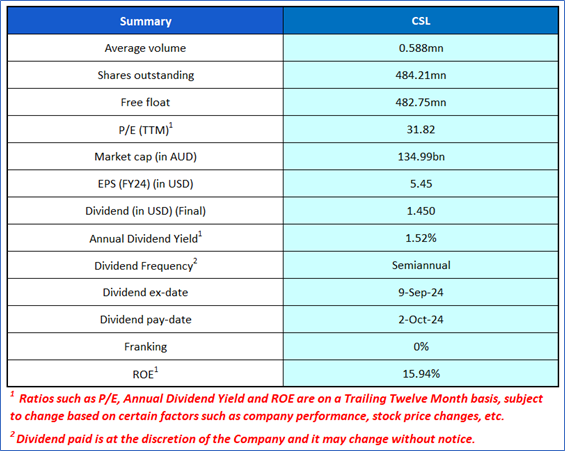
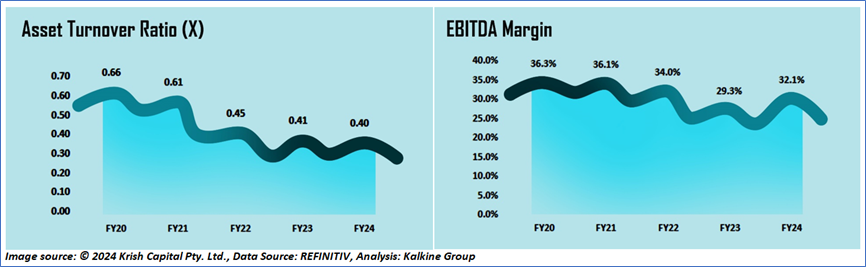
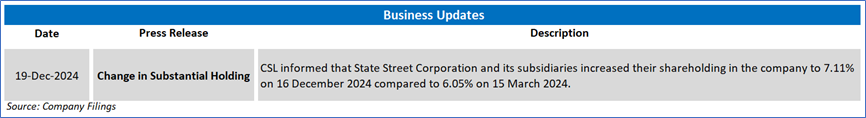
1.5 Key Metrics: CSL's operating margin improved to 25.8% in FY24 vs 23.1% in FY23. Below are captured other metrics:
Section 2: Business Updates, Financial and Operational Highlights
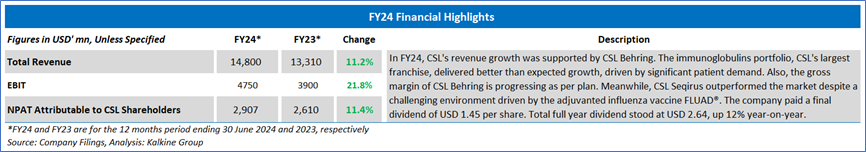
2.1 Recent Business Updates:
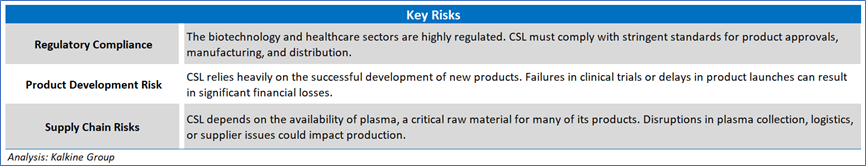
2.2 FY24 Results Highlights
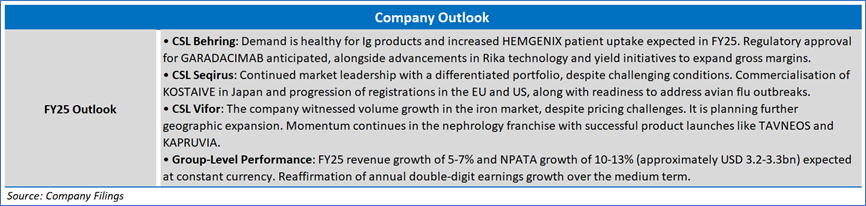
Section 3: Key Risks and Outlook:
Section 4: Stock Recommendation Summary
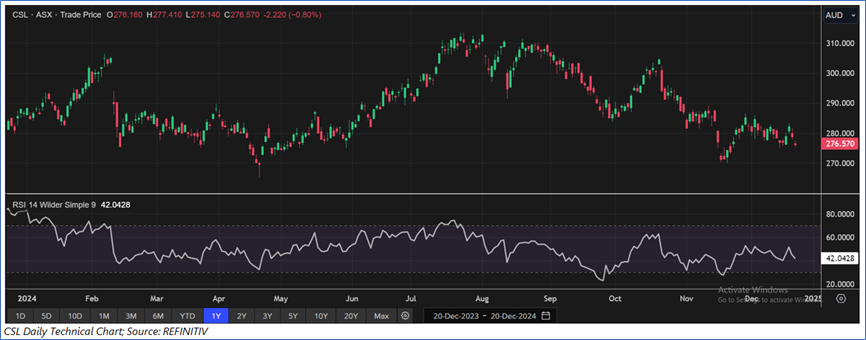
4.1 Price Performance and Technical Summary
The stock price has declined by ~5.81% in the last three months, whereas over the last six months, it has increased by ~5.61%. The stock has a 52-week low and 52-week high of AUD 265.14 and AUD 313.55, respectively, and is currently trading below the midpoints of its 52-week low and 52-week high. CSL was last covered in a report dated ‘15 July 2024’.
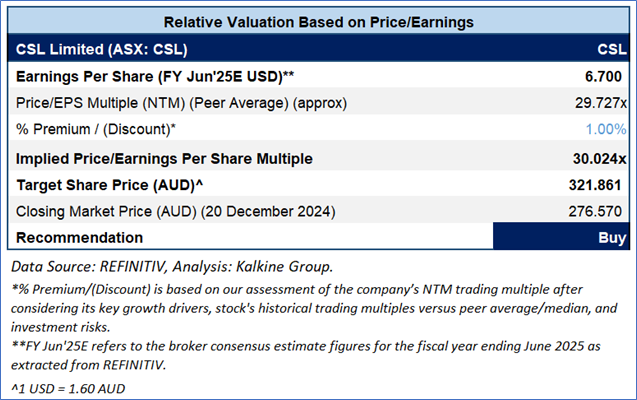
4.2 Fundamental Valuation
Valuation Methodology: P/E Multiple Based Relative Valuation (Illustrative)
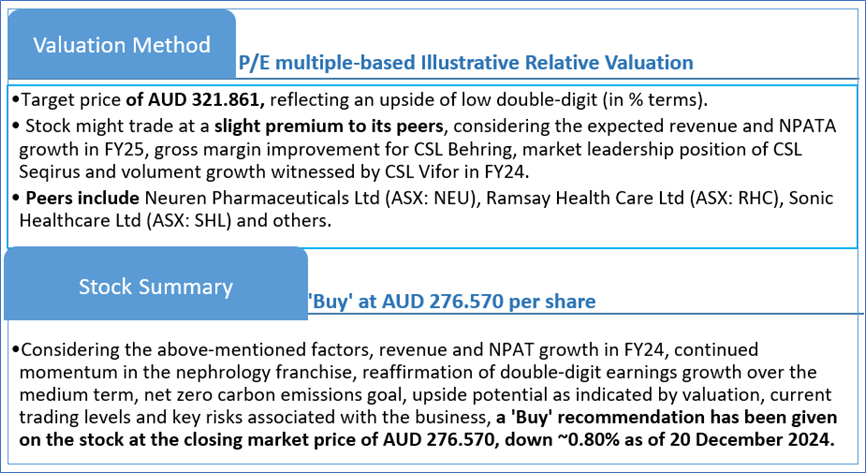
Markets are trading in a highly volatile zone currently due to certain macro-economic issues and geopolitical tensions prevailing. Therefore, it is prudent to follow a cautious approach while investing.
Note 1: Past performance is neither an indicator nor a guarantee of future performance.
Note 2: The reference date for all price data, currency, technical indicators, support, and resistance levels is 20 December 2024. The reference data in this report has been partly sourced from REFINITIV.
Note 3: Investment decisions should be made depending on an individual's appetite for upside potential, risks, holding duration, and any previous holdings. An 'Exit' from the stock can be considered if the Target Price mentioned as per the Valuation and or the technical levels provided has been achieved and is subject to the factors discussed above.
Note 4: Dividend Yield may vary as per the stock price movement.
Note 5: Kalkine reports are prepared based on the stock prices captured either from REFINITIV or Trading View. Typically, REFINITIV or Trading View may reflect stock prices with a delay which could be a lag of 25-30 minutes. There can be no assurance that future results or events will be consistent with the information provided in the report. The information is subject to change without any prior notice.
Technical Indicators Defined: -
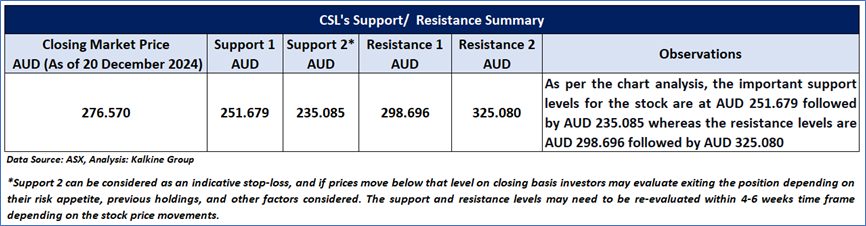
Support: A level at which the stock prices tend to find support if they are falling, and a downtrend may take a pause backed by demand or buying interest. Support 1 refers to the nearby support level for the stock and if the price breaches the level, then Support 2 may act as the crucial support level for the stock.
Resistance: A level at which the stock prices tend to find resistance when they are rising, and an uptrend may take a pause due to profit booking or selling interest. Resistance 1 refers to the nearby resistance level for the stock and if the price surpasses the level, then Resistance 2 may act as the crucial resistance level for the stock.
Stop-loss: It is a level to protect further losses in case of unfavourable movement in the stock prices.
Disclaimer This report has been issued by Kalkine New Zealand Limited (FSP691351) (NZBN:9429047678101) (“Kalkine”). Kalkine is a Financial Advice Provider (“FAP”) and is authorised by a Class 1 Financial Advice Provider Licence issued by Financial Markets Authority (“FMA”) to provide financial advice. Kalkine provides only general financial advice through its research reports following a person becoming a member. The reports contain buy/sell/hold and other recommendations in relation to equity securities, managed funds and other managed investment schemes and other financial advice products. The recommendations and opinions in this report and on Kalkine website do not take into account any of your investment objectives, financial situation or needs. Before you make a decision about whether to acquire a financial product, you should obtain the Product Disclosure Statement from the product issuer. You should consider the appropriateness of advice taking into account your own objectives, financial situation and needs and seek independent financial advice before making any financial decisions. If you act on the advice in the research reports, you may have to pay fees, expenses or other amounts (but not to Kalkine). Further information about the complaints and dispute resolution process, as well as information about Kalkine’s duties are available on Kalkine’s website. Please read our Financial Advice Provider (FAP) disclosure statement and Complaints Handling Guide, which are available on the website.
Past performance is not a reliable indicator of future performance.
 Please wait processing your request...