Section 1: Company Overview and Fundamentals
1.1 Company Overview:
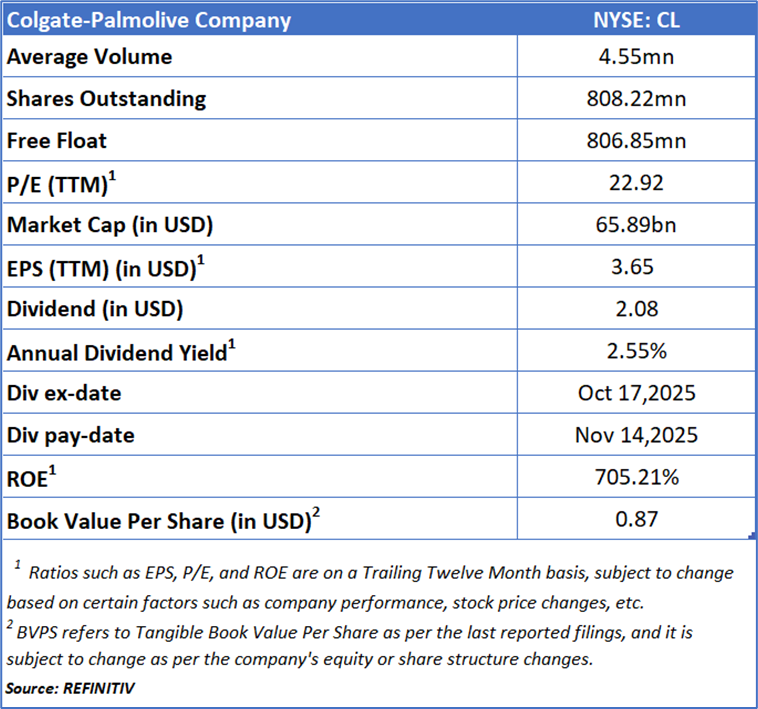
Colgate-Palmolive Company (NYSE: CL) is a growth-driven business, specializing in Oral Care, Personal Care, Home Care, and Pet Nutrition.
Kalkine’s Low Carbon Research Report covers the Investment Highlights, Low Carbon Emission Initiatives, Key Financial Metrics, Risks, and Technical Analysis along with the Valuation, Target Price, and Recommendation on the stock.
Stock Performance:
1.2 Why do Low Carbon Emissions matter?
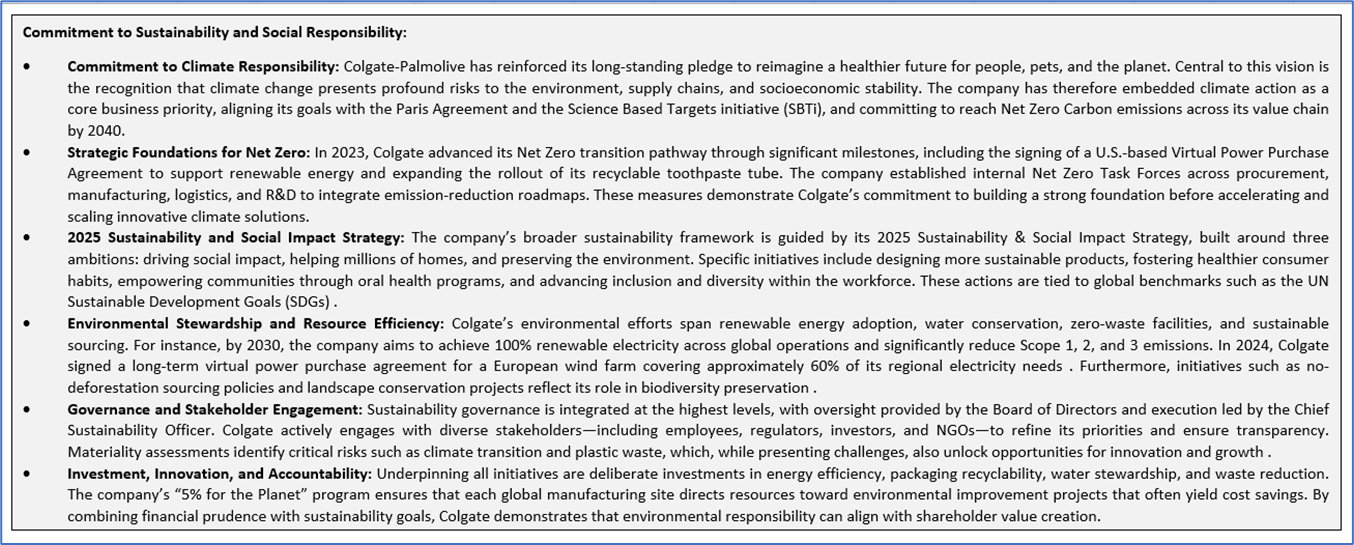
The shift toward a low-carbon economy is one of the most significant challenges of current time, spurred by the urgent need to combat climate change and reduce the environmental impact of corporate activities. This report covers the US-listed low-carbon emission company Colgate-Palmolive Company (NYSE: CL), that is committed to sustainability and responsible environmental practices.
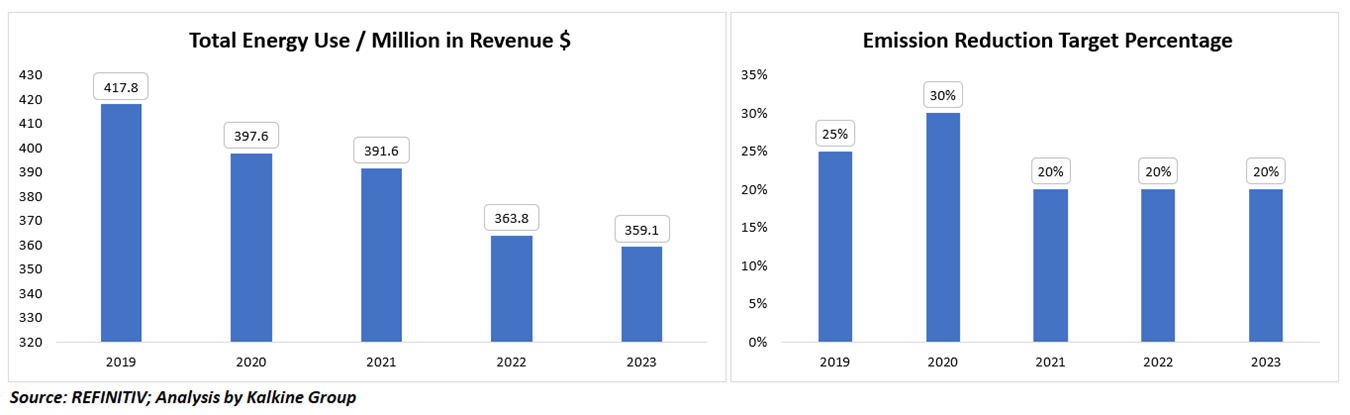
Carbon and Waste Management - Key Metrics
Between 2019 and 2023, Colgate-Palmolive achieved a steady reduction in energy use per million dollars of revenue, falling from 417.8 to 359.1, reflecting improved operational efficiency, greater reliance on renewable energy, and stronger sustainability practices. In contrast, emission reduction targets fluctuated — rising ambitiously to 30% in 2020 but then stabilizing at 20% from 2021 onwards — indicating a recalibration of goals after initial over-ambition, influenced by factors such as pandemic-related disruptions, supply chain constraints, and the need for more consistent, achievable milestones within its long-term Net Zero 2040 roadmap.
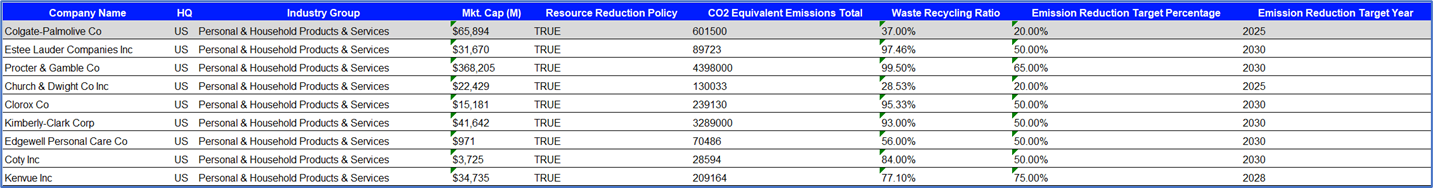
Peer Comparison: Carbon Emission and Waste Management Metrics
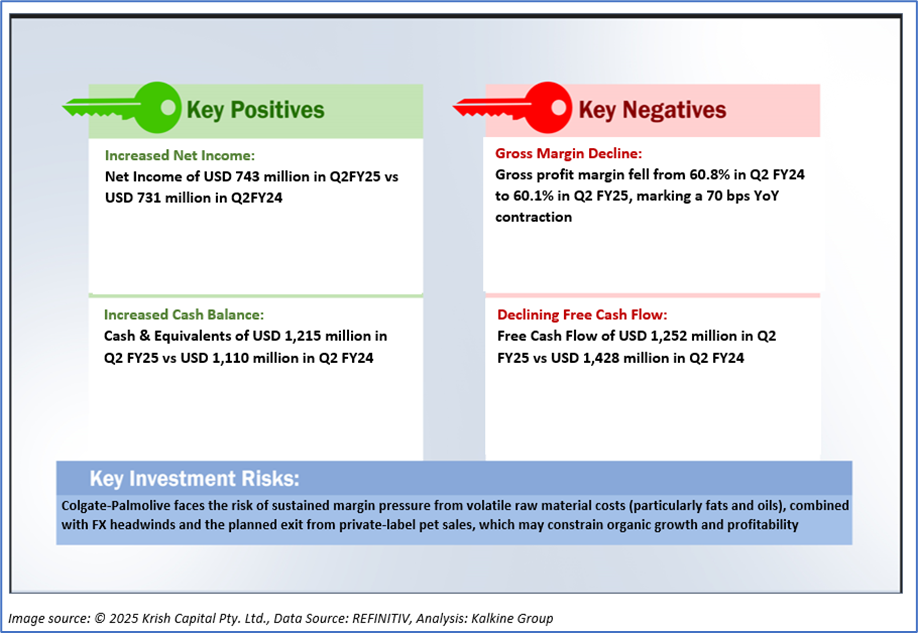
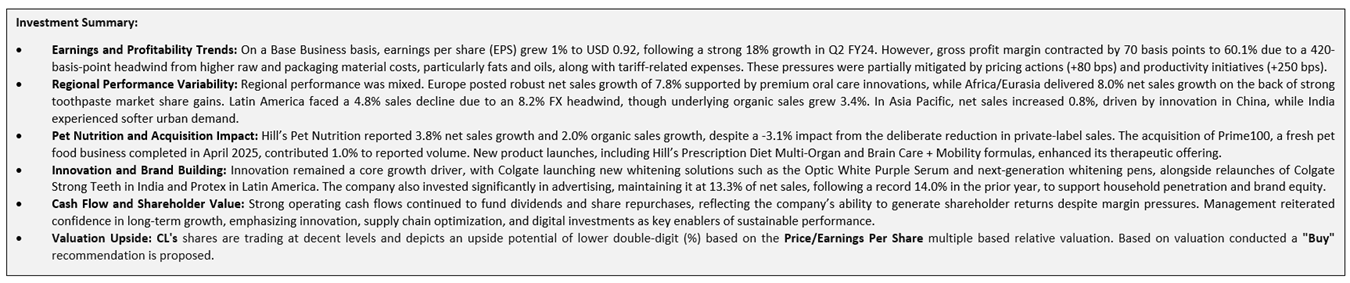
1.2 The Key Positives, Negatives, and Investment summary
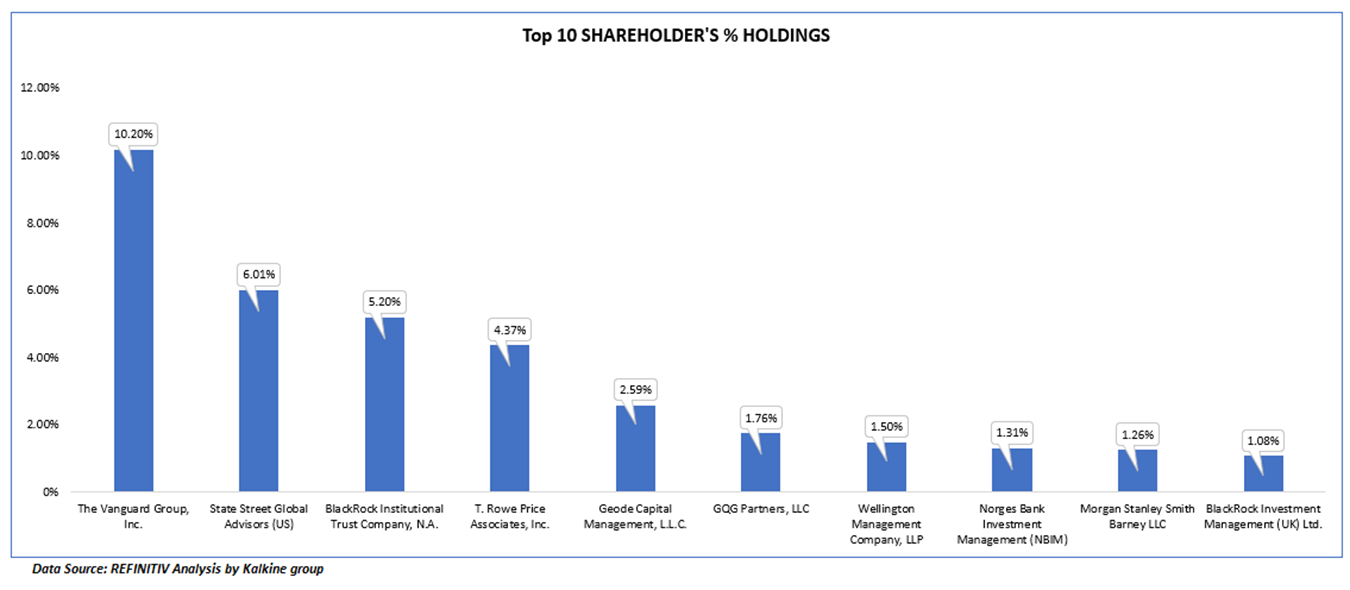
1.3 Top 10 shareholders:
The top 10 shareholders together form ~35.28% of the total shareholding, signifying concentrated shareholding. The Vanguard Group, Inc. and State Street Global Advisors (US). are the biggest shareholders, holding the maximum stake in the company at 10.20% and 6.01%, respectively.
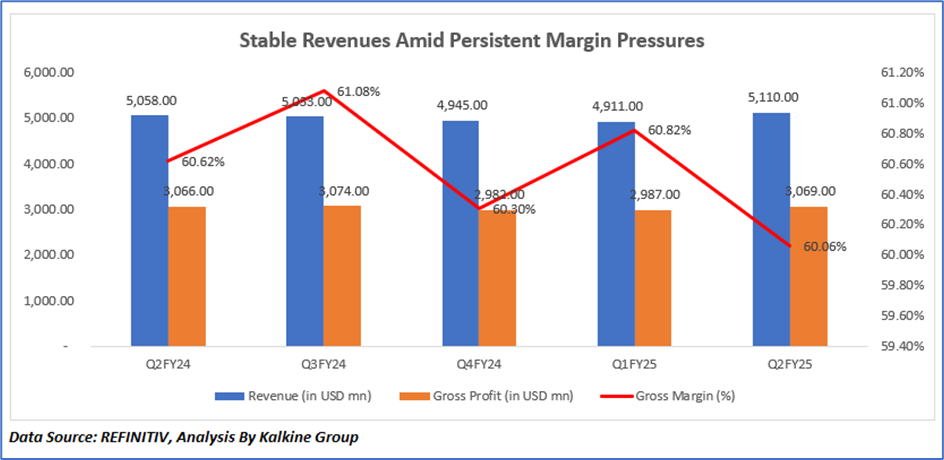
1.4 Key Metrics
Colgate-Palmolive’s revenue trajectory reflected both growth initiatives and external pressures across the period. After modest gains from Q2 to Q3 FY24, supported by strong organic growth and pricing, revenue dipped in Q4 FY24 due to tougher prior-year comparisons and softer category demand. It then stabilized in Q1 FY25 as pricing actions and innovation offset weaker volumes, before rising again in Q2 FY25, aided by strength in oral care and the Hill’s Pet Nutrition acquisition, though momentum was dampened by foreign exchange headwinds and the planned exit from private-label pet sales. Gross profit broadly tracked revenue but was consistently constrained by elevated raw and packaging material costs, particularly fats and oils, despite productivity savings and premium innovation. Gross margin peaked in Q3 FY24 on favorable mix and pricing, fell sharply in Q4 FY24 with intensifying cost and FX pressures, recovered modestly in Q1 FY25, and dropped again in Q2 FY25 as inflationary input costs and tariffs outweighed efficiency gains.
Section 2: Business Updates and Corporate Business Highlights
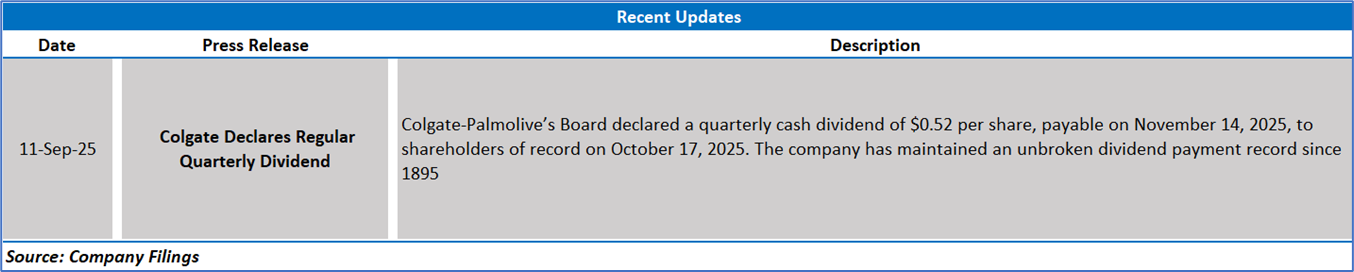
2.1 Key Business Updates:
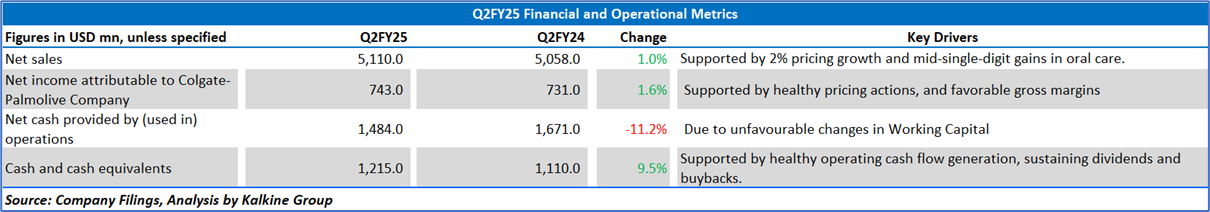
2.2 Insights of Q2 FY25:
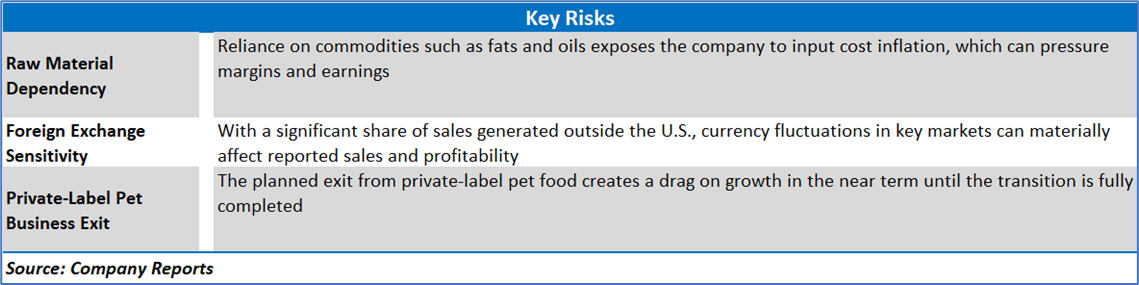
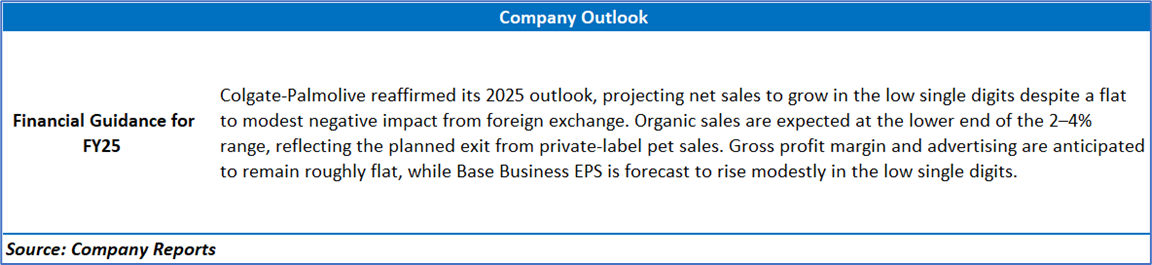
Section 3: Key Risks & Outlook
Section 4: Stock Recommendation Summary:
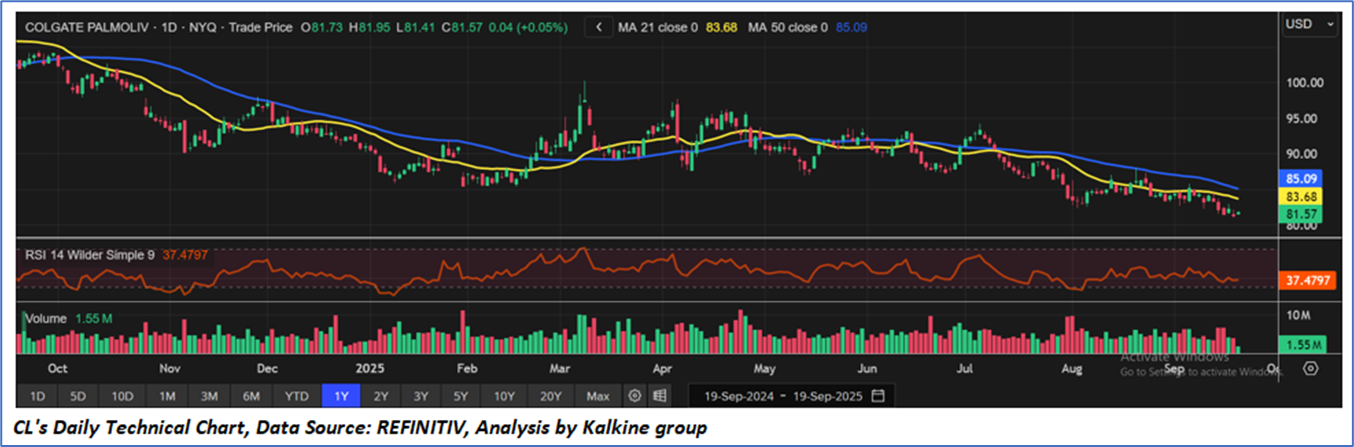
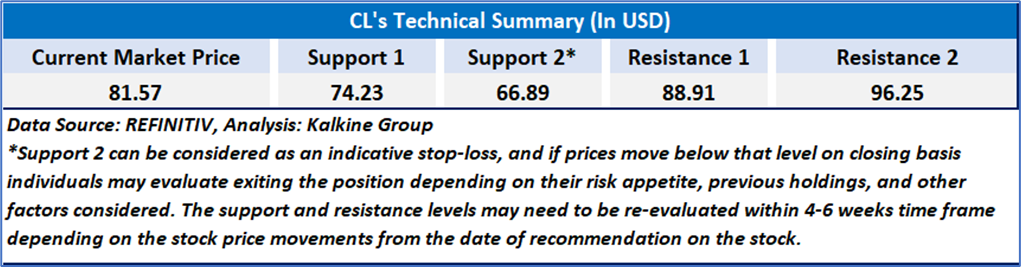
4.1 Price Performance and Technical Summary:
Stock Performance:
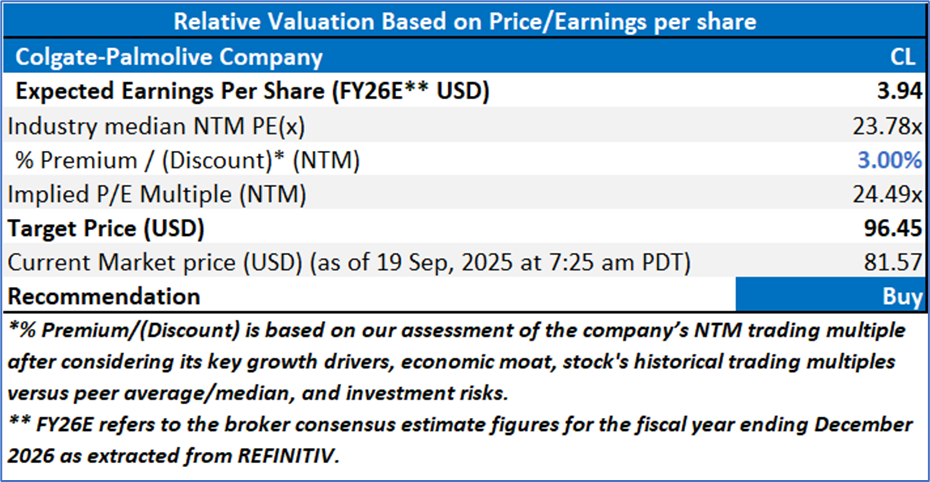
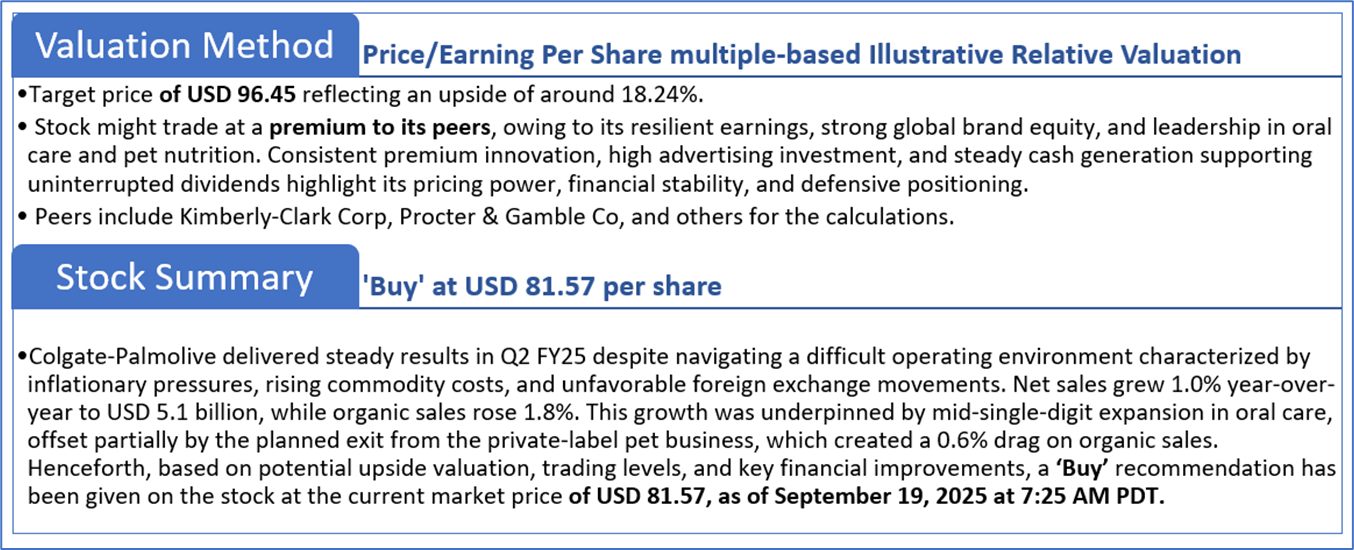
4.2 Fundamental Valuation
Valuation Methodology: Price/Earnings Per Share Multiple Based Relative Valuation
Markets are trading in a highly volatile zone currently due to certain macroeconomic issues and geopolitical tensions prevailing. Therefore, it is prudent to follow a cautious approach while investing.
Note 1: Past performance is not a reliable indicator of future performance.
Note 2: The reference date for all price data, currency, technical indicators, support, and resistance levels is Sep 19, 2025. The reference data in this report has been partly sourced from REFINITIV.
Note 3: Investment decisions should be made depending on an individual's appetite for upside potential, risks, holding duration, and any previous holdings. An 'Exit' from the stock can be considered if the Target Price mentioned as per the Valuation and or the technical levels provided has been achieved and is subject to the factors discussed above.
Note 4: The report publishing date is as per the Pacific Time Zone.
Technical Indicators Defined: -
Support: A level at which the stock prices tend to find support if they are falling, and a downtrend may take a pause backed by demand or buying interest. Support 1 refers to the nearby support level for the stock and if the price breaches the level, then Support 2 may act as the crucial support level for the stock.
Resistance: A level at which the stock prices tend to find resistance when they are rising, and an uptrend may take a pause due to profit booking or selling interest. Resistance 1 refers to the nearby resistance level for the stock and if the price surpasses the level, then Resistance 2 may act as the crucial resistance level for the stock.
Stop-loss: It is a level to protect against further losses in case of unfavorable movement in the stock prices.
Disclaimer This report has been issued by Kalkine New Zealand Limited (FSP691351) (NZBN:9429047678101) (“Kalkine”). Kalkine is a Financial Advice Provider (“FAP”) and is authorised by a Class 1 Financial Advice Provider Licence issued by Financial Markets Authority (“FMA”) to provide financial advice. Kalkine provides only general financial advice through its research reports following a person becoming a member. The reports contain buy/sell/hold and other recommendations in relation to equity securities, managed funds and other managed investment schemes and other financial advice products. The recommendations and opinions in this report and on Kalkine website do not take into account any of your investment objectives, financial situation or needs. Before you make a decision about whether to acquire a financial product, you should obtain the Product Disclosure Statement from the product issuer. You should consider the appropriateness of advice taking into account your own objectives, financial situation and needs and seek independent financial advice before making any financial decisions. If you act on the advice in the research reports, you may have to pay fees, expenses or other amounts (but not to Kalkine). Further information about the complaints and dispute resolution process, as well as information about Kalkine’s duties are available on Kalkine’s website. Please read our Financial Advice Provider (FAP) disclosure statement and Complaints Handling Guide, which are available on the website.
Past performance is not a reliable indicator of future performance.
 Please wait processing your request...